Published online Jun 6, 2021. doi: 10.12998/wjcc.v9.i16.3880
Peer-review started: January 22, 2021
First decision: February 28, 2021
Revised: March 10, 2021
Accepted: March 23, 2021
Article in press: March 23, 2021
Published online: June 6, 2021
Processing time: 112 Days and 1 Hours
Colorectal cancer (CRC) is one of the most malignant gastrointestinal cancers worldwide. The liver is the most important metastatic target organ, and liver metastasis is the leading cause of death in patients with CRC. Owing to the lack of sensitive biomarkers and unclear molecular mechanism, the occurrence of liver metastases cannot be predicted and the clinical outcomes are bad for liver metastases. Therefore, it is very important to identify the diagnostic or prognostic markers for liver metastases of CRC.
To investigate the highly differentially expressed genes (HDEGs) and prognostic marker for liver metastases of CRC.
Data from three NCBI Gene Expression Omnibus (GEO) datasets were used to show HDEGs between liver metastases of CRC and tumour or normal samples. These significantly HDEGs of the three GEO datasets take the interactions. And these genes were screened through an online tool to explore the prognostic value. Then, TIMER and R package were utilized to investigate the immunity functions of the HDEGs and gene set enrichment analysis was used to explore their potential functions.
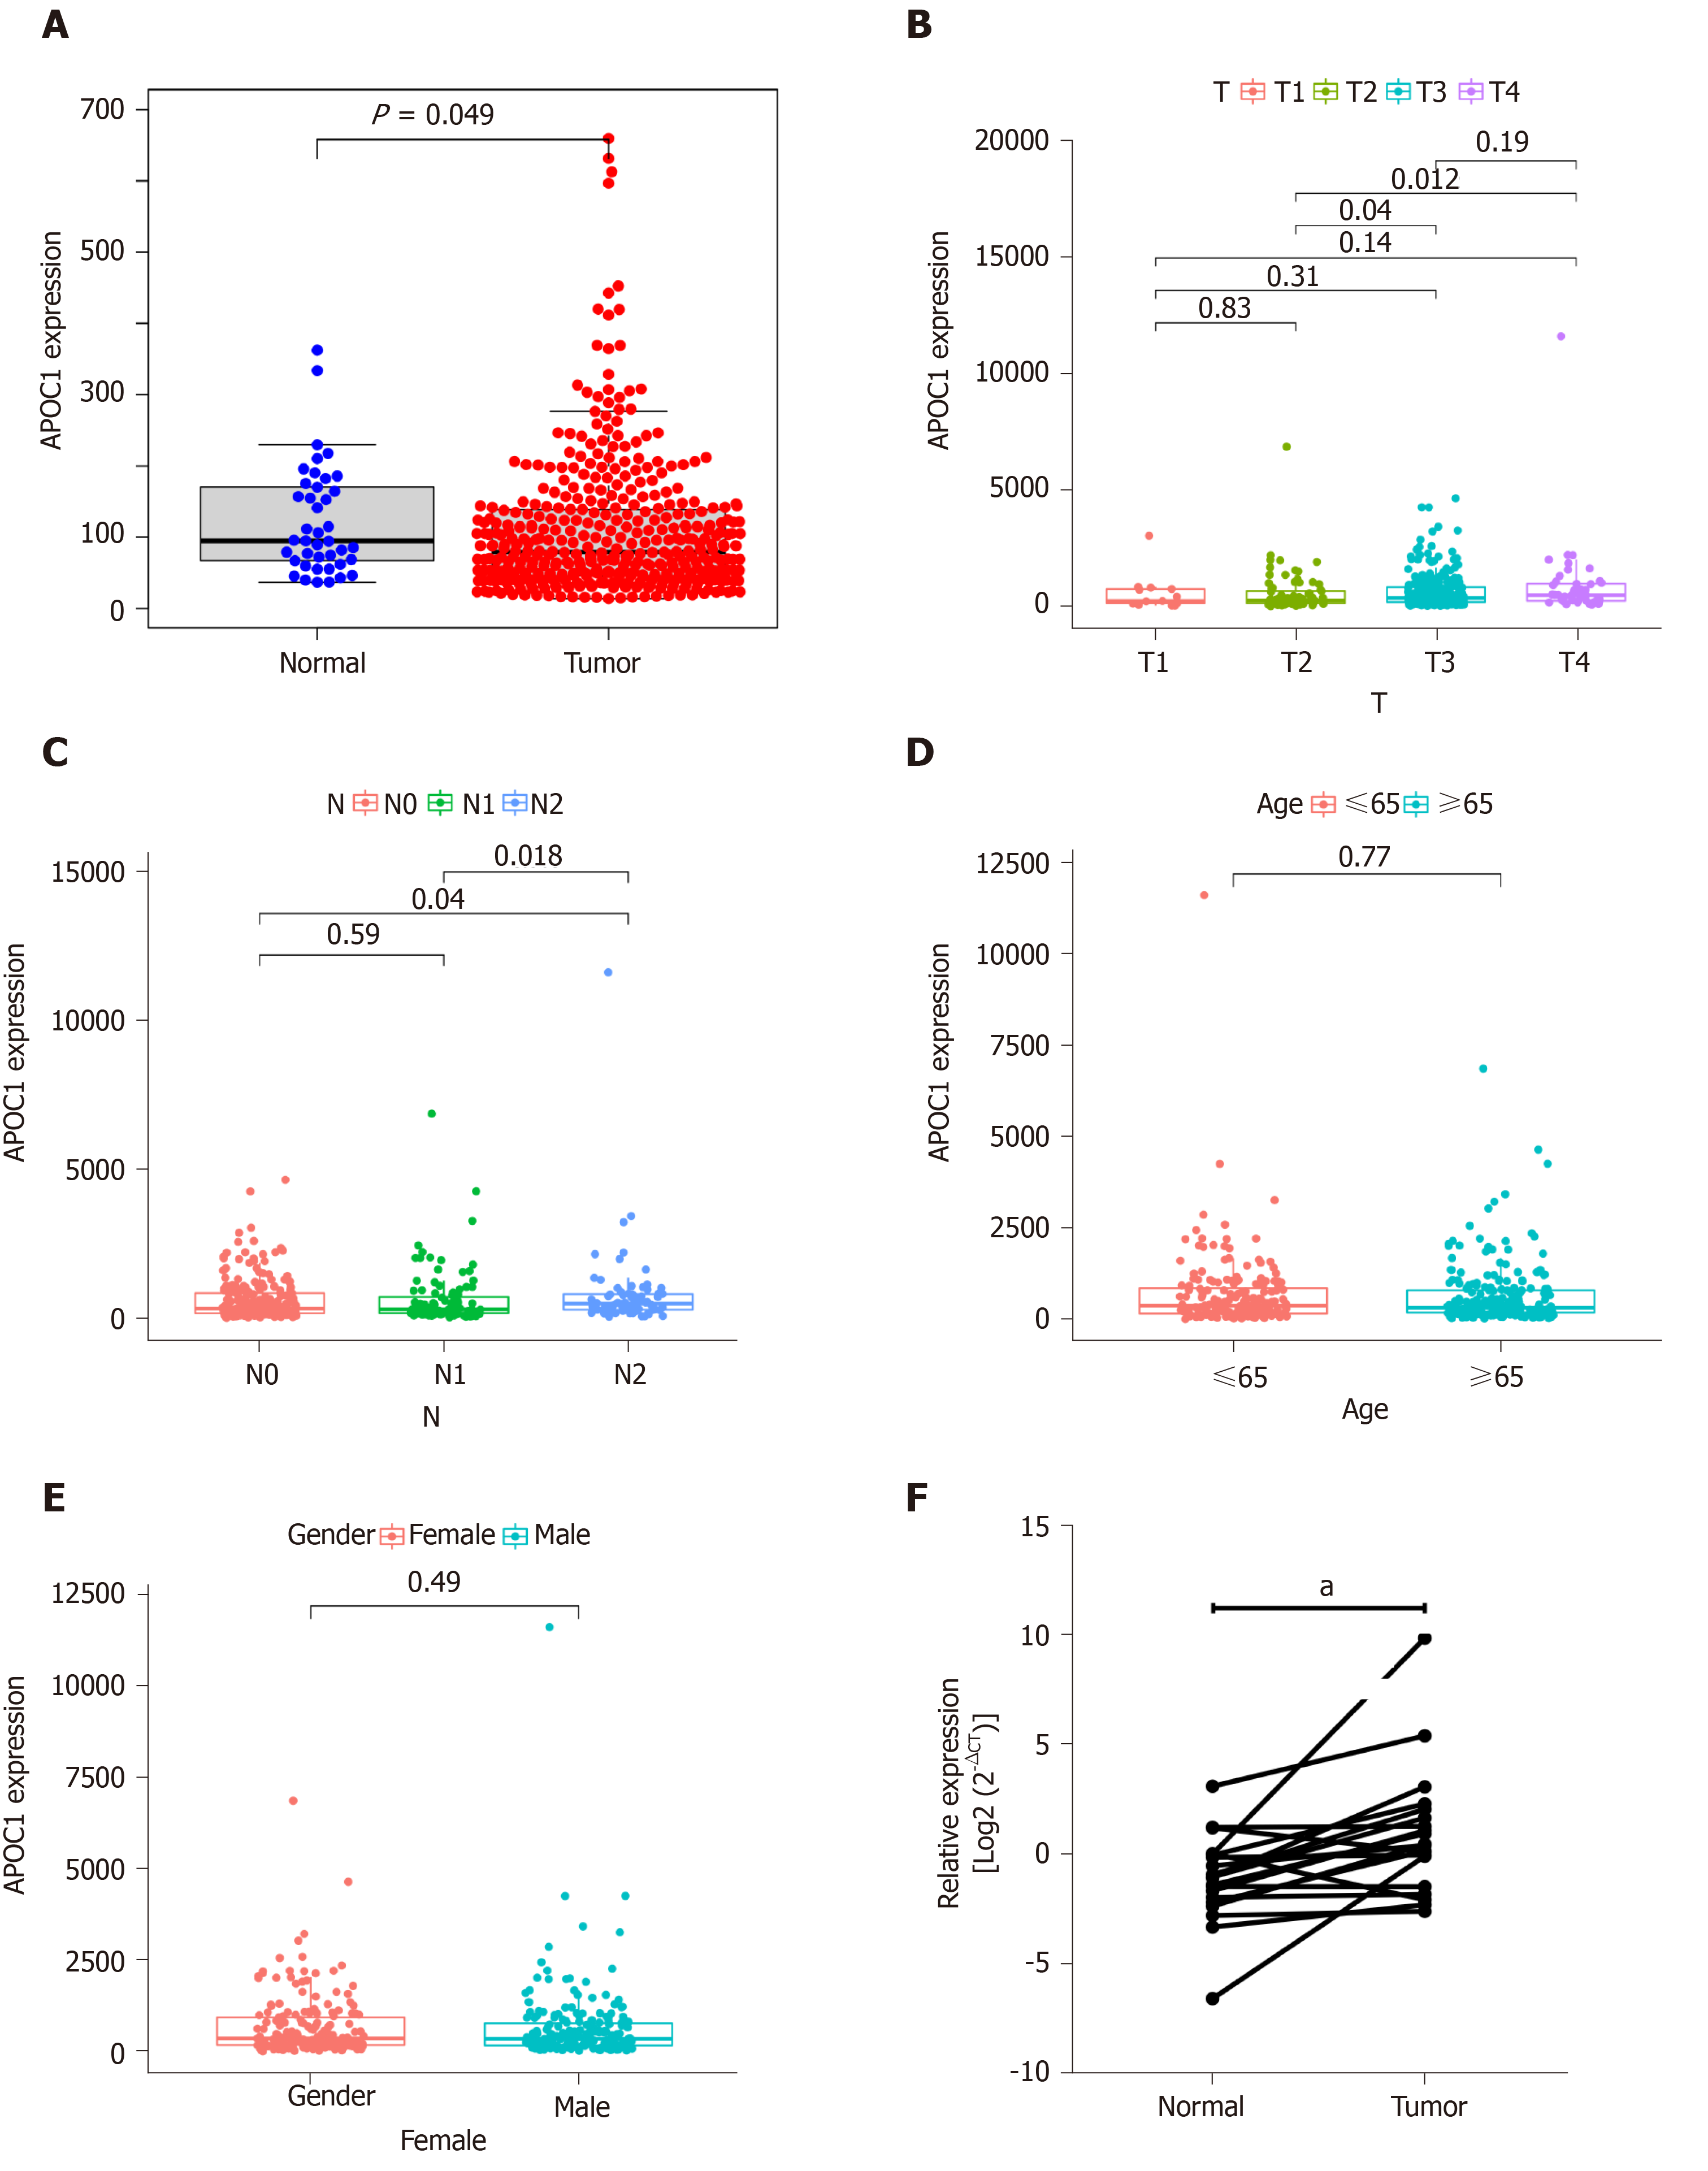
Based on the selection criteria, three CRC datasets for exploration (GSE14297, GSE41258, and GSE49355) were chosen. Venn diagrams were used to show HDEGs common to the six groups and 47 HDEGs were obtained. The HDEGs were shown by using STRING and Cytoscape software. Based on the TCGA database, APOC1 showed significantly different expression between N2 and N0, and N2 and N1. And there was also a significant difference in expression between T2 and T4, and between T2 and T3. In 20 paired CRC and normal tissues, quantitative real-time polymerase chain reaction illustrated that the APOC1 mRNA was strongly upregulated in CRC tissues (P = 0.014). PrognoScan and GEPIA2 revealed the prognostic value of APOC1 for overall survival and disease-free survival in CRC (P < 0.05). TIMER showed that APOC1 has a close relationship with immune infiltration (P < 0.05).
APOC1 is a biomarker that is associated with both the diagnosis and prognosis of liver metastases of CRC.
Core Tip: It is important to identify the diagnostic or prognostic markers for liver metastasis (LM) of colorectal cancer (CRC). Three datasets from NCBI Gene Expression Omnibus (GEO) were used to identify highly differentially expressed genes (HDEGs) between LM and tumor or normal samples. Then, HDEGs of the three GEO datasets take the intersections. The prognostic value of these genes was analyzed through online tools, which finally showed that APOC1 was associated with the prognosis of CRC. Analysis of the relationship with immune infiltration and tumor microenvironment and GSEA of APOC1 demonstrated that APOC1 was strongly associated with CRC development. In conclusion, APOC1 is a biomarker associated with both the diagnosis and prognosis of LM of CRC.
- Citation: Shen HY, Wei FZ, Liu Q. Differential analysis revealing APOC1 to be a diagnostic and prognostic marker for liver metastases of colorectal cancer. World J Clin Cases 2021; 9(16): 3880-3894
- URL: https://www.wjgnet.com/2307-8960/full/v9/i16/3880.htm
- DOI: https://dx.doi.org/10.12998/wjcc.v9.i16.3880
Colorectal cancer (CRC) is one of the most malignant gastrointestinal cancers worldwide[1]. The liver is the most important metastatic target organ, and liver metastasis (LM) is the leading cause of death in patients with CRC[2,3]. Approximately 30%-50% of patients are confirmed with postoperative liver metastases and 80%-90% of these are initially unable to achieve radical resection[4-8]. Owing to the lack of sensitive biomarkers and unclear molecular mechanism, the occurrence of liver metastases cannot be predicted, and the incidence and mortality due to CRC continue to increase[9]. Detection and monitoring of liver metastases of CRC depend on the imaging examination, serum biomarker detection, and other examinations; however, these methods have some limitations. Some patients are not willing to undergo colonoscopy, thus CRC and the occurrence of CRC liver metastases cannot be timely detected[10]. In the recent 20 years, many new technologies have been applied to explore the gene expression and functions in human malignant tumours[11].
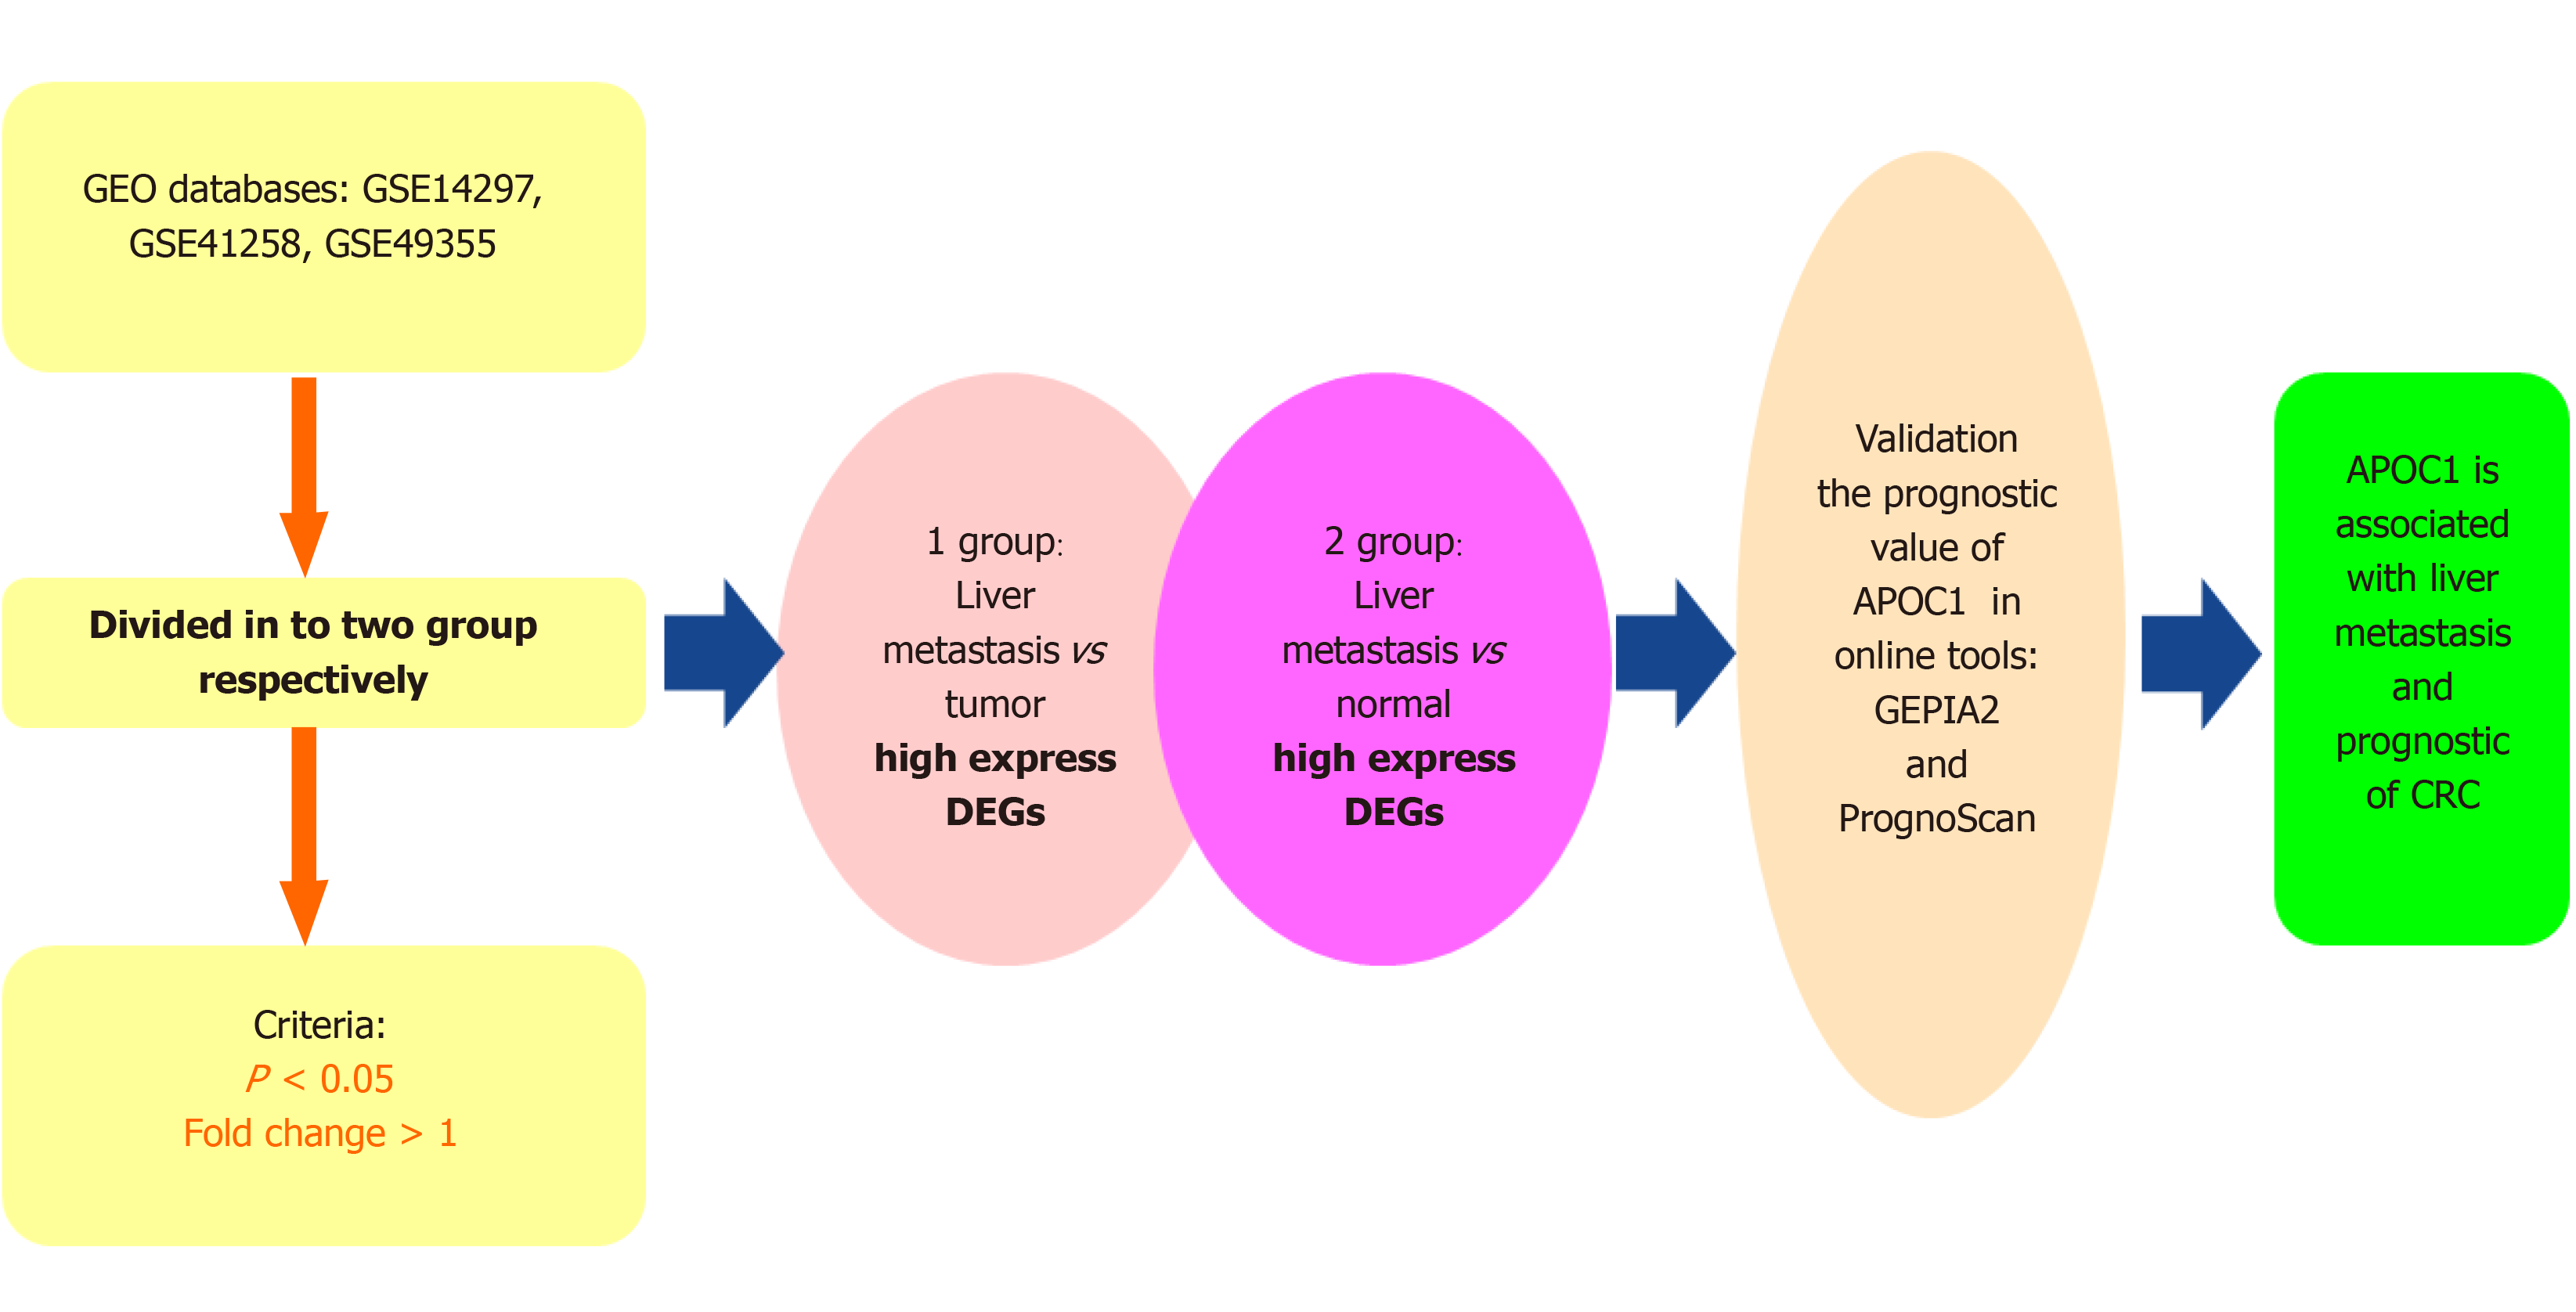
In our study, we explored data from three microarray datasets from the NCBI Gene Expression Omnibus (GEO)[12] to identify highly differentially expressed genes (HDEGs). These significantly highly expressed genes of the three GEO datasets take the interactions. GO[13]and KEGG[14] analyses were utilized to show the functions of the HDEGs. The GEPIA2 and PrognoScan online tools were used to validate the prognostic value of these genes in CRC[15]. APOC1 was found to be a significant gene that is associated with the prognostic value of CRC and CRC LM (Figure 1). The online tool TIMER[16] and R package were used to show the functions of APOC1 with regard to immunity. Also, we applied gene set enrichment analysis (GSEA)[17] to inspect the possible functions of APOC1 in CRC. In addition, we used quantitative real-time polymerase chain reaction (PCR) to detect the mRNA expression level of APOC1 in 20 CRC and paired normal adjacent tissue samples.
We downloaded the RNA sequencing data from GEO (http://www.ncbi.nlm.nih.gov/geo/). The datasets included data for normal tissues, CRC tissues, and LM tissues, and each dataset had a minimum of five tumour and normal tissues. Based on the aforementioned criteria, three GEO datasets were chosen: GSE14297[18], GSE41258[19], and GSE49355[20,21].
Three series matrix files were from GEO and each GEO matrix were divided into two groups: LM-tumour tissue group (L-T) and LM-normal tissue group (L-N). Then, they were screened using R package ‘limma’ for normalisation and HDEG identification. [log(foldchange)] > 1 and P value < 0.05 were used to select DEGs. After obtaining the six sets of highly expressed genes, we used the R package ‘‘Venn’ to identify genes shared among three GEO datasets. We ultimately obtained 48 HDEGs.
The connections among the DEGs were analyzed based on the STRING database[22] (https://string-db.org/cgi/input.pl/). And the Cytoscape software[23] was used to visualize the connections through constructing the protein-protein interaction network.
R packages ‘clusterProfiler’, ‘org.Hs.eg.db’, ‘enrichplot’, and ‘ggplot2’ were used for GO enrichment analysis. KEGG pathway analysis was conducted by using the R packages ‘clusterprofiler’[24], ‘org.Hs.eg.db’, ‘enrichplot’, and ‘ggplot2’. In both the two analyses, statistical significance was considered as an adjusted P value of < 0.05.
We utilized R packages ‘limma’ and ‘beeswarm’ to analyse the expression differences between normal and tumour tissues. We also explored the clinical significance of APOC1 using R packages ‘limma’ and ‘ggpubr’. We utilized the online tools PrognoScan (http://www.prognoscan.org/) to validate the prognostic value of APOC1 in GEO datasets GSE17537[25,26] and GSE14333[27]. We also validated the prognostic value in the TCGA database using the online tool GEPIA2 (http://gepia2.cancer-pku.cn/), which involved TCGA and GTEx data.
TISIDB[28] (http://cis.hku.hk/TISIDB/) was utilized to research the correlation between the gene expression and tumour-infiltrating immune cells. Additionally, we utilized R package ‘estimate’ to research the correlation between the gene expression and three kinds of scores, including the immune score, stromal score, and ESTIMATE score.
The functions of the hub genes were explored by the GSEA. The COAD and READ datasets from TCGA were downloaded and 482 samples were divided into two groups: High and low expression group. The ‘c2.cp.kegg.v6.2.symbols.gmt’ was utilized and P < 0.001 was considered as statistical significance. The R packages ‘plyr’, ‘ggplot2’, ‘grid’, and ‘gridExtra’ were used to show different significant pathways.
RNA was extracted from CRC tissue using the TRIzol method. cDNA was obtained after reverse transcription and used as the template for real-time PCR detection. Then, quantitative real-time PCR was performed to detect the relative mRNA level of APOC1. The primers for APOC1 are: 5-GTCCTGGTGGTGGTTCTGTC-3 (forward) and 5- TCTCTGAAAACCACTCCCGC-3 (reverse).
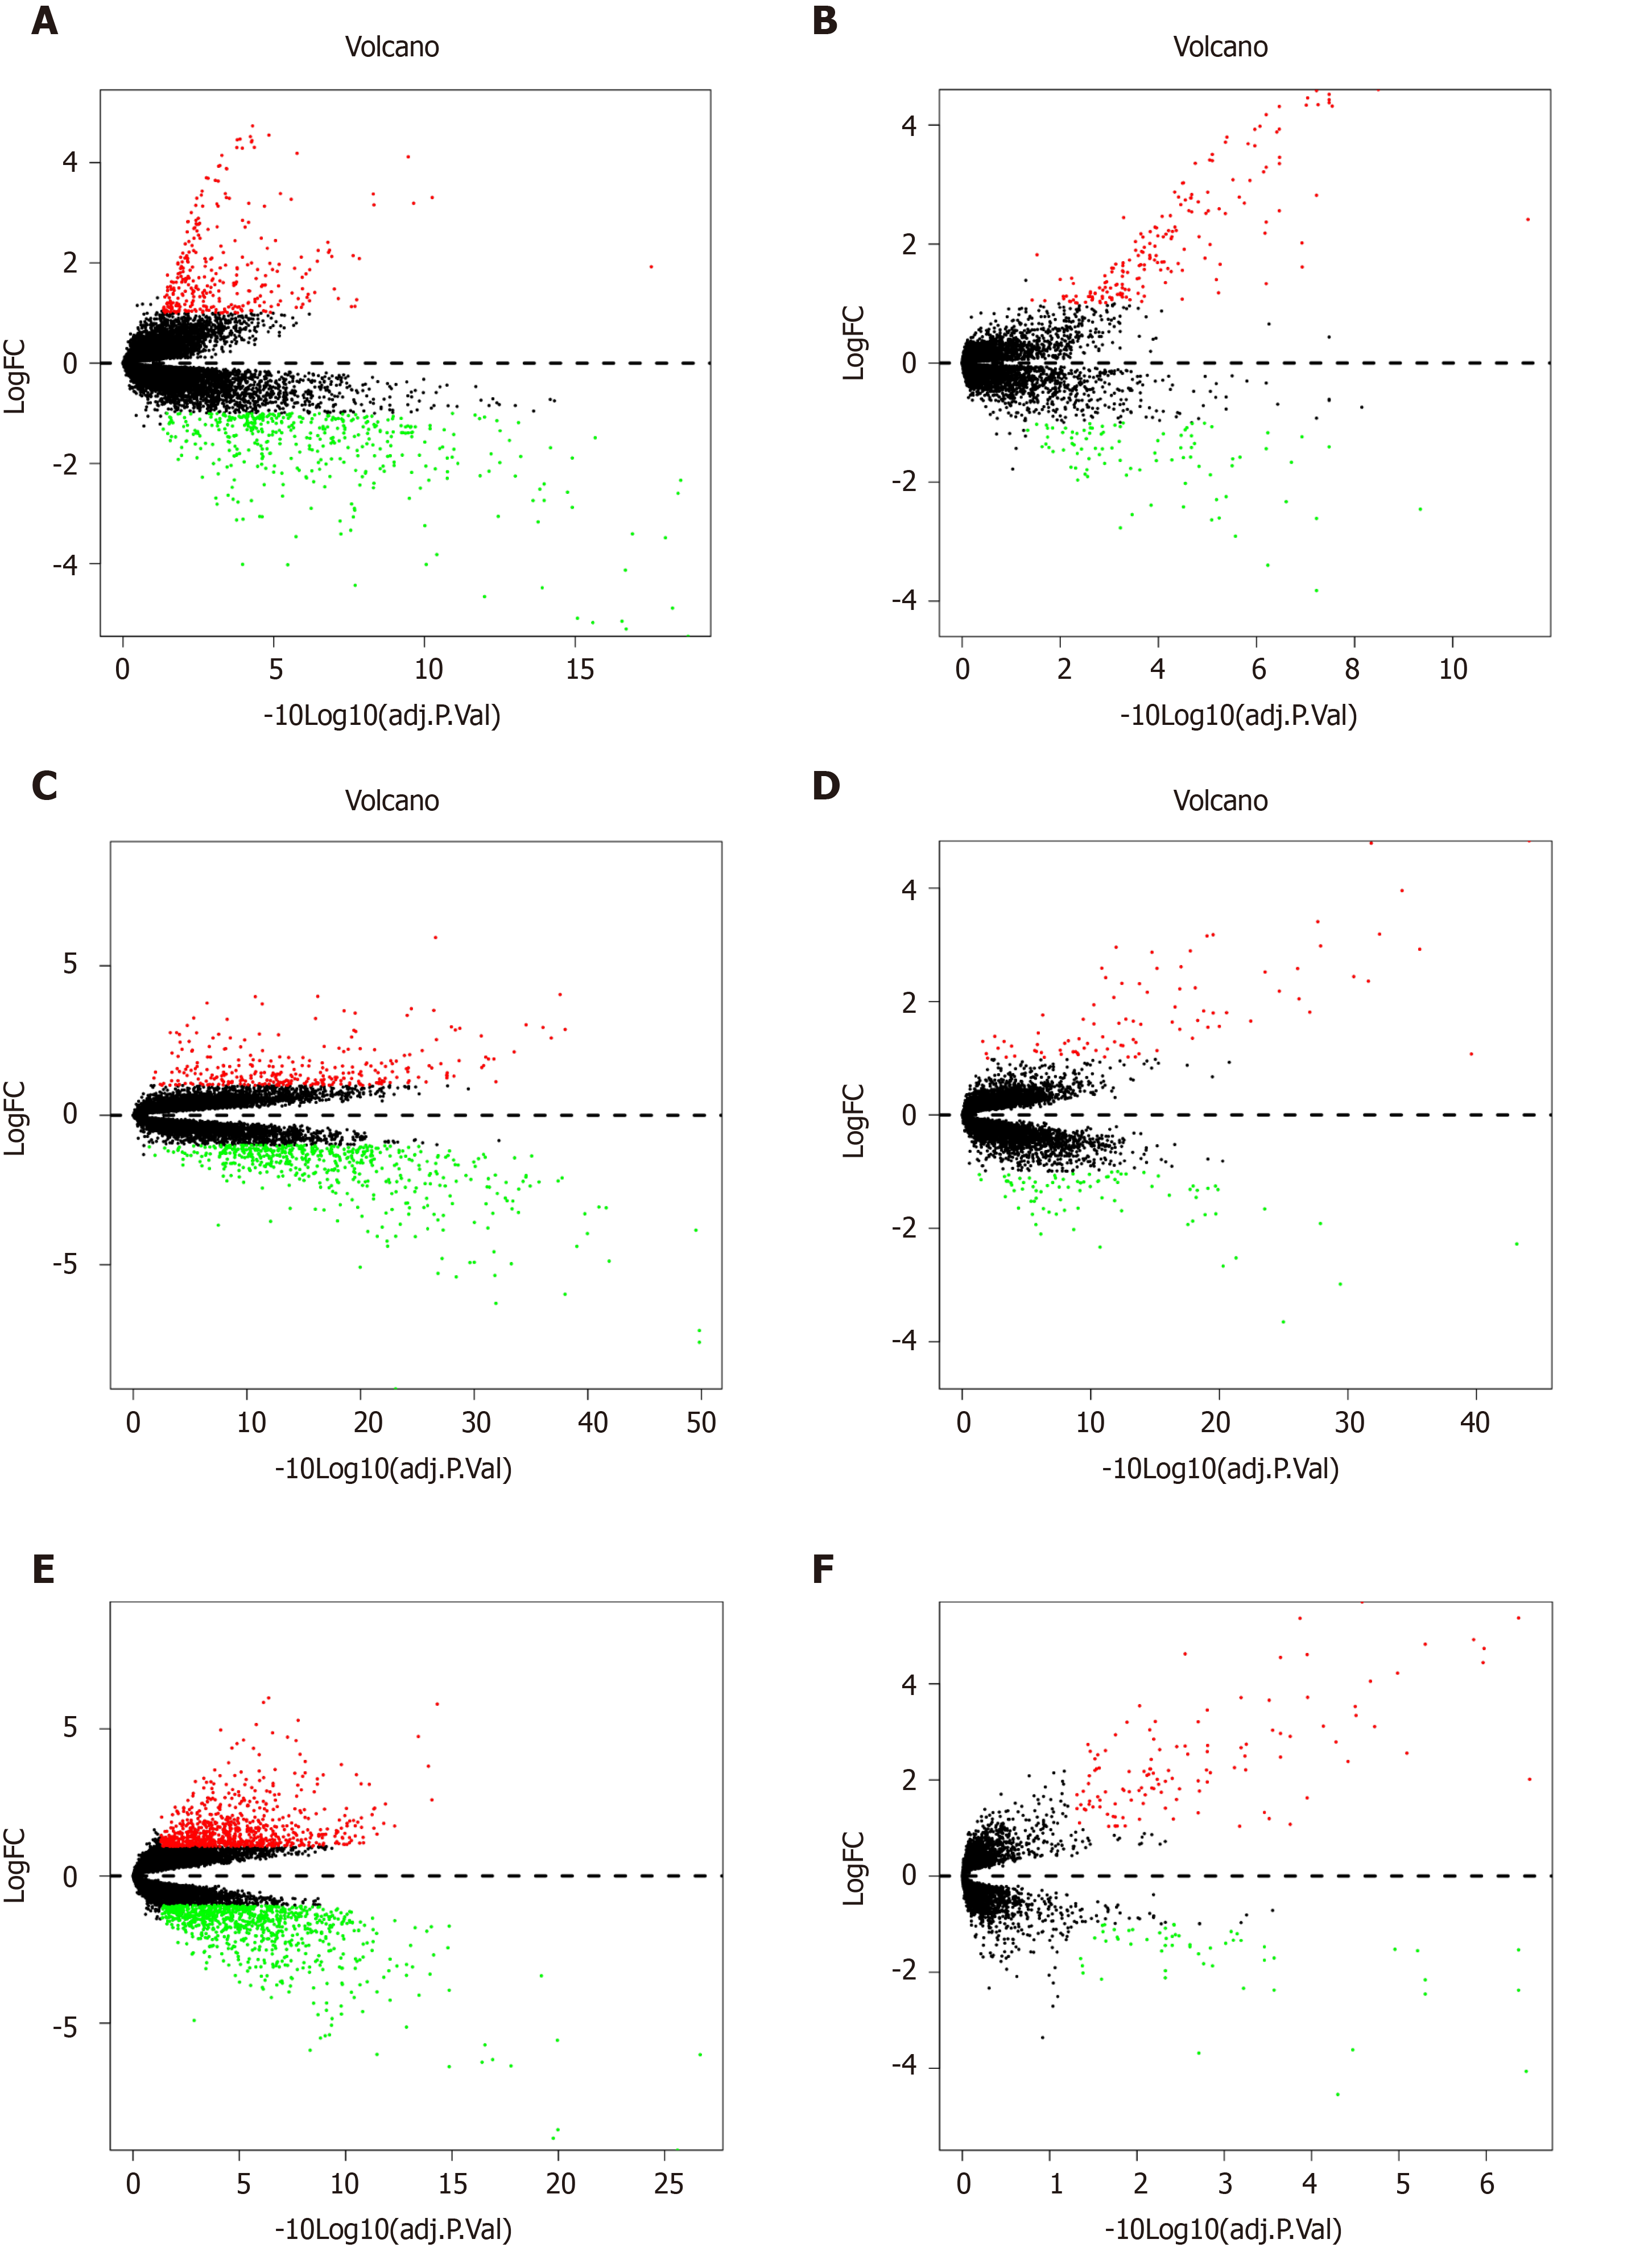
Based on the selection criteria, three CRC datasets were selected for exploration and all characteristics are summarized in Table 1. The 308 genes in the L-N group and 178 genes in the L-T group in the GSE14297; 300 genes in the L-N group and 89 genes in the L-T group in the GSE41258; and 810 genes in the L-N group and 120 genes in the L-T group in the GSE49355 were significantly highly expressed (Table 2). Volcano plots (Figure 2) show the DEGs.
| Dataset | N | T | M | Platform ID | Country |
| GSE41258 | 54 | 186 | 47 | GPL96 | Israel |
| GSE49355 | 18 | 20 | 19 | GPL96 | France |
| GSE14297 | 7 | 18 | 18 | GPL6370 | Germany |
| Dataset | L-T | L-N |
| GSE14297 | 178 | 308 |
| GSE41258 | 89 | 300 |
| GSE49355 | 120 | 810 |
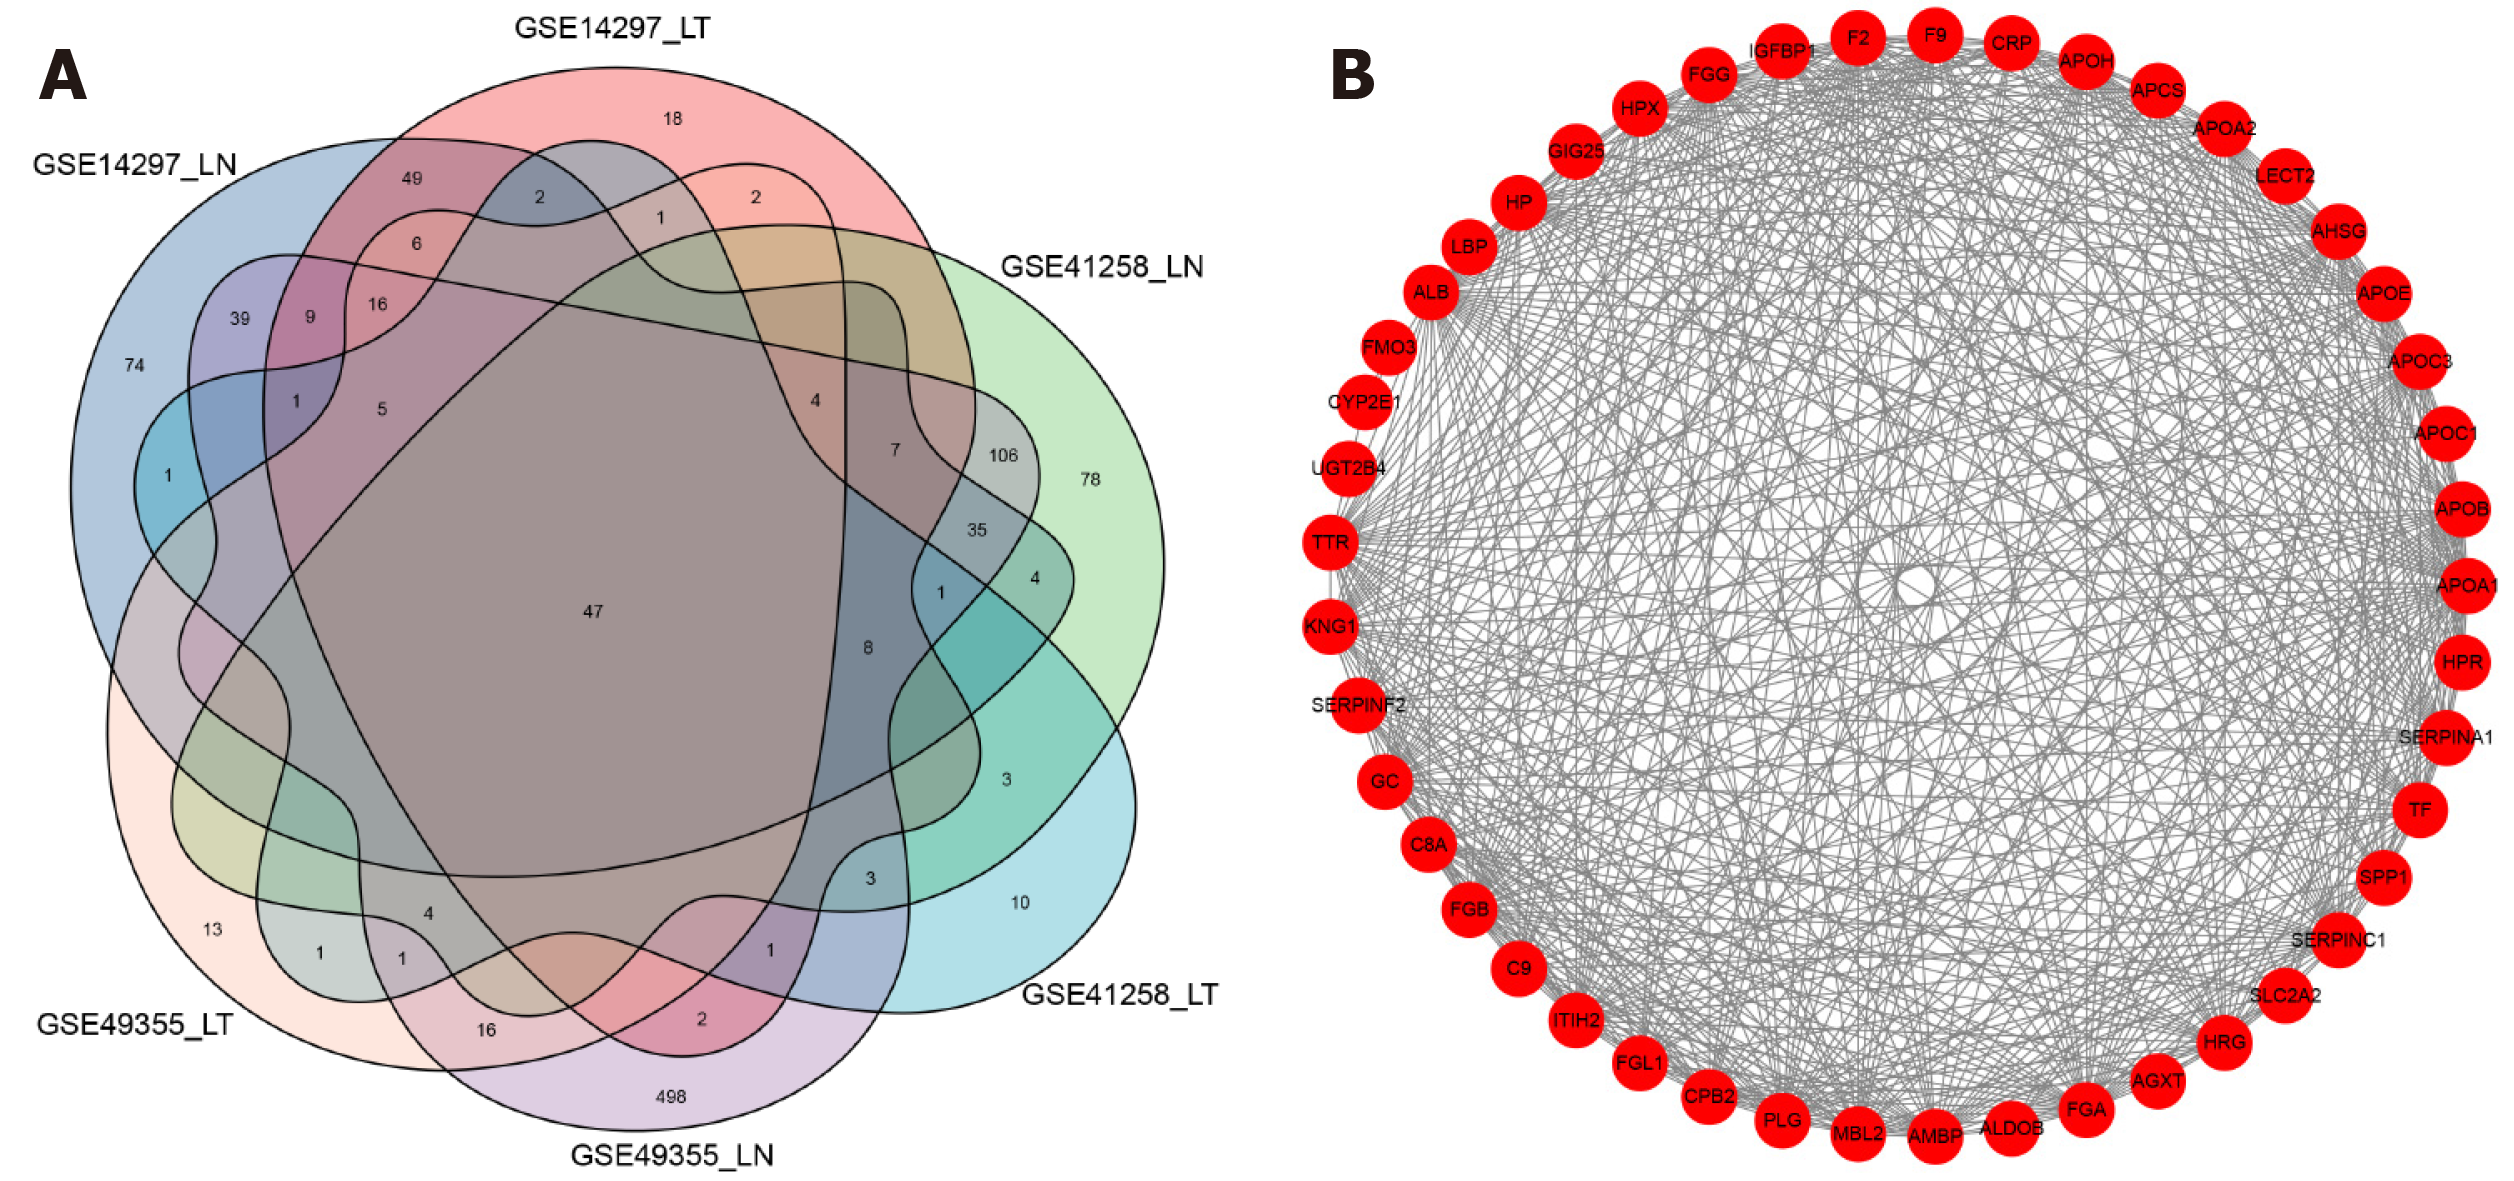
We combined the highly expressed genes from GSE14297, GSE41258, and GSE49355 and applied Venn diagrams to get significantly highly expressed genes among the six groups (Figure 3A). STRING and Cytoscape software were used to visualise these HDEGs, as shown in Figure 3B.
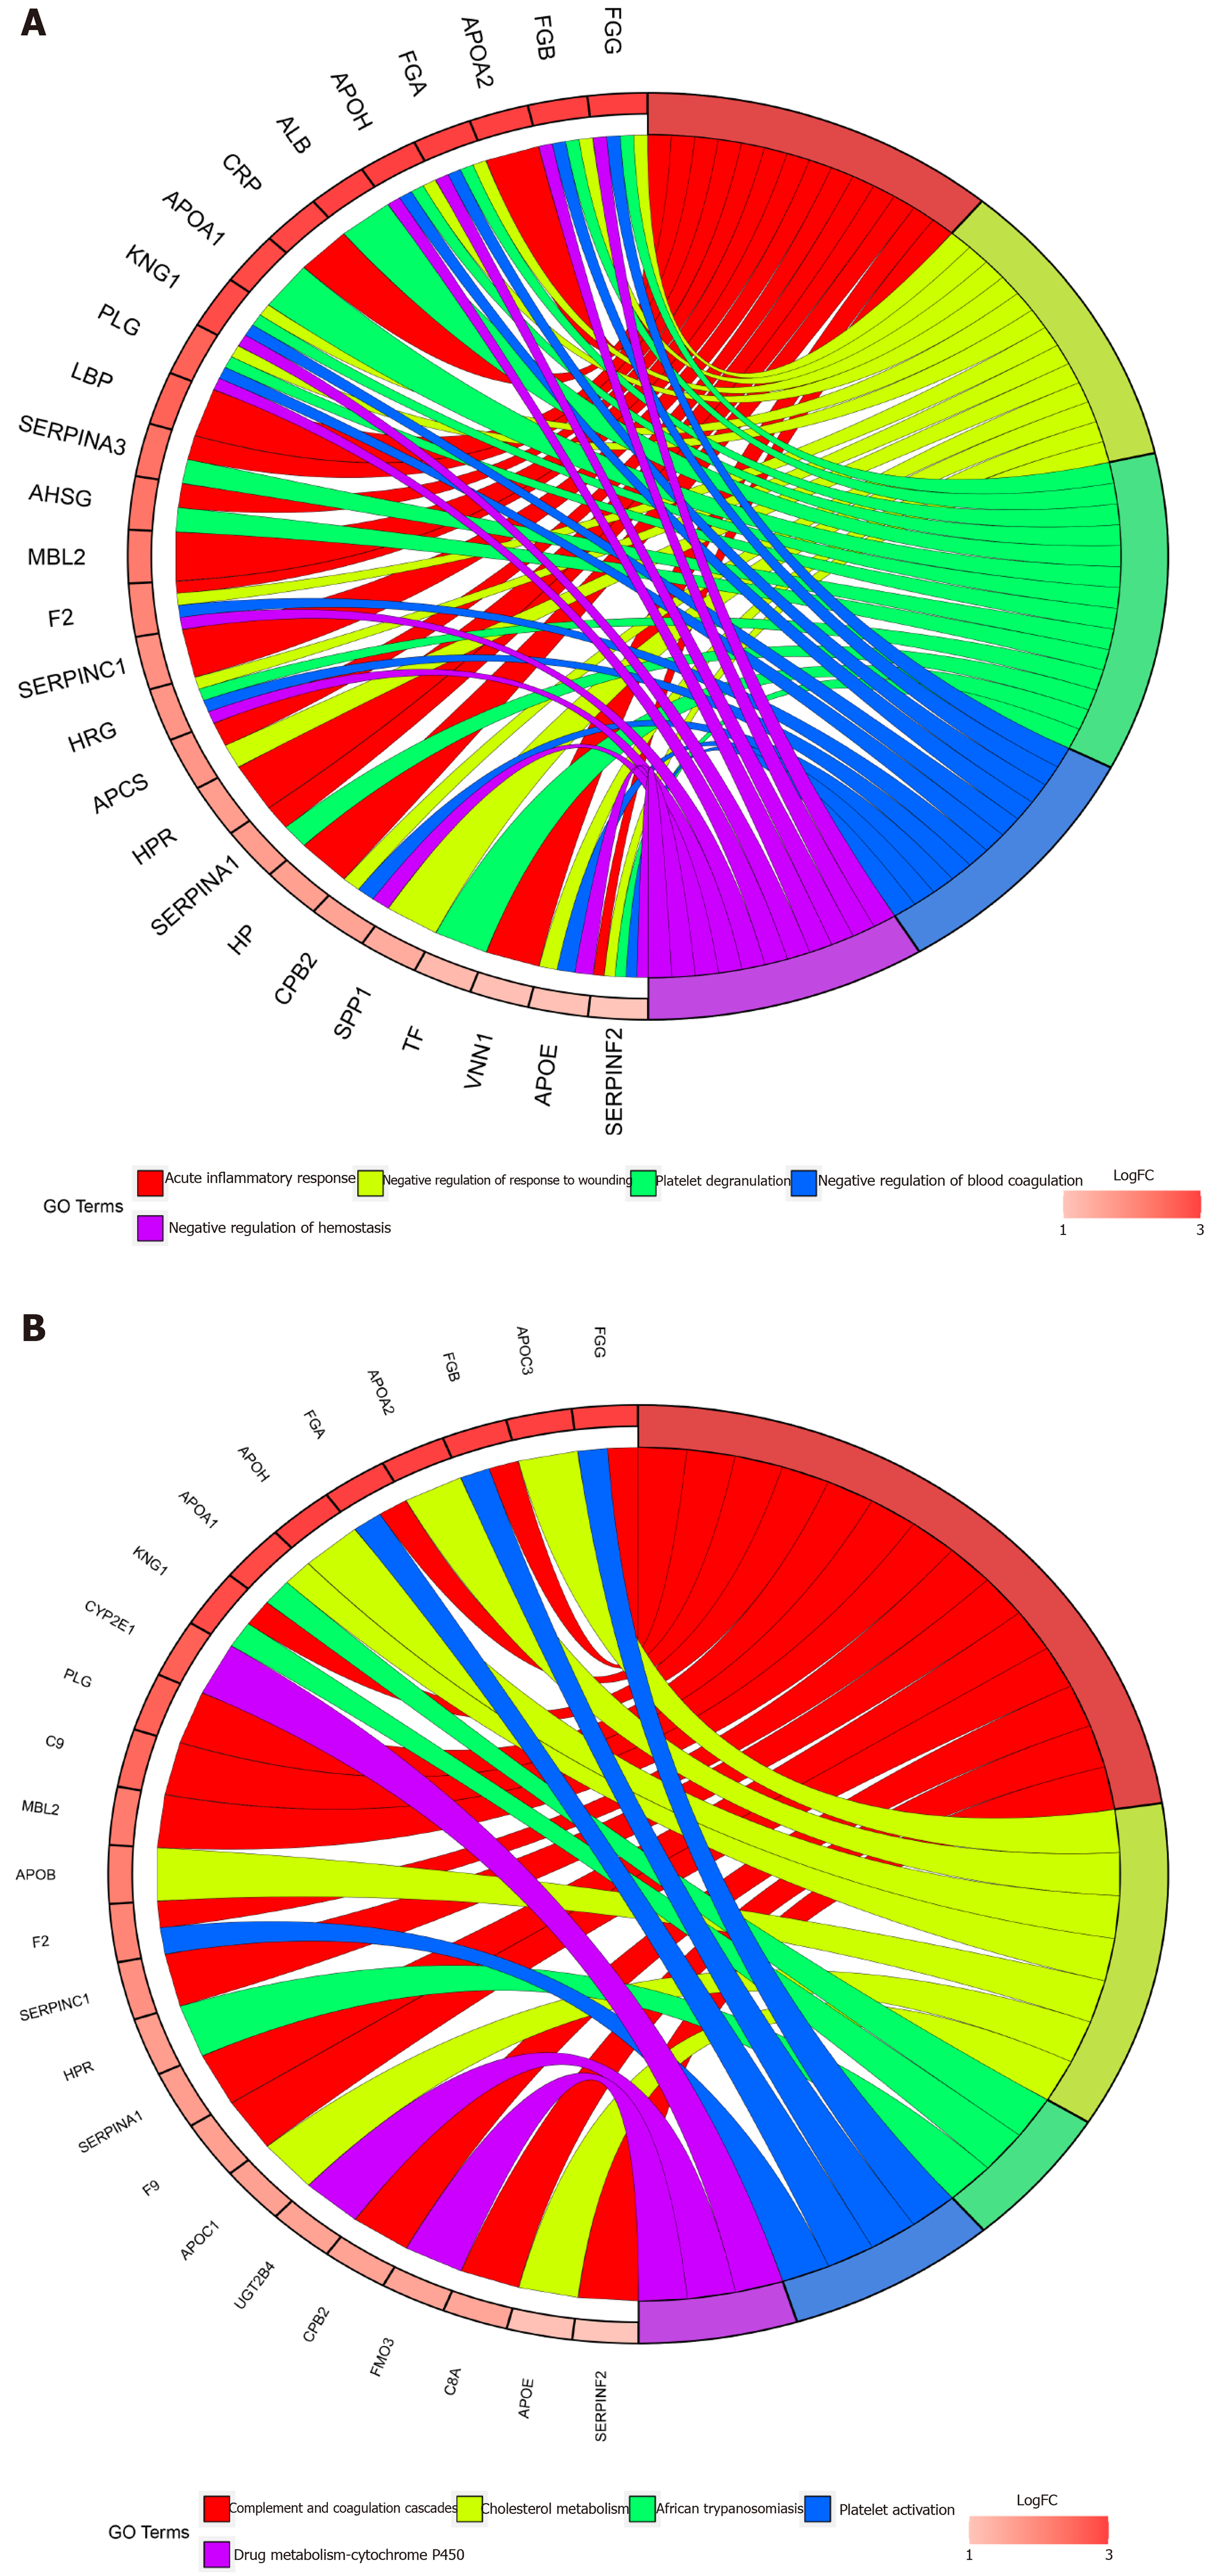
GO enrichment was performed following pFilter < 0.05 and adjPfilter < 1, and the top five terms were chosen: Acute inflammatory response (P = 7.42 × 10⁻²¹), negative regulation of response to wounding (P = 5.20 × 10⁻²⁰), platelet degranulation (P = 6.68 × 10⁻²⁰), negative regulation of blood coagulation (P = 2.26 × 10⁻¹⁹), and negative regulation of haemostasis (P = 7.54 × 10⁻¹⁷) (Figure 4A). The top five pathways in the KEGG analysis (satisfied pFilter < 0.05 and adjPfilter < 1) were: Complement and coagulation cascades (P = 7.89 × 10⁻²⁰), cholesterol metabolism (P = 1.07 × 10⁻⁹), African trypanosomiasis (P = 0.00048), platelet activation (P = 0.0017), and drug metabolism-cytochrome P450 (P = 0.0033) (Figure 4B).
As shown Figure 5, the APOC1 expression was strongly associated with the clinical features. APOC1 showed significantly different expression between N2 and N0 and between N2 and N1 (Figure 5C). There was also a significant difference in expression between T2 and T4 and between T2 and T3 (Figure 5B). No significance differences were found across different ages and sexes (Figure 5D and E). To confirm the different expression levels in cancer, we further examined 20 paired CRC and normal tissues by using quantitative PCR. As shown in Figure 5F, quantitative real-time PCR illustrated that APOC1 mRNA was strongly upregulated in CRC tissues compared to that in normal colorectal samples.
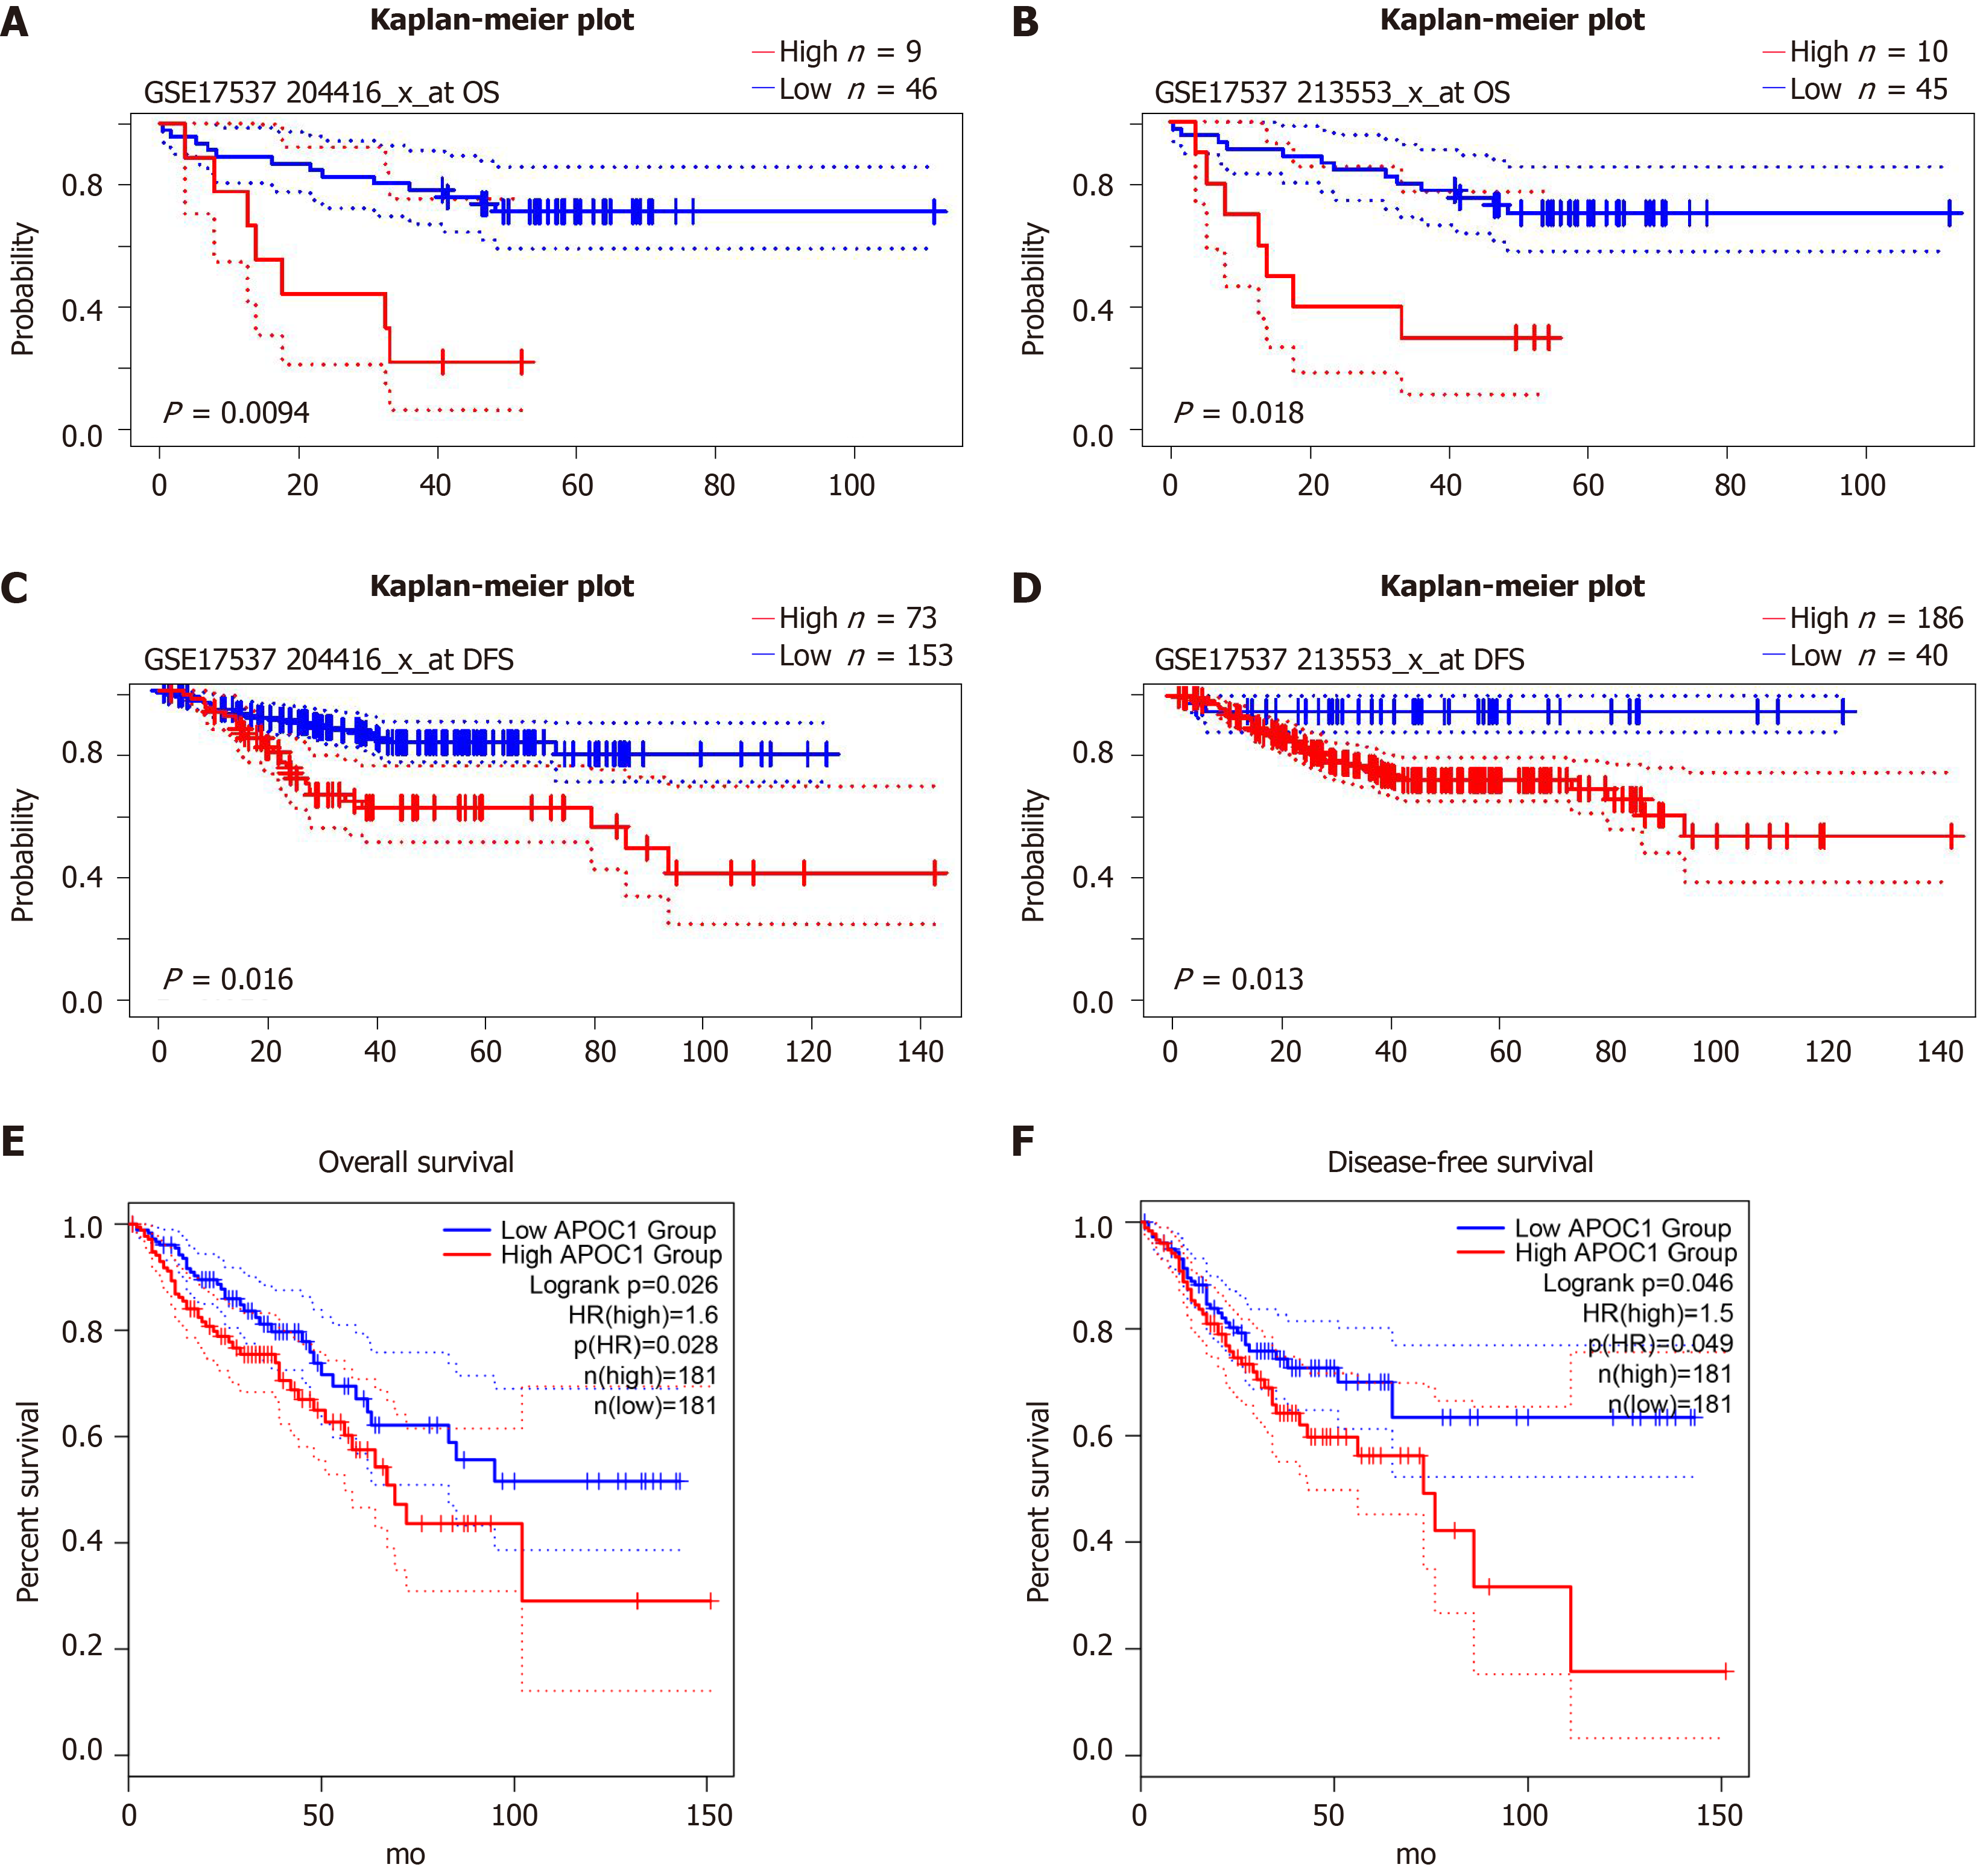
We explored the prognostic value in GSE17537 and GSE14333 using online tools: PrognoScan: P = 0.0094 and P = 0.018 for overall survival in GSE17537 (Figure 6A and B); P = 0.016 and P = 0.013 for disease-free survival in GSE14333 (Figure 6C and D). We also validated the prognostic value in GEPIA2: P = 0.026 for overall survival (P = 0.046) (Figure 6E and F).
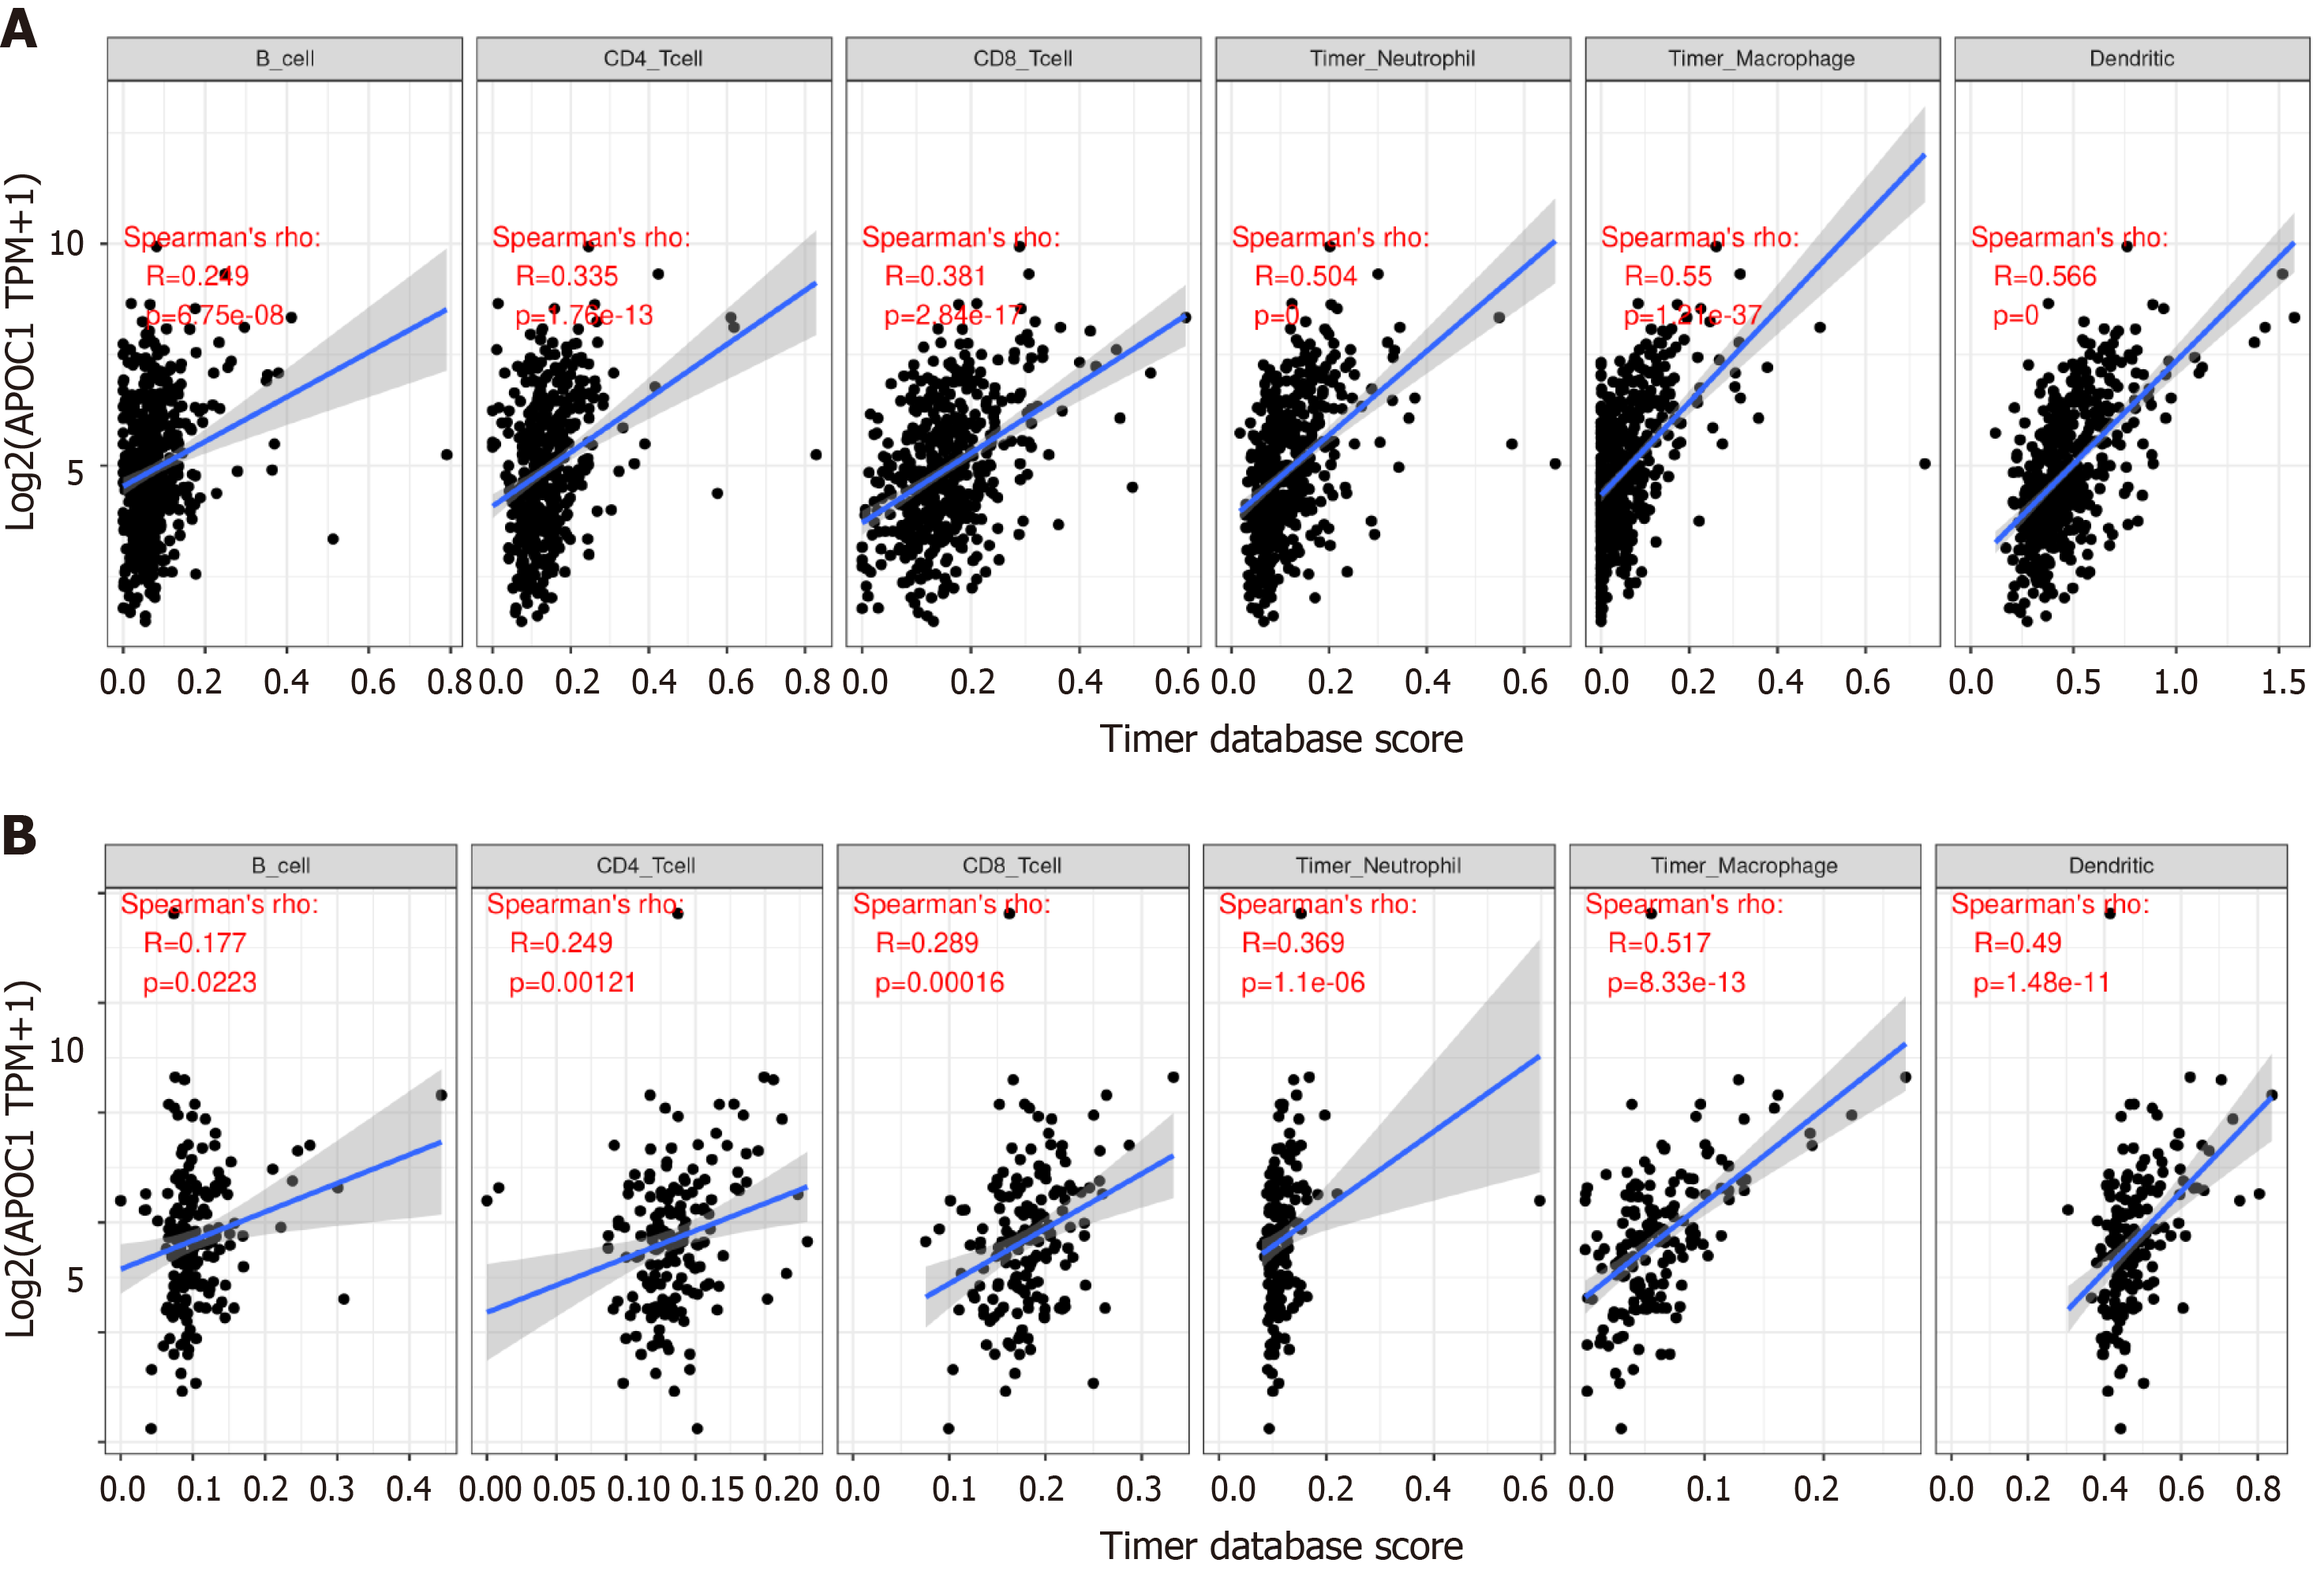
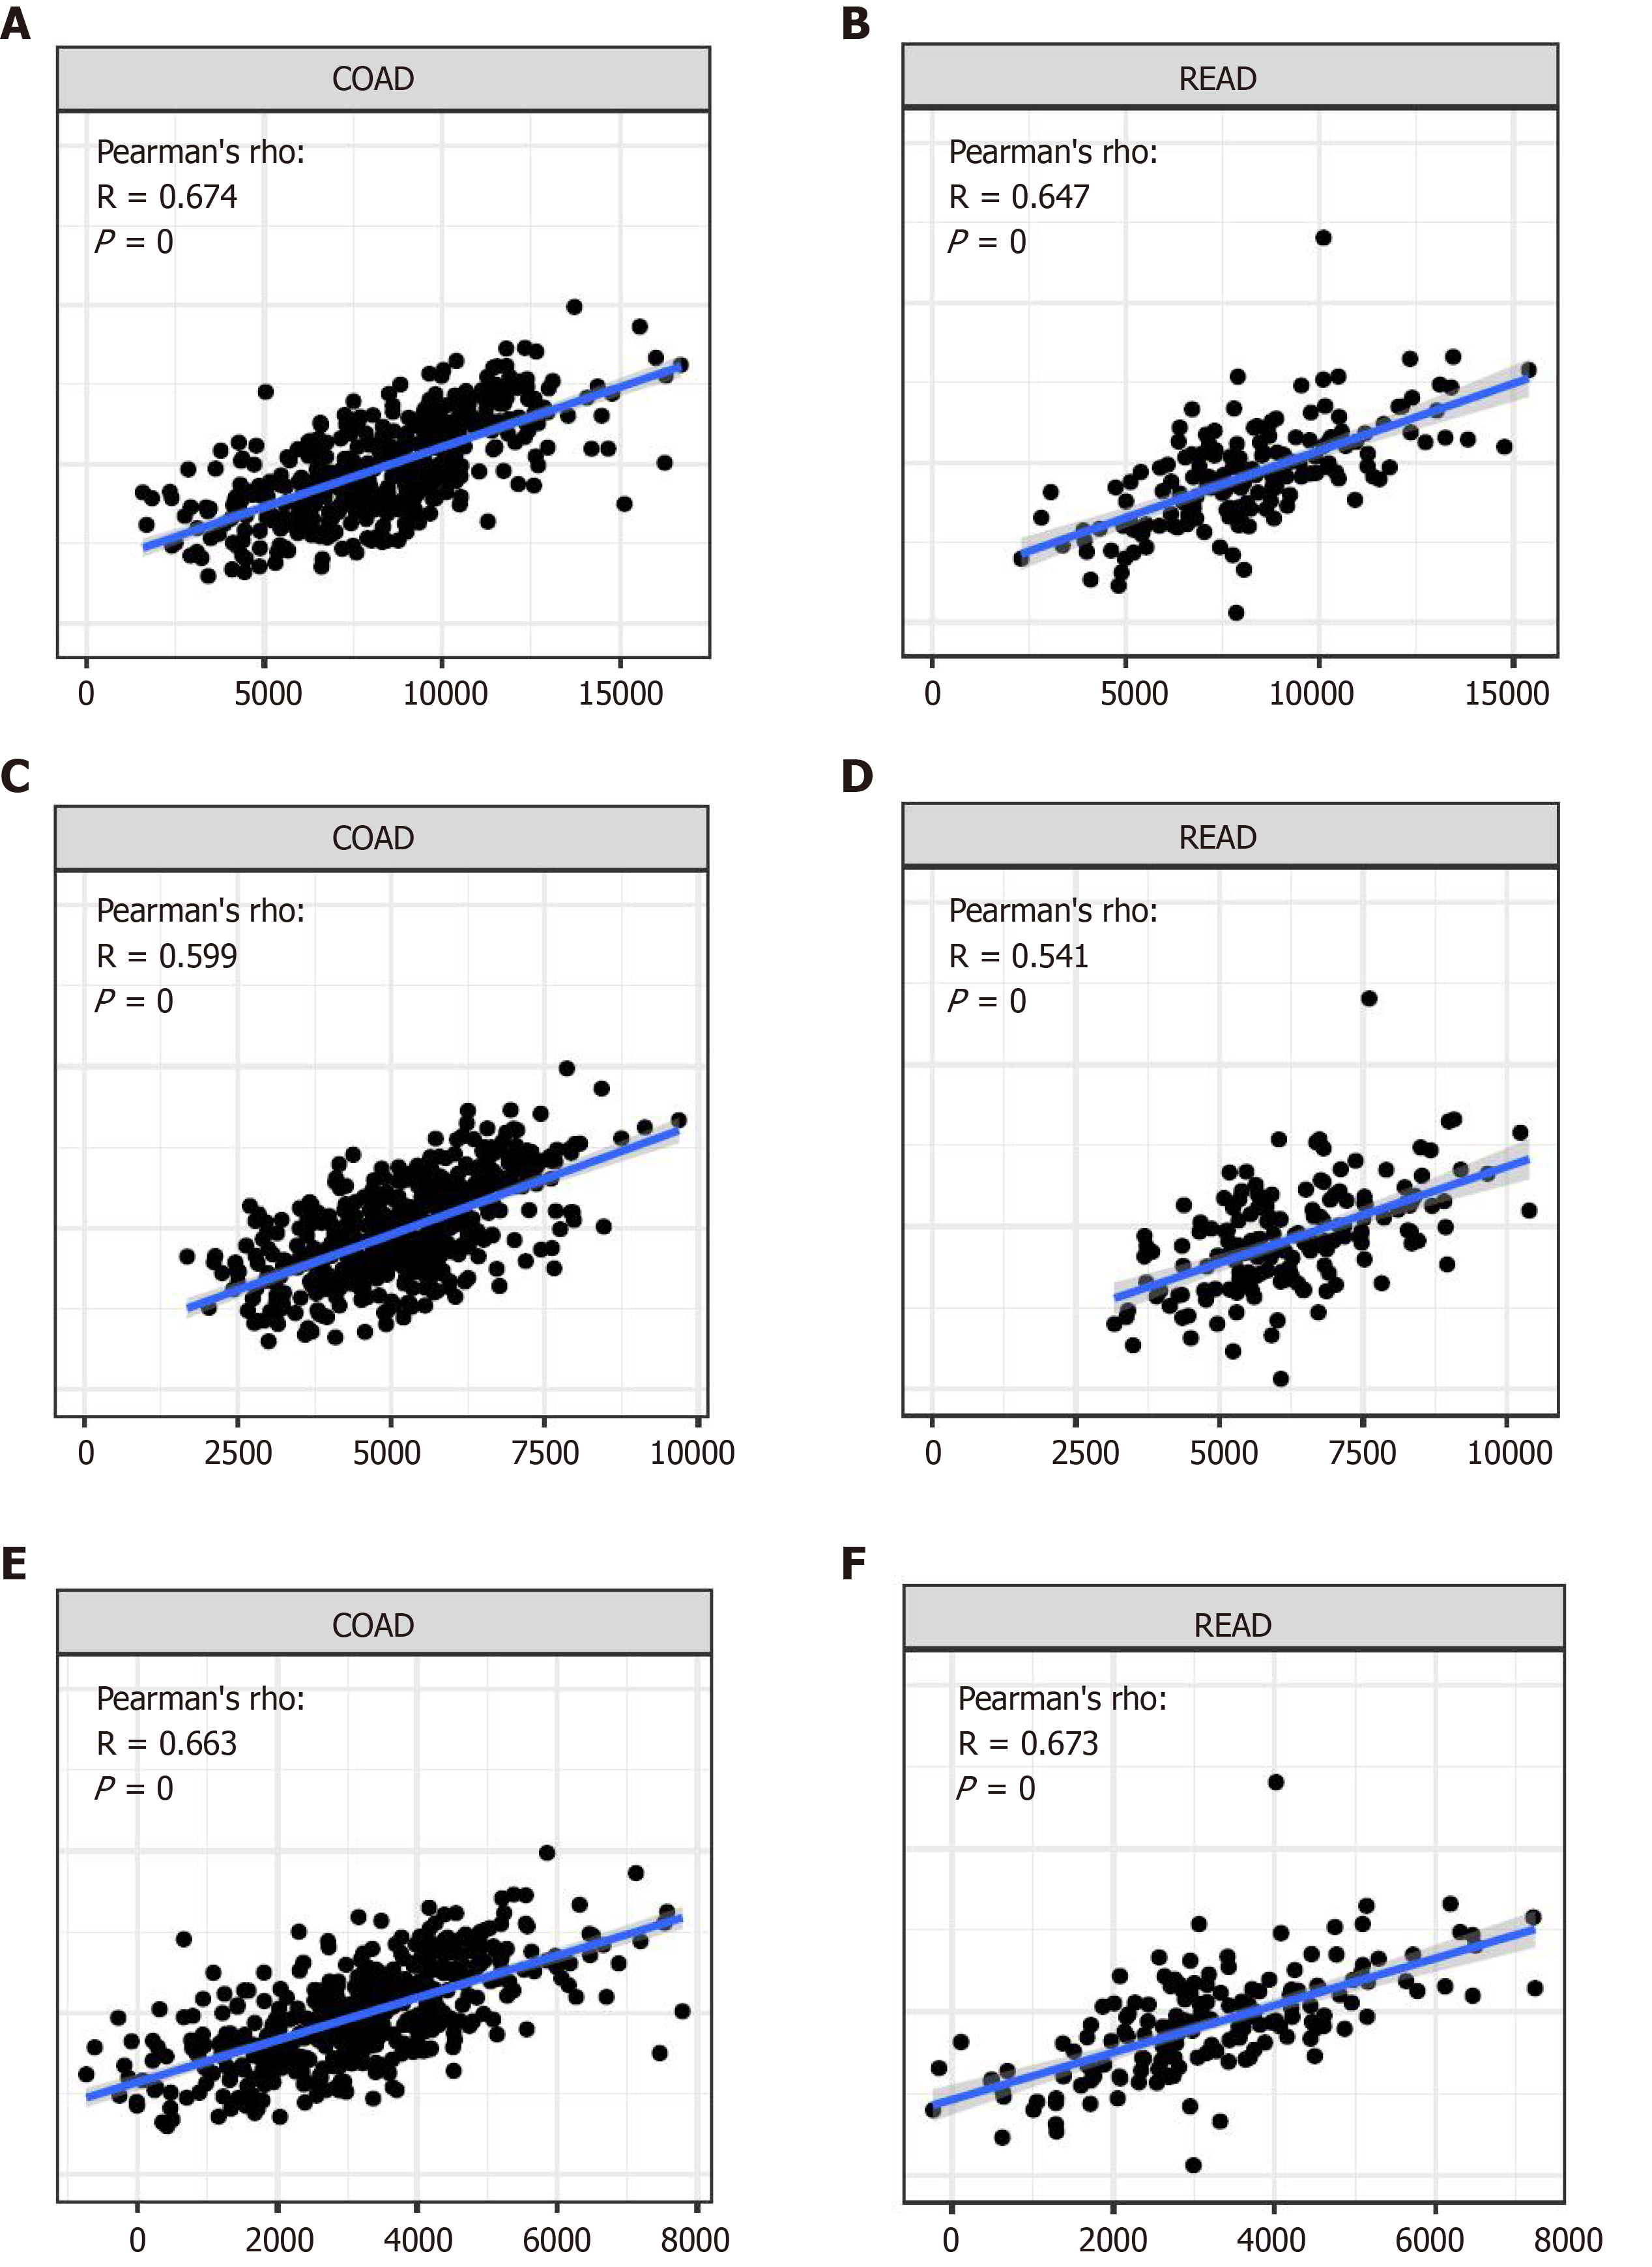
APOC1 has a close relationship with immune infiltration (Figure 7): In the colon: CD4+ T cells (P = 1.76 × 10⁻¹³), CD8+ T cells (P = 2.84 × 10⁻¹⁷), B cells (P = 6.75 × 10⁻⁸), neutrophils (P-0), macrophage cells (P = 1.21 × 10-37), and dendritic cells (P = 0); in the rectum: CD4+ T cells (P = 0.00121), CD8+ T cells (P = 0.00016), B cells (P = 0.0223), neutrophils (P = 1.1 × 10⁻⁶), macrophage cells (P = 8.33 × 10⁻¹³), and dendritic cells (P = 1.48 × 10⁻¹¹). We also utilized the R package ‘estimate’ to calculate different scores: Immune score, stromal score, and ESTIMATE score (Figure 8).
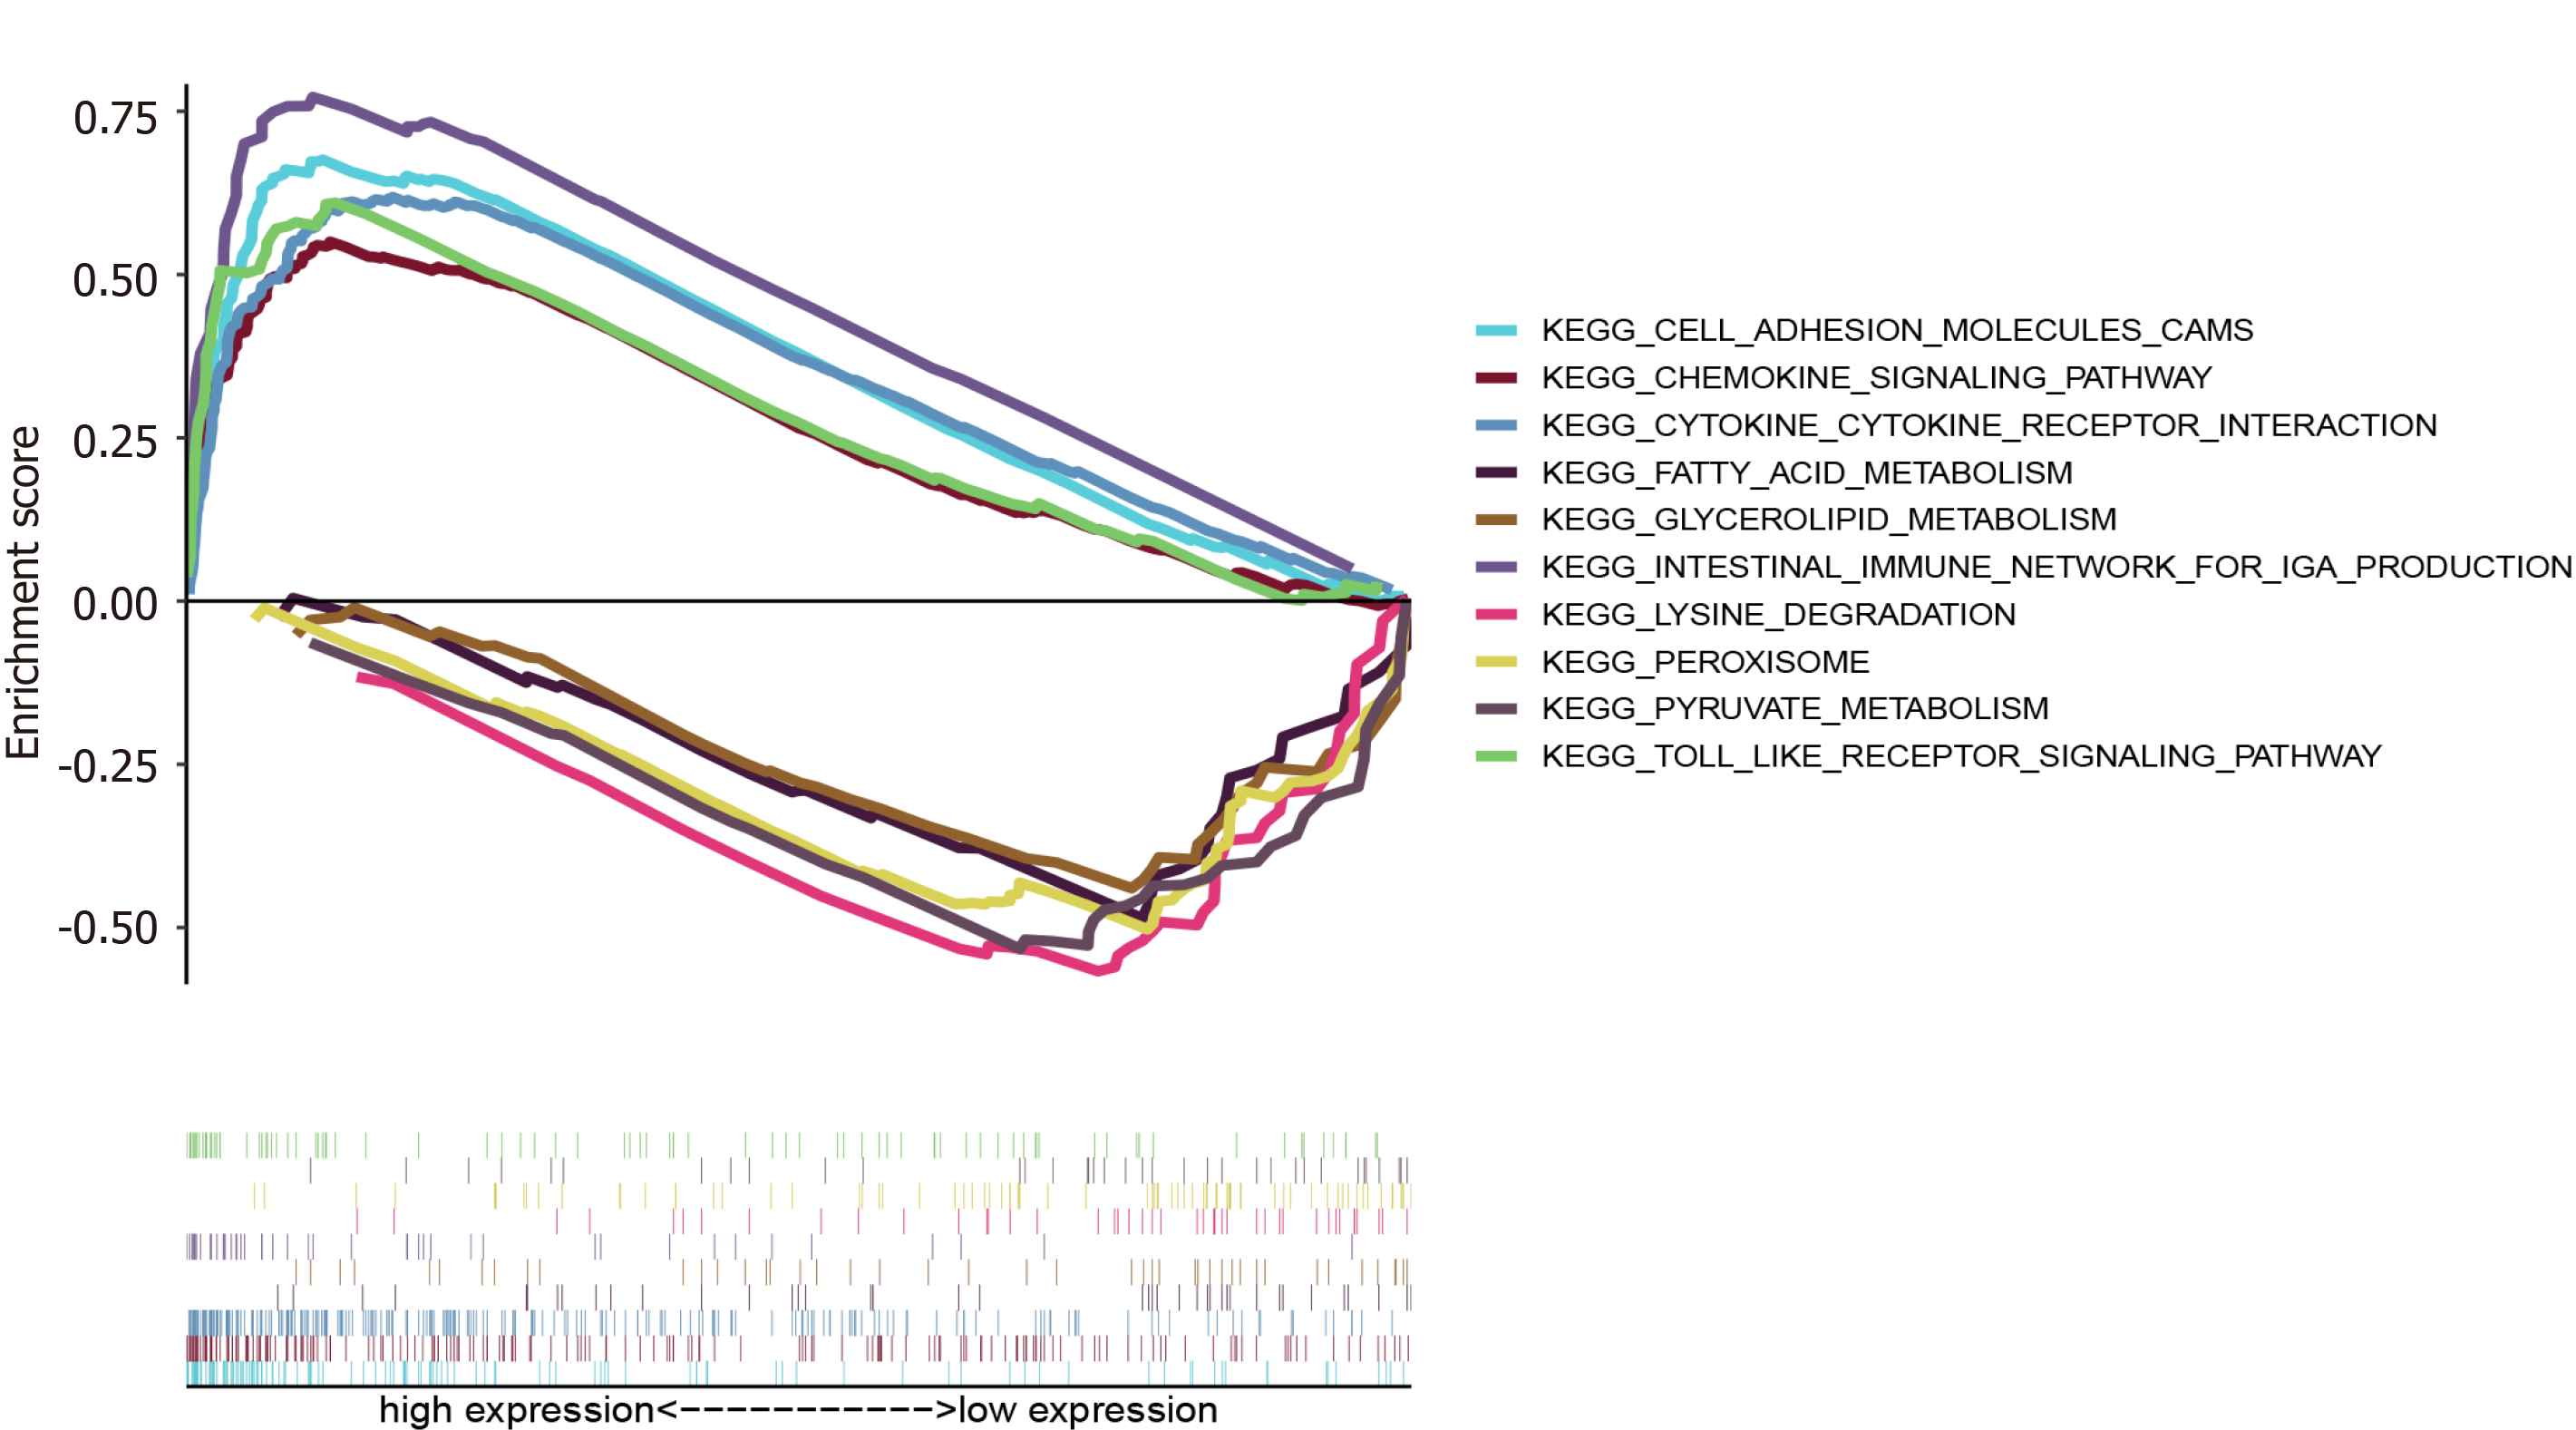
GSEA showed that APOC1 was enriched in ‘Toll-like receptor signalling pathway’, ‘Cytokine receptor interaction’, ‘Cell adhesion molecules CAMs’, ‘Chemokine signalling pathway’, and ‘Intestinal immune network for IGA production’ in the high expression group; and enriched in ‘Lysine degradation’, ‘Peroxisome’, ‘Pyruvate metabolism’, ‘Glycerolipid metabolism’, and ‘Fatty acid metabolism’ in the low expression group (Figure 9).
CRC is a common gastrointestinal tumour, and its metastasis is one of the main causes of death in patients with CRC. The liver is the most important target organ of metastasis and approximately 30%-50% of patients have LM at diagnosis or after surgery[4-8]. However, the vast majority of liver metastases cannot initially undergo radical resection and demonstrate a poorer prognosis than those with other types of metastases. Therefore, it is critical to identify markers to predict and diagnose colorectal liver metastases.
To the best of our knowledge, our study is the first to divide one GEO dataset into two groups: LM-normal and LM-tumour to explore the HDEGs in CRC. We integrated three datasets to identify HDEGs. GO and KEGG analyses were performed to research the functions in the three datasets. GO analysis indicated that the acute inflammatory response, negative regulation of response to wounding, platelet degranulation, negative regulation of blood coagulation, and negative regulation of haemostasis were closely related to the development and growth of cancer. For KEGG pathway analysis, complement and coagulation cascades were closely related to immune functions, platelet activation was associated with tumour metastasis, and cholesterol metabolism was associated with the pathogenesis of CRC.
We utilized online tools to research the prognostic value of HDEGs. According to the results, APOC1 was associated with the survival time of CRC patients. For further exploring, we analysed APOC1 differential expression between tumour and normal tissues, with regard to different ages, genders, and T and N stages. Significant differences were observed between tumour and normal tissues in addition to our clinical samples, which is consistent with the analysis results. This reveals that APOC1 levels increase from the initial development to LM of CRC.
For exploring the mechanisms of APOC1 in CRC, we utilized the TIMER online tool to assess immune infiltration, immune score, stromal score, estimate score, and GSEA for biological functions of APOC1. TIMER result revealed that APOC1 had a strong correlation with lymphocyte expression, which provides a new perspective to explore the mechanism of colorectal LM. With the development of tumour research, many studies have showed the important role of tumour microenvironment (TME) in tumorigenesis and therapy[29-33]. The TME might have an impact on the therapy and clinical outcome of patients with cancer. In our study, through the analysis of the tumours of the colon and rectum, the results indicate a close relationship between TME and APOC1 expression in CRC.
Several analyses indicate that stromal cells contributed to tumour angiogenesis and extracellular matrix remodelling[34-36]. Meanwhile, a few studies have focused on the influence of immune cells in TME on tumorigenesis and development. Several studies revealed that tumour-infiltrating immune cells might be a potential marker of therapeutic effects. In our results, we analysed the stromal score and immune score in the colon and rectum, respectively. APOC1 has a strong relationship with structural components and immune cells in CRC, which can reveal the relationship with immune cell scores.
The GSEA of APOC1 indicated that in the high expression group, APOC1 was enriched in ‘Cytokine receptor interaction’[37], ‘Cell adhesion molecules CAMs’[38], and ‘Chemokine signalling pathway’[39], suggesting that APOC1 can influence CRC development. ‘Intestinal immune network for IGA production’[40] indicates that APOC1 has a close relationship with the immune response. Moreover, in the low expression group, APOC1 was enriched in ‘Lysine degradation’, ‘Peroxisome’, ‘Pyruvate metabolism’, ‘Glycerolipid metabolism’, and ‘Fatty acid metabolism’, which indicate that APOC1 might have an impact on tumorigenesis and development of CRC in different metabolic pathways[41,42]. These findings might present a new perspective on the molecular mechanism of CRC. However, this study still has some limitations. Because our work mainly relies on the bioinformatic analysis of datasets, more basic research experiments should be performed to confirm these results.
In conclusion, by combining three GEO datasets, we identified and characterised some significantly HDEGs in the liver metastases of CRC. Among 48 DEGs, APOC1 is a biomarker that is associated with both the diagnosis and prognosis of liver metastases of CRC. Furthermore, analysis of the relationship with immune infiltration and TME, and gene set enrichment analysis demonstrated that APOC1 was strongly associated with CRC development.
Colorectal cancer (CRC) is one of the most malignant gastrointestinal cancers worldwide. The liver is the most important metastatic target organ, and liver metastasis is the leading cause of death in CRC patients.
There is still a lack of diagnostic or prognostic markers for liver metastasis (LM) of CRC. Therefore, it is very important to identify the diagnostic or prognostic markers for LM of CRC to improve the clinical outcomes.
This study aimed to explore the highly differentially expressed genes (HDEGs) and prognostic marker for LM of CRC.
Three NCBI Gene Expression Omnibus (GEO) datasets were utilized to identify a set of HDEGs. These significantly HDEGs of the three GEO datasets take the intersection genes and these intersection genes were screened through an online tool to explore their prognostic value. TIMER and R package were utilized to investigate potential immune functions of HDEGs and gene set enrichment analysis was performed to explore their possible impact on CRC.
APOC1 is one of 47 HDEGs in three GEO datasets for LM of CRC and showed significantly different expression between different N and T stages in the TCGA database. APOC1 mRNA was strongly upregulated in cancer tissues compared with normal tissues, as confirmed by quantitative real-time polymerase chain reaction. The prognostic value of APOC1 for overall survival and disease-free survival in CRC was revealed with PrognoScan and GEPIA2. APOC1 also has a close relationship with immune infiltration showed with TIMER.
APOC1 is a potential biomarker that is associated with both the diagnosis and prognosis of liver metastases of colorectal cancer.
Future work and basic research should be performed to confirm these findings of APOC1 and to verify the related potential regulatory mechanisms in vitro and in vivo.
Manuscript source: Unsolicited manuscript
Specialty type: Medicine, research and experimental
Country/Territory of origin: China
Peer-review report’s scientific quality classification
Grade A (Excellent): A
Grade B (Very good): 0
Grade C (Good): C
Grade D (Fair): D
Grade E (Poor): 0
P-Reviewer: Chiu CC, Goktepe HM, Zavras N S-Editor: Gao CC L-Editor: Wang TQ P-Editor: Xing YX
| 1. | Torre LA, Bray F, Siegel RL, Ferlay J, Lortet-Tieulent J, Jemal A. Global cancer statistics, 2012. CA Cancer J Clin. 2015;65:87-108. [RCA] [PubMed] [DOI] [Full Text] [Cited by in Crossref: 18694] [Cited by in RCA: 21368] [Article Influence: 2136.8] [Reference Citation Analysis (3)] |
| 2. | Foster JH. Treatment of metastatic disease of the liver: a skeptic's view. Semin Liver Dis. 1984;4:170-179. [RCA] [PubMed] [DOI] [Full Text] [Cited by in Crossref: 46] [Cited by in RCA: 45] [Article Influence: 1.1] [Reference Citation Analysis (0)] |
| 3. | Fong Y, Cohen AM, Fortner JG, Enker WE, Turnbull AD, Coit DG, Marrero AM, Prasad M, Blumgart LH, Brennan MF. Liver resection for colorectal metastases. J Clin Oncol. 1997;15:938-946. [RCA] [PubMed] [DOI] [Full Text] [Cited by in Crossref: 893] [Cited by in RCA: 825] [Article Influence: 29.5] [Reference Citation Analysis (0)] |
| 4. | Vibert E, Canedo L, Adam R. Strategies to treat primary unresectable colorectal liver metastases. Semin Oncol. 2005;32:33-39. [RCA] [PubMed] [DOI] [Full Text] [Cited by in Crossref: 25] [Cited by in RCA: 26] [Article Influence: 1.4] [Reference Citation Analysis (0)] |
| 5. | Kemeny N. Management of liver metastases from colorectal cancer. Oncology (Williston Park). 2006;20:1161-1176, 1179; discussion 1179. [PubMed] |
| 6. | Lau WY, Lai EC. Hepatic resection for colorectal liver metastases. Singapore Med J. 2007;48:635-639. [PubMed] |
| 7. | Taniai N, Akimaru K, Yoshida H, Tajiri T. Surgical treatment for better prognosis of patients with liver metastases from colorectal cancer. Hepatogastroenterology. 2007;54:1805-1809. [PubMed] |
| 8. | Arru M, Aldrighetti L, Castoldi R, Di Palo S, Orsenigo E, Stella M, Pulitanò C, Gavazzi F, Ferla G, Di Carlo V, Staudacher C. Analysis of prognostic factors influencing long-term survival after hepatic resection for metastatic colorectal cancer. World J Surg. 2008;32:93-103. [RCA] [PubMed] [DOI] [Full Text] [Cited by in Crossref: 83] [Cited by in RCA: 89] [Article Influence: 4.9] [Reference Citation Analysis (0)] |
| 9. | Arnold M, Sierra MS, Laversanne M, Soerjomataram I, Jemal A, Bray F. Global patterns and trends in colorectal cancer incidence and mortality. Gut. 2017;66:683-691. [RCA] [PubMed] [DOI] [Full Text] [Cited by in Crossref: 3058] [Cited by in RCA: 3306] [Article Influence: 413.3] [Reference Citation Analysis (3)] |
| 10. | Adler A, Geiger S, Keil A, Bias H, Schatz P, deVos T, Dhein J, Zimmermann M, Tauber R, Wiedenmann B. Improving compliance to colorectal cancer screening using blood and stool based tests in patients refusing screening colonoscopy in Germany. BMC Gastroenterol. 2014;14:183. [RCA] [PubMed] [DOI] [Full Text] [Full Text (PDF)] [Cited by in Crossref: 111] [Cited by in RCA: 164] [Article Influence: 14.9] [Reference Citation Analysis (0)] |
| 11. | Liu Q, Deng J, Wei X, Yuan W, Ma J. Integrated analysis of competing endogenous RNA networks revealing five prognostic biomarkers associated with colorectal cancer. J Cell Biochem. 2019;. [RCA] [PubMed] [DOI] [Full Text] [Cited by in Crossref: 8] [Cited by in RCA: 8] [Article Influence: 1.3] [Reference Citation Analysis (0)] |
| 12. | Barrett T, Wilhite SE, Ledoux P, Evangelista C, Kim IF, Tomashevsky M, Marshall KA, Phillippy KH, Sherman PM, Holko M, Yefanov A, Lee H, Zhang N, Robertson CL, Serova N, Davis S, Soboleva A. NCBI GEO: archive for functional genomics data sets--update. Nucleic Acids Res. 2013;41:D991-D995. [RCA] [PubMed] [DOI] [Full Text] [Full Text (PDF)] [Cited by in Crossref: 4527] [Cited by in RCA: 6785] [Article Influence: 521.9] [Reference Citation Analysis (0)] |
| 13. | The Gene Ontology Consortium. Expansion of the Gene Ontology knowledgebase and resources. Nucleic Acids Res. 2017;45:D331-D338. [RCA] [PubMed] [DOI] [Full Text] [Full Text (PDF)] [Cited by in Crossref: 1342] [Cited by in RCA: 1381] [Article Influence: 153.4] [Reference Citation Analysis (0)] |
| 14. | Wixon J, Kell D. The Kyoto encyclopedia of genes and genomes--KEGG. Yeast. 2000;17:48-55. [RCA] [PubMed] [DOI] [Full Text] [Full Text (PDF)] [Cited by in RCA: 1] [Reference Citation Analysis (0)] |
| 15. | Tang Z, Kang B, Li C, Chen T, Zhang Z. GEPIA2: an enhanced web server for large-scale expression profiling and interactive analysis. Nucleic Acids Res. 2019;47:W556-W560. [RCA] [PubMed] [DOI] [Full Text] [Full Text (PDF)] [Cited by in Crossref: 1991] [Cited by in RCA: 3074] [Article Influence: 512.3] [Reference Citation Analysis (0)] |
| 16. | Li T, Fan J, Wang B, Traugh N, Chen Q, Liu JS, Li B, Liu XS. TIMER: A Web Server for Comprehensive Analysis of Tumor-Infiltrating Immune Cells. Cancer Res. 2017;77:e108-e110. [RCA] [PubMed] [DOI] [Full Text] [Cited by in Crossref: 2728] [Cited by in RCA: 4091] [Article Influence: 511.4] [Reference Citation Analysis (0)] |
| 17. | Powers RK, Goodspeed A, Pielke-Lombardo H, Tan AC, Costello JC. GSEA-InContext: identifying novel and common patterns in expression experiments. Bioinformatics. 2018;34:i555-i564. [RCA] [PubMed] [DOI] [Full Text] [Full Text (PDF)] [Cited by in Crossref: 68] [Cited by in RCA: 169] [Article Influence: 28.2] [Reference Citation Analysis (0)] |
| 18. | Stange DE, Engel F, Longerich T, Koo BK, Koch M, Delhomme N, Aigner M, Toedt G, Schirmacher P, Lichter P, Weitz J, Radlwimmer B. Expression of an ASCL2 related stem cell signature and IGF2 in colorectal cancer liver metastases with 11p15.5 gain. Gut. 2010;59:1236-1244. [RCA] [PubMed] [DOI] [Full Text] [Cited by in Crossref: 70] [Cited by in RCA: 77] [Article Influence: 5.1] [Reference Citation Analysis (0)] |
| 19. | Sheffer M, Bacolod MD, Zuk O, Giardina SF, Pincas H, Barany F, Paty PB, Gerald WL, Notterman DA, Domany E. Association of survival and disease progression with chromosomal instability: a genomic exploration of colorectal cancer. Proc Natl Acad Sci U S A. 2009;106:7131-7136. [RCA] [PubMed] [DOI] [Full Text] [Cited by in Crossref: 250] [Cited by in RCA: 298] [Article Influence: 18.6] [Reference Citation Analysis (0)] |
| 20. | Del Rio M, Molina F, Bascoul-Mollevi C, Copois V, Bibeau F, Chalbos P, Bareil C, Kramar A, Salvetat N, Fraslon C, Conseiller E, Granci V, Leblanc B, Pau B, Martineau P, Ychou M. Gene expression signature in advanced colorectal cancer patients select drugs and response for the use of leucovorin, fluorouracil, and irinotecan. J Clin Oncol. 2007;25:773-780. [RCA] [PubMed] [DOI] [Full Text] [Cited by in Crossref: 142] [Cited by in RCA: 159] [Article Influence: 8.8] [Reference Citation Analysis (0)] |
| 21. | Del Rio M, Mollevi C, Vezzio-Vie N, Bibeau F, Ychou M, Martineau P. Specific extracellular matrix remodeling signature of colon hepatic metastases. PLoS One. 2013;8:e74599. [RCA] [PubMed] [DOI] [Full Text] [Full Text (PDF)] [Cited by in Crossref: 32] [Cited by in RCA: 45] [Article Influence: 3.8] [Reference Citation Analysis (0)] |
| 22. | von Mering C, Huynen M, Jaeggi D, Schmidt S, Bork P, Snel B. STRING: a database of predicted functional associations between proteins. Nucleic Acids Res. 2003;31:258-261. [RCA] [PubMed] [DOI] [Full Text] [Cited by in Crossref: 1331] [Cited by in RCA: 1849] [Article Influence: 84.0] [Reference Citation Analysis (0)] |
| 23. | Shannon P, Markiel A, Ozier O, Baliga NS, Wang JT, Ramage D, Amin N, Schwikowski B, Ideker T. Cytoscape: a software environment for integrated models of biomolecular interaction networks. Genome Res. 2003;13:2498-2504. [RCA] [PubMed] [DOI] [Full Text] [Cited by in Crossref: 24663] [Cited by in RCA: 33572] [Article Influence: 1598.7] [Reference Citation Analysis (0)] |
| 24. | Song W, Fu T. Circular RNA-Associated Competing Endogenous RNA Network and Prognostic Nomogram for Patients With Colorectal Cancer. Front Oncol. 2019;9:1181. [RCA] [PubMed] [DOI] [Full Text] [Full Text (PDF)] [Cited by in Crossref: 42] [Cited by in RCA: 41] [Article Influence: 6.8] [Reference Citation Analysis (0)] |
| 25. | Smith JJ, Deane NG, Wu F, Merchant NB, Zhang B, Jiang A, Lu P, Johnson JC, Schmidt C, Bailey CE, Eschrich S, Kis C, Levy S, Washington MK, Heslin MJ, Coffey RJ, Yeatman TJ, Shyr Y, Beauchamp RD. Experimentally derived metastasis gene expression profile predicts recurrence and death in patients with colon cancer. Gastroenterology. 2010;138:958-968. [RCA] [PubMed] [DOI] [Full Text] [Cited by in Crossref: 465] [Cited by in RCA: 557] [Article Influence: 37.1] [Reference Citation Analysis (0)] |
| 26. | Freeman TJ, Smith JJ, Chen X, Washington MK, Roland JT, Means AL, Eschrich SA, Yeatman TJ, Deane NG, Beauchamp RD. Smad4-mediated signaling inhibits intestinal neoplasia by inhibiting expression of β-catenin. Gastroenterology 2012; 142: 562-571. e2. [RCA] [PubMed] [DOI] [Full Text] [Cited by in Crossref: 134] [Cited by in RCA: 155] [Article Influence: 11.9] [Reference Citation Analysis (0)] |
| 27. | Jorissen RN, Gibbs P, Christie M, Prakash S, Lipton L, Desai J, Kerr D, Aaltonen LA, Arango D, Kruhøffer M, Orntoft TF, Andersen CL, Gruidl M, Kamath VP, Eschrich S, Yeatman TJ, Sieber OM. Metastasis-Associated Gene Expression Changes Predict Poor Outcomes in Patients with Dukes Stage B and C Colorectal Cancer. Clin Cancer Res. 2009;15:7642-7651. [RCA] [PubMed] [DOI] [Full Text] [Cited by in Crossref: 321] [Cited by in RCA: 346] [Article Influence: 21.6] [Reference Citation Analysis (0)] |
| 28. | Ru B, Wong CN, Tong Y, Zhong JY, Zhong SSW, Wu WC, Chu KC, Wong CY, Lau CY, Chen I, Chan NW, Zhang J. TISIDB: an integrated repository portal for tumor-immune system interactions. Bioinformatics. 2019;35:4200-4202. [RCA] [PubMed] [DOI] [Full Text] [Cited by in Crossref: 561] [Cited by in RCA: 1436] [Article Influence: 287.2] [Reference Citation Analysis (0)] |
| 29. | Barker HE, Paget JT, Khan AA, Harrington KJ. The tumour microenvironment after radiotherapy: mechanisms of resistance and recurrence. Nat Rev Cancer. 2015;15:409-425. [RCA] [PubMed] [DOI] [Full Text] [Cited by in Crossref: 1293] [Cited by in RCA: 1526] [Article Influence: 152.6] [Reference Citation Analysis (0)] |
| 30. | Turley SJ, Cremasco V, Astarita JL. Immunological hallmarks of stromal cells in the tumour microenvironment. Nat Rev Immunol. 2015;15:669-682. [RCA] [PubMed] [DOI] [Full Text] [Cited by in Crossref: 575] [Cited by in RCA: 808] [Article Influence: 80.8] [Reference Citation Analysis (0)] |
| 31. | Smyth MJ, Ngiow SF, Ribas A, Teng MW. Combination cancer immunotherapies tailored to the tumour microenvironment. Nat Rev Clin Oncol. 2016;13:143-158. [RCA] [PubMed] [DOI] [Full Text] [Cited by in Crossref: 571] [Cited by in RCA: 707] [Article Influence: 70.7] [Reference Citation Analysis (0)] |
| 32. | Komohara Y, Takeya M. CAFs and TAMs: maestros of the tumour microenvironment. J Pathol. 2017;241:313-315. [RCA] [PubMed] [DOI] [Full Text] [Cited by in Crossref: 163] [Cited by in RCA: 152] [Article Influence: 19.0] [Reference Citation Analysis (0)] |
| 33. | Wu T, Dai Y. Tumor microenvironment and therapeutic response. Cancer Lett. 2017;387:61-68. [RCA] [PubMed] [DOI] [Full Text] [Cited by in Crossref: 663] [Cited by in RCA: 1258] [Article Influence: 139.8] [Reference Citation Analysis (0)] |
| 34. | De Palma M, Biziato D, Petrova TV. Microenvironmental regulation of tumour angiogenesis. Nat Rev Cancer. 2017;17:457-474. [RCA] [PubMed] [DOI] [Full Text] [Cited by in Crossref: 994] [Cited by in RCA: 1305] [Article Influence: 163.1] [Reference Citation Analysis (0)] |
| 35. | Koch MK, Jaeschke A, Murekatete B, Ravichandran A, Tsurkan M, Werner C, Soon P, Hutmacher DW, Haupt LM, Bray LJ. Stromal fibroblasts regulate microvascular-like network architecture in a bioengineered breast tumour angiogenesis model. Acta Biomater. 2020;114:256-269. [RCA] [PubMed] [DOI] [Full Text] [Cited by in Crossref: 9] [Cited by in RCA: 17] [Article Influence: 3.4] [Reference Citation Analysis (0)] |
| 36. | Bussard KM, Mutkus L, Stumpf K, Gomez-Manzano C, Marini FC. Tumor-associated stromal cells as key contributors to the tumor microenvironment. Breast Cancer Res. 2016;18:84. [RCA] [PubMed] [DOI] [Full Text] [Full Text (PDF)] [Cited by in Crossref: 395] [Cited by in RCA: 571] [Article Influence: 63.4] [Reference Citation Analysis (0)] |
| 37. | Spangler JB, Moraga I, Mendoza JL, Garcia KC. Insights into cytokine-receptor interactions from cytokine engineering. Annu Rev Immunol. 2015;33:139-167. [RCA] [PubMed] [DOI] [Full Text] [Cited by in Crossref: 144] [Cited by in RCA: 208] [Article Influence: 18.9] [Reference Citation Analysis (0)] |
| 38. | Beauchemin N, Arabzadeh A. Carcinoembryonic antigen-related cell adhesion molecules (CEACAMs) in cancer progression and metastasis. Cancer Metastasis Rev. 2013;32:643-671. [RCA] [PubMed] [DOI] [Full Text] [Cited by in Crossref: 260] [Cited by in RCA: 371] [Article Influence: 30.9] [Reference Citation Analysis (0)] |
| 39. | Taniguchi K, Karin M. NF-κB, inflammation, immunity and cancer: coming of age. Nat Rev Immunol. 2018;18:309-324. [RCA] [PubMed] [DOI] [Full Text] [Cited by in Crossref: 1132] [Cited by in RCA: 1923] [Article Influence: 274.7] [Reference Citation Analysis (0)] |
| 40. | Kurashima Y, Kiyono H. Mucosal Ecological Network of Epithelium and Immune Cells for Gut Homeostasis and Tissue Healing. Annu Rev Immunol. 2017;35:119-147. [RCA] [PubMed] [DOI] [Full Text] [Cited by in Crossref: 150] [Cited by in RCA: 221] [Article Influence: 27.6] [Reference Citation Analysis (0)] |
| 41. | Biswas SK. Metabolic Reprogramming of Immune Cells in Cancer Progression. Immunity. 2015;43:435-449. [RCA] [PubMed] [DOI] [Full Text] [Cited by in Crossref: 330] [Cited by in RCA: 512] [Article Influence: 56.9] [Reference Citation Analysis (0)] |
| 42. | Boroughs LK, DeBerardinis RJ. Metabolic pathways promoting cancer cell survival and growth. Nat Cell Biol. 2015;17:351-359. [RCA] [PubMed] [DOI] [Full Text] [Cited by in Crossref: 819] [Cited by in RCA: 1104] [Article Influence: 110.4] [Reference Citation Analysis (0)] |


