Copyright
©The Author(s) 2021.
World J Clin Cases. Jun 6, 2021; 9(16): 3880-3894
Published online Jun 6, 2021. doi: 10.12998/wjcc.v9.i16.3880
Published online Jun 6, 2021. doi: 10.12998/wjcc.v9.i16.3880
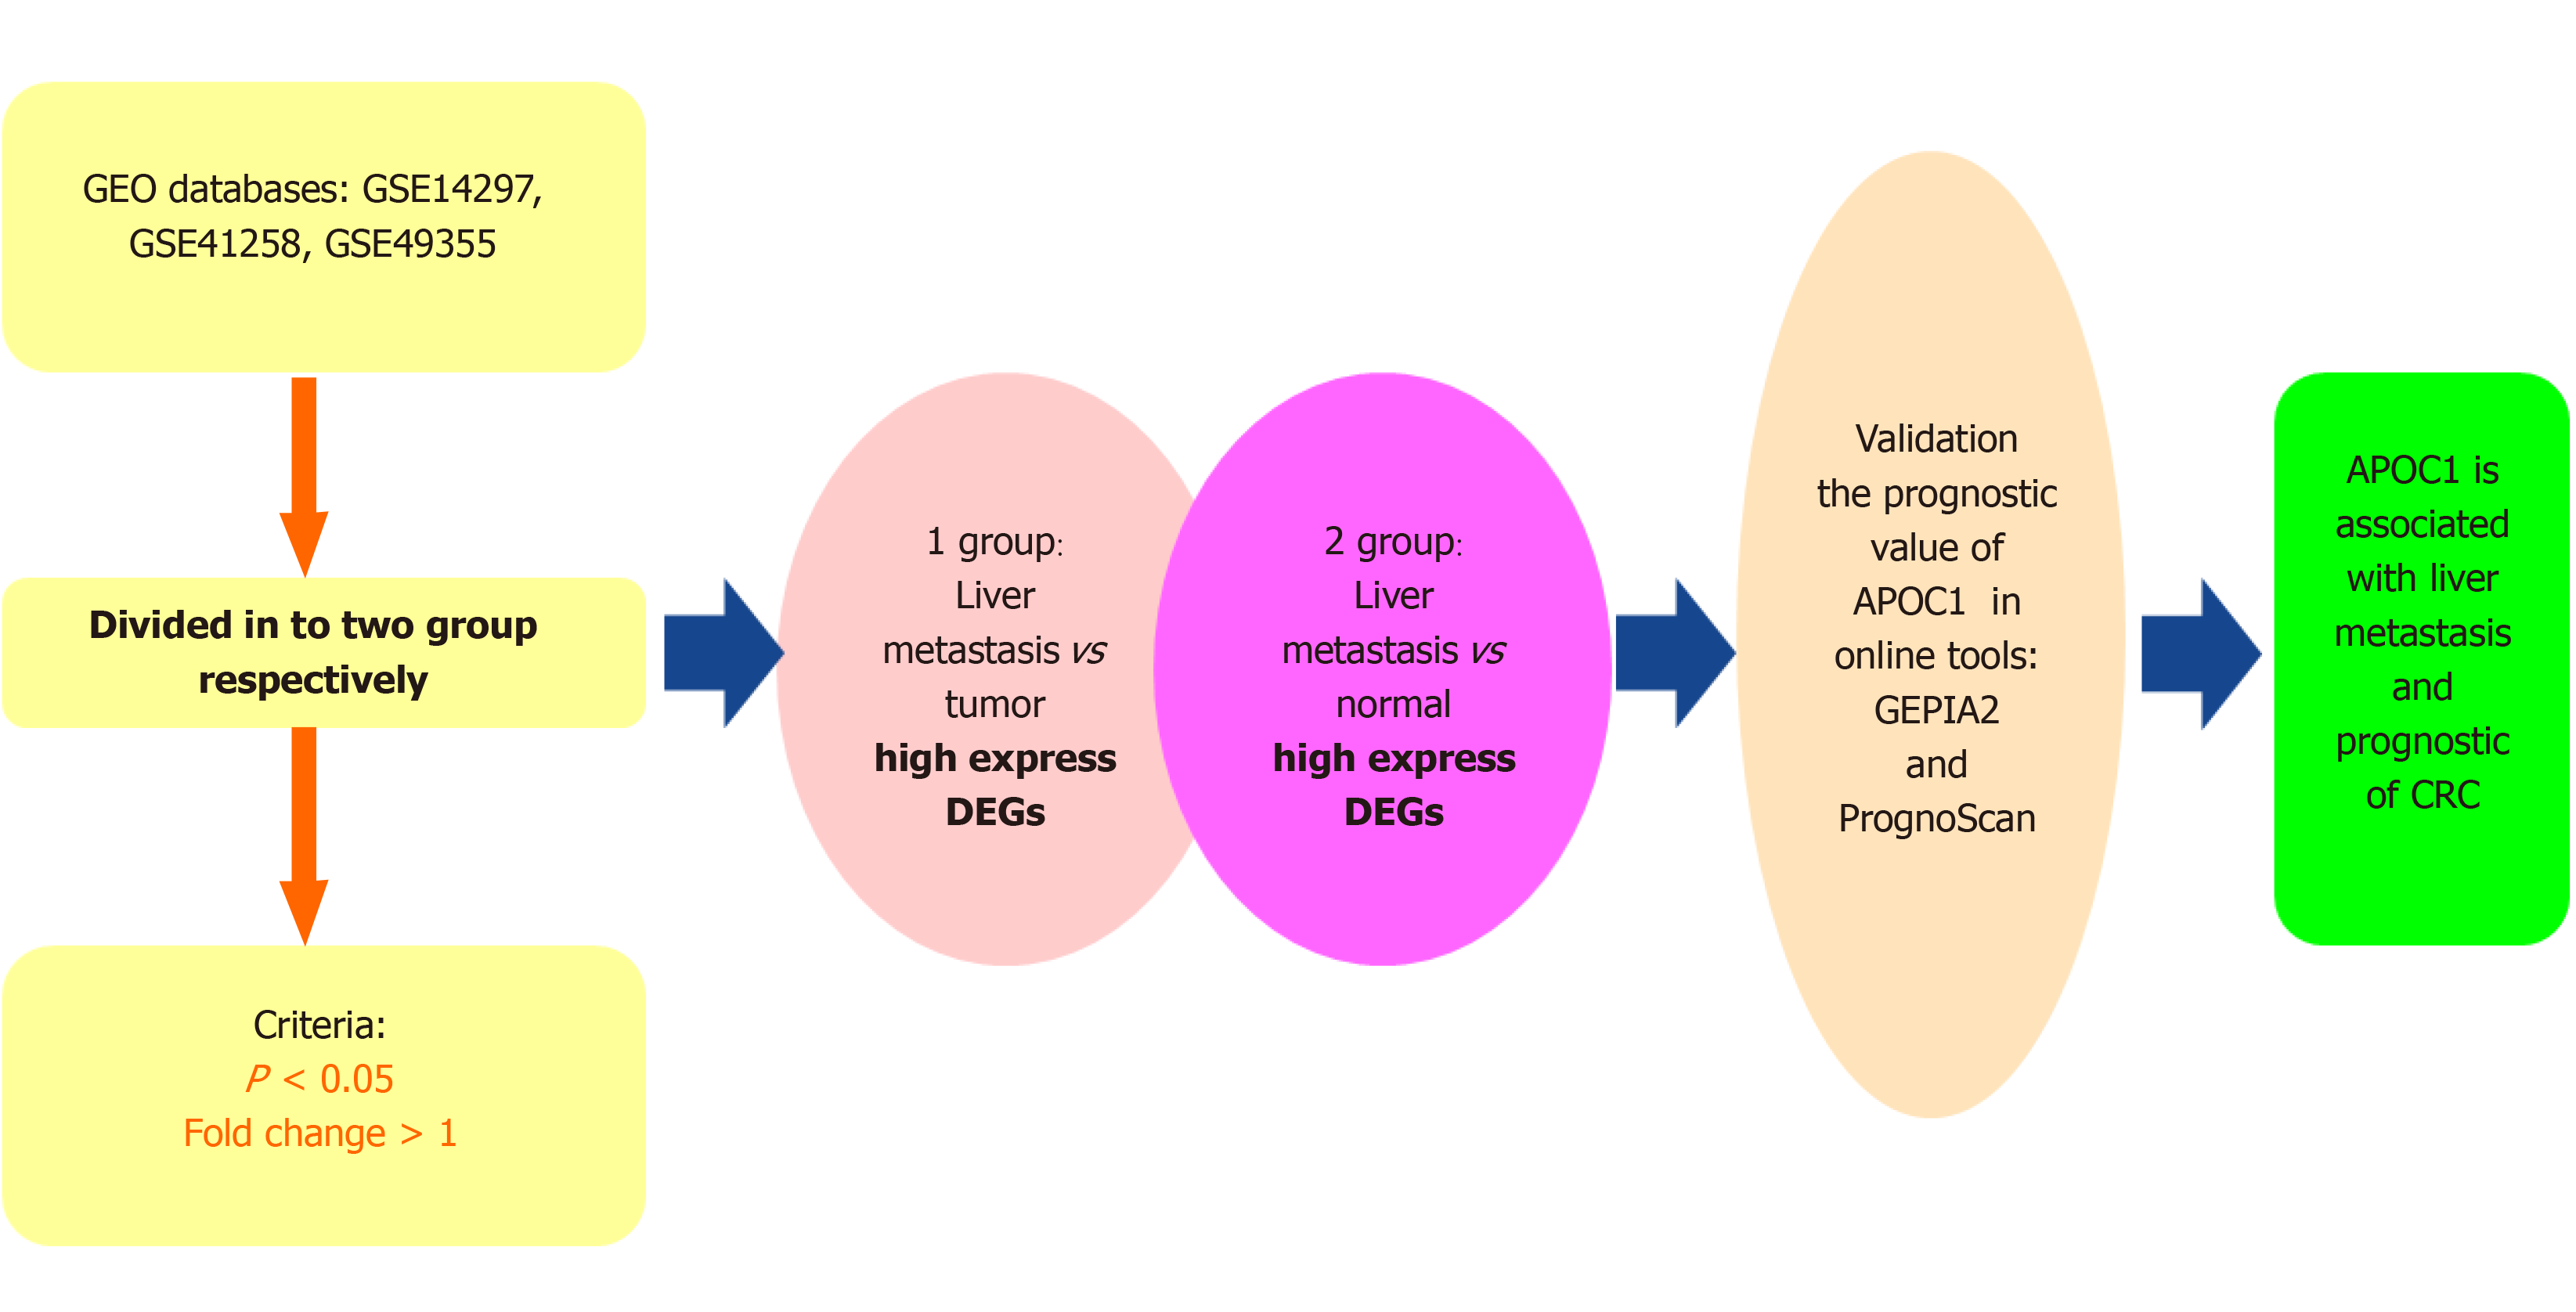
Figure 1 Analysis workflow of this study.
DEGs: Differentially expressed genes; CRC: Colorectal cancer.
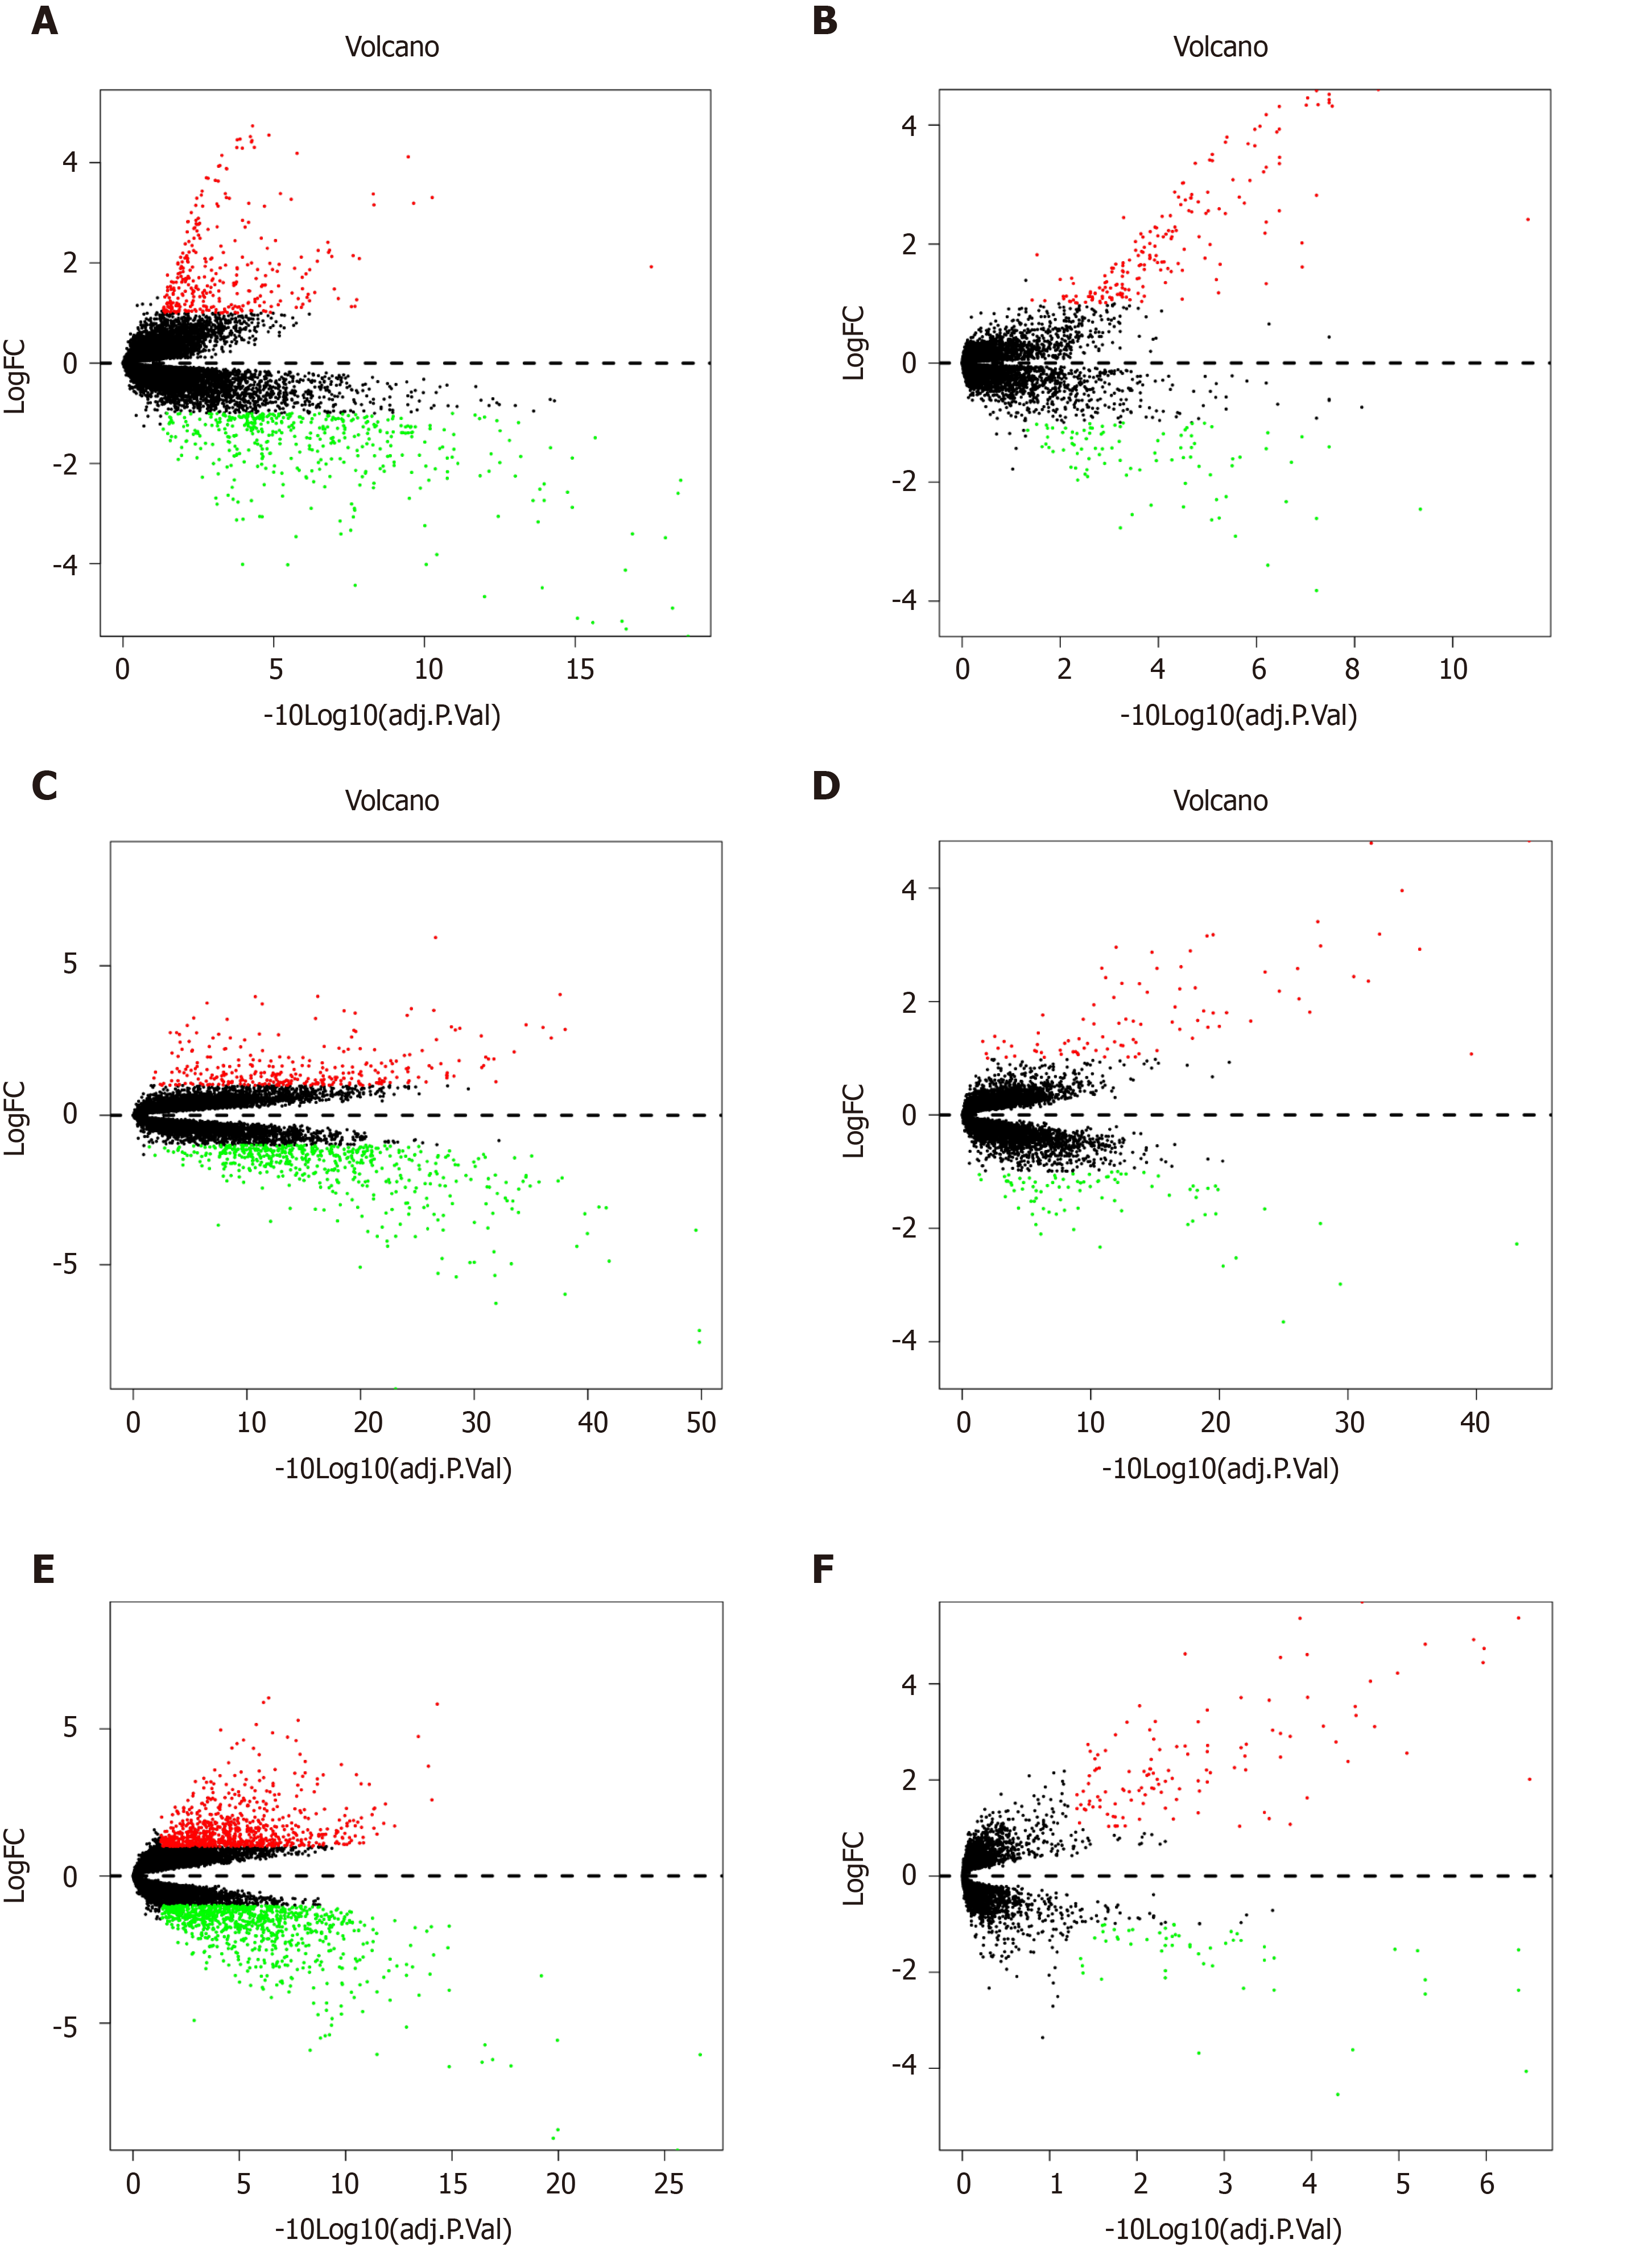
Figure 2 Volcano plots of Gene Expression Omnibus data.
A: Volcano plot depicting the differential expression and distribution of GSE14297 in liver metastasis (LM)-tumor group; B: Volcano plot depicting the differential expression and distribution of GSE14297 in LM-normal group; C: Volcano plot depicting the differential expression and distribution of GSE41258 in LM-tumor group; D: Volcano plot depicting the differential expression and distribution of GSE41258 in LM-normal group; E: Volcano plot depicting the differential expression and distribution of GSE49355 in LM-tumor group; F: Volcano plot depicting the differential expression and distribution of GSE49355 in LM-normal group.
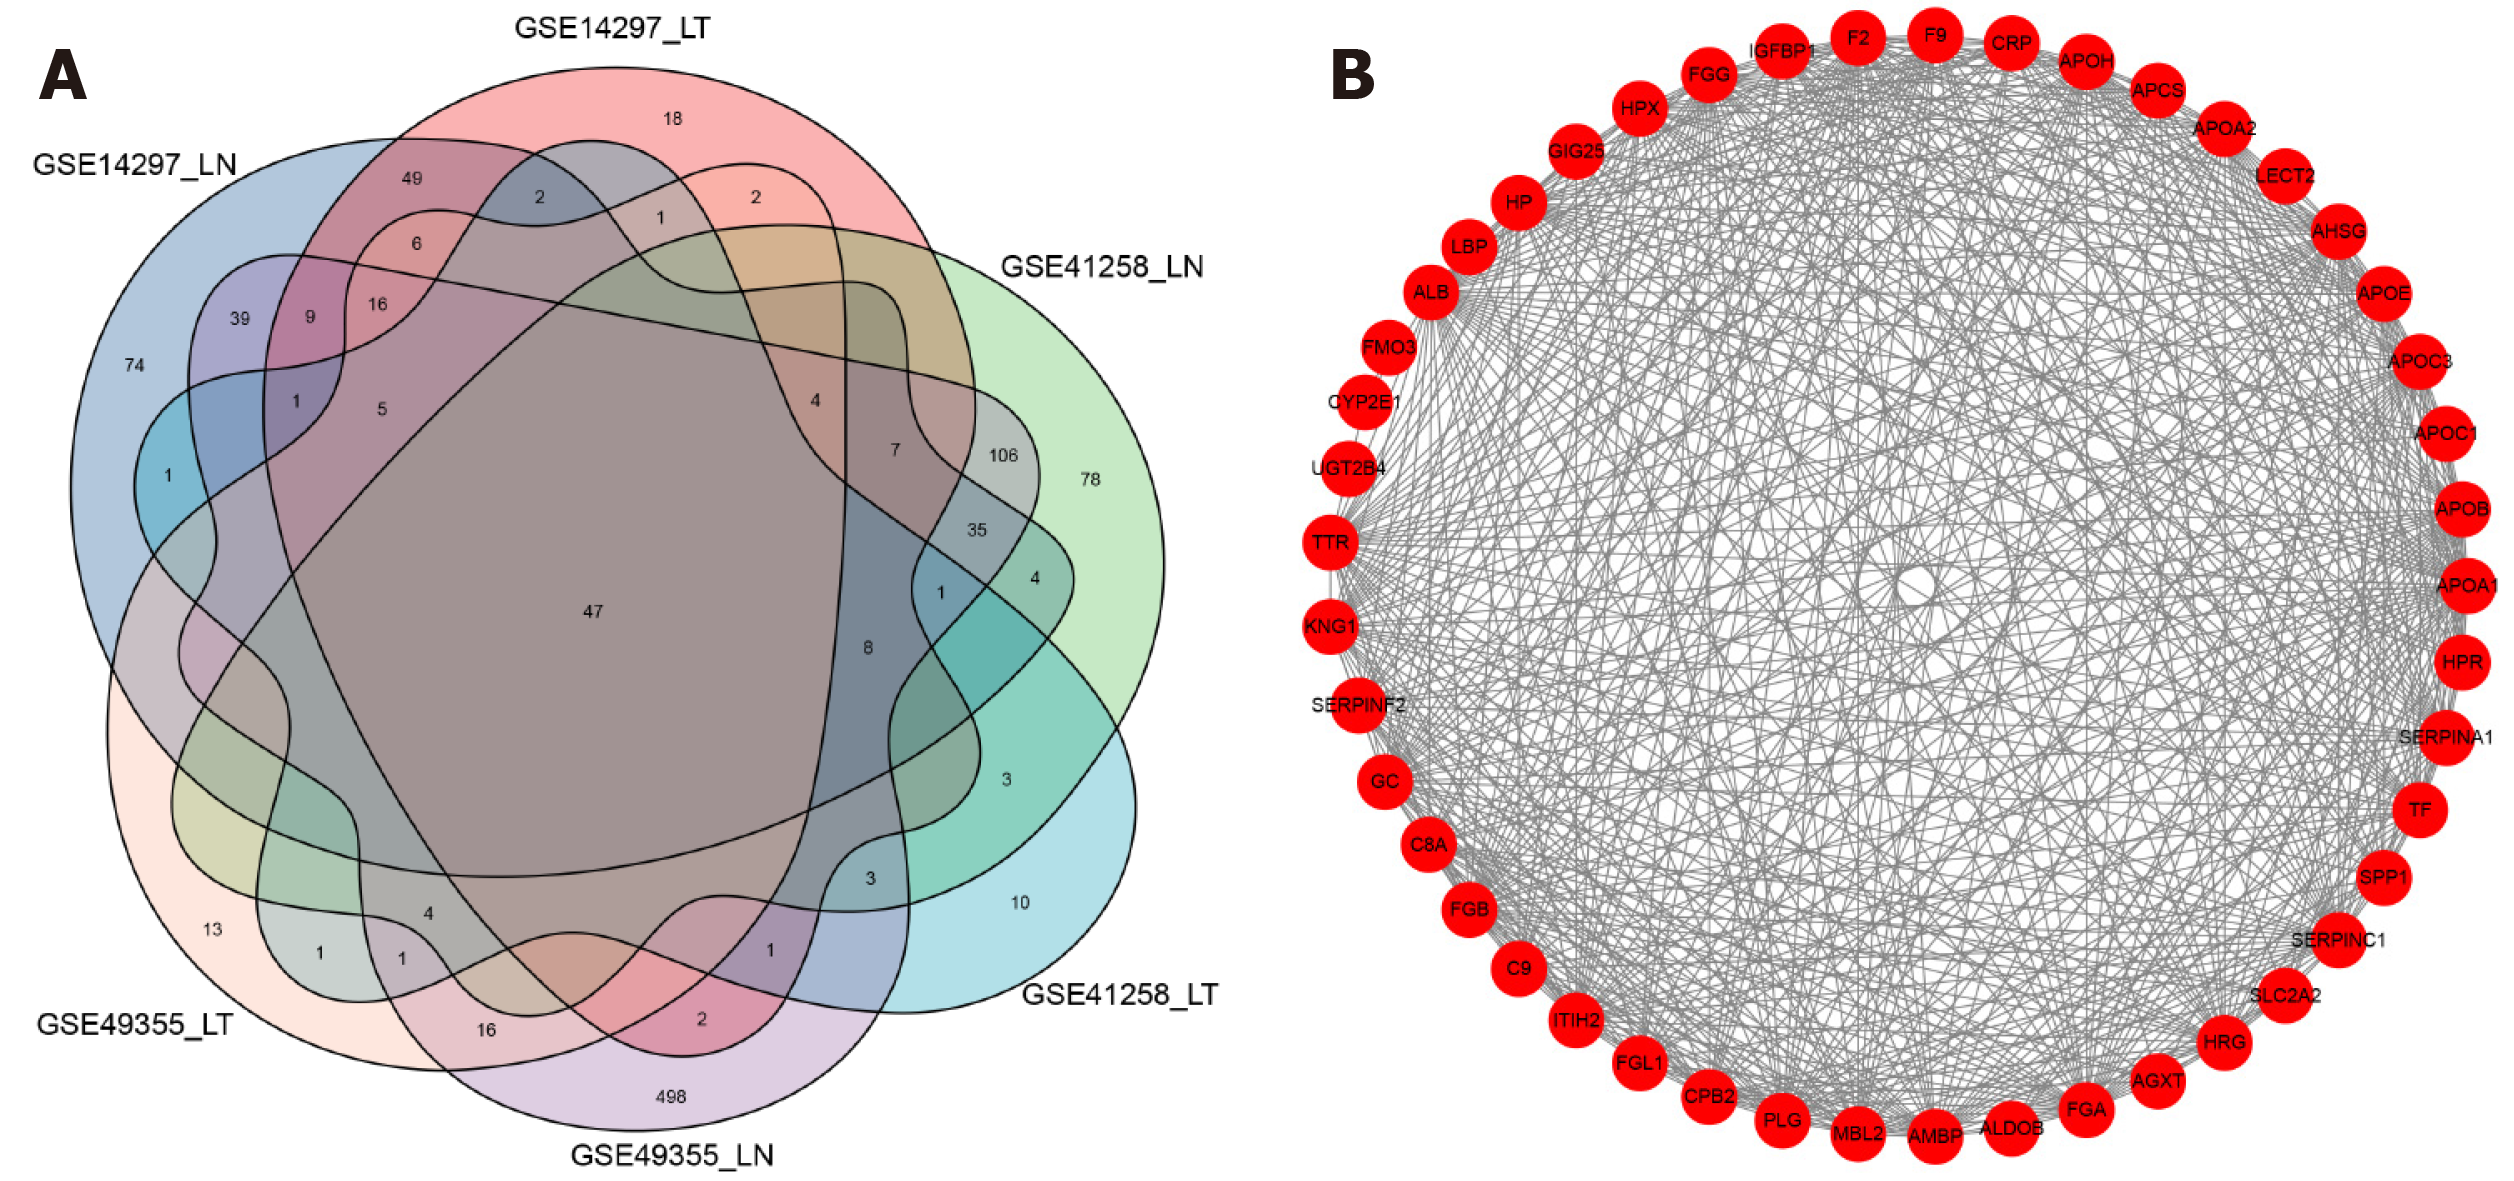
Figure 3 Venn diagram and protein-protein interaction network of differentially expressed genes.
A: Venn diagram showing the numbers of differentially expressed genes; B: Protein-protein interaction network of 47 highly expressed genes.
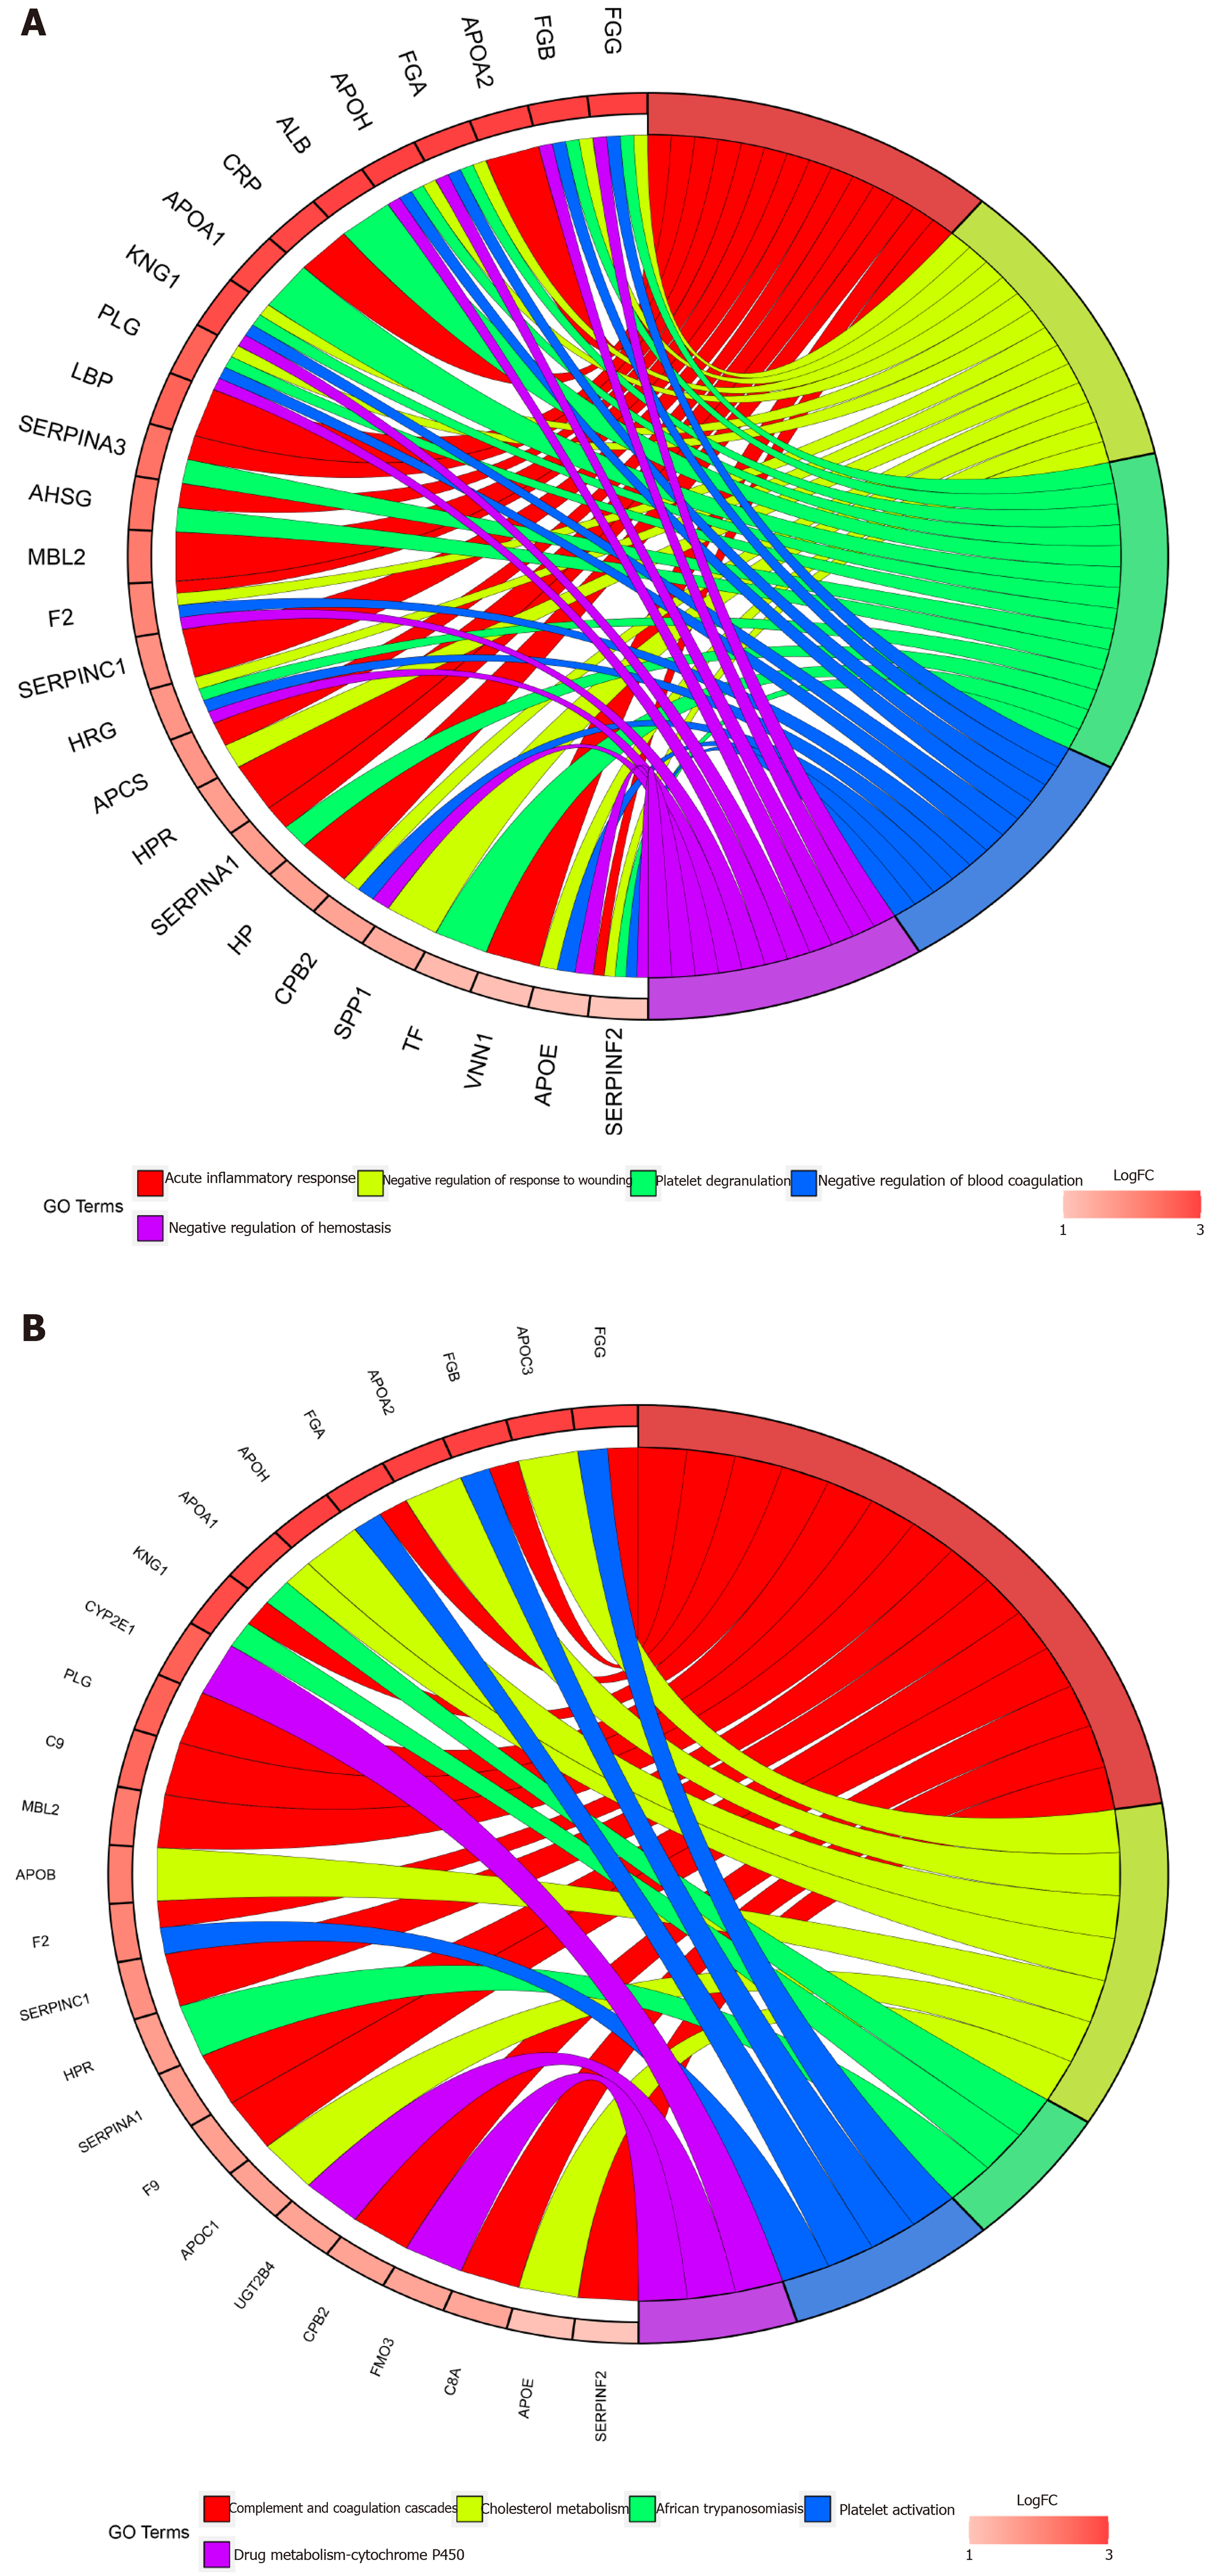
Figure 4 GO and KEGG enrichment.
A: Chord plot depicting the relationships between the genes and GO terms; B: Chord plots depicting the functions of the genes in KEGG pathways.
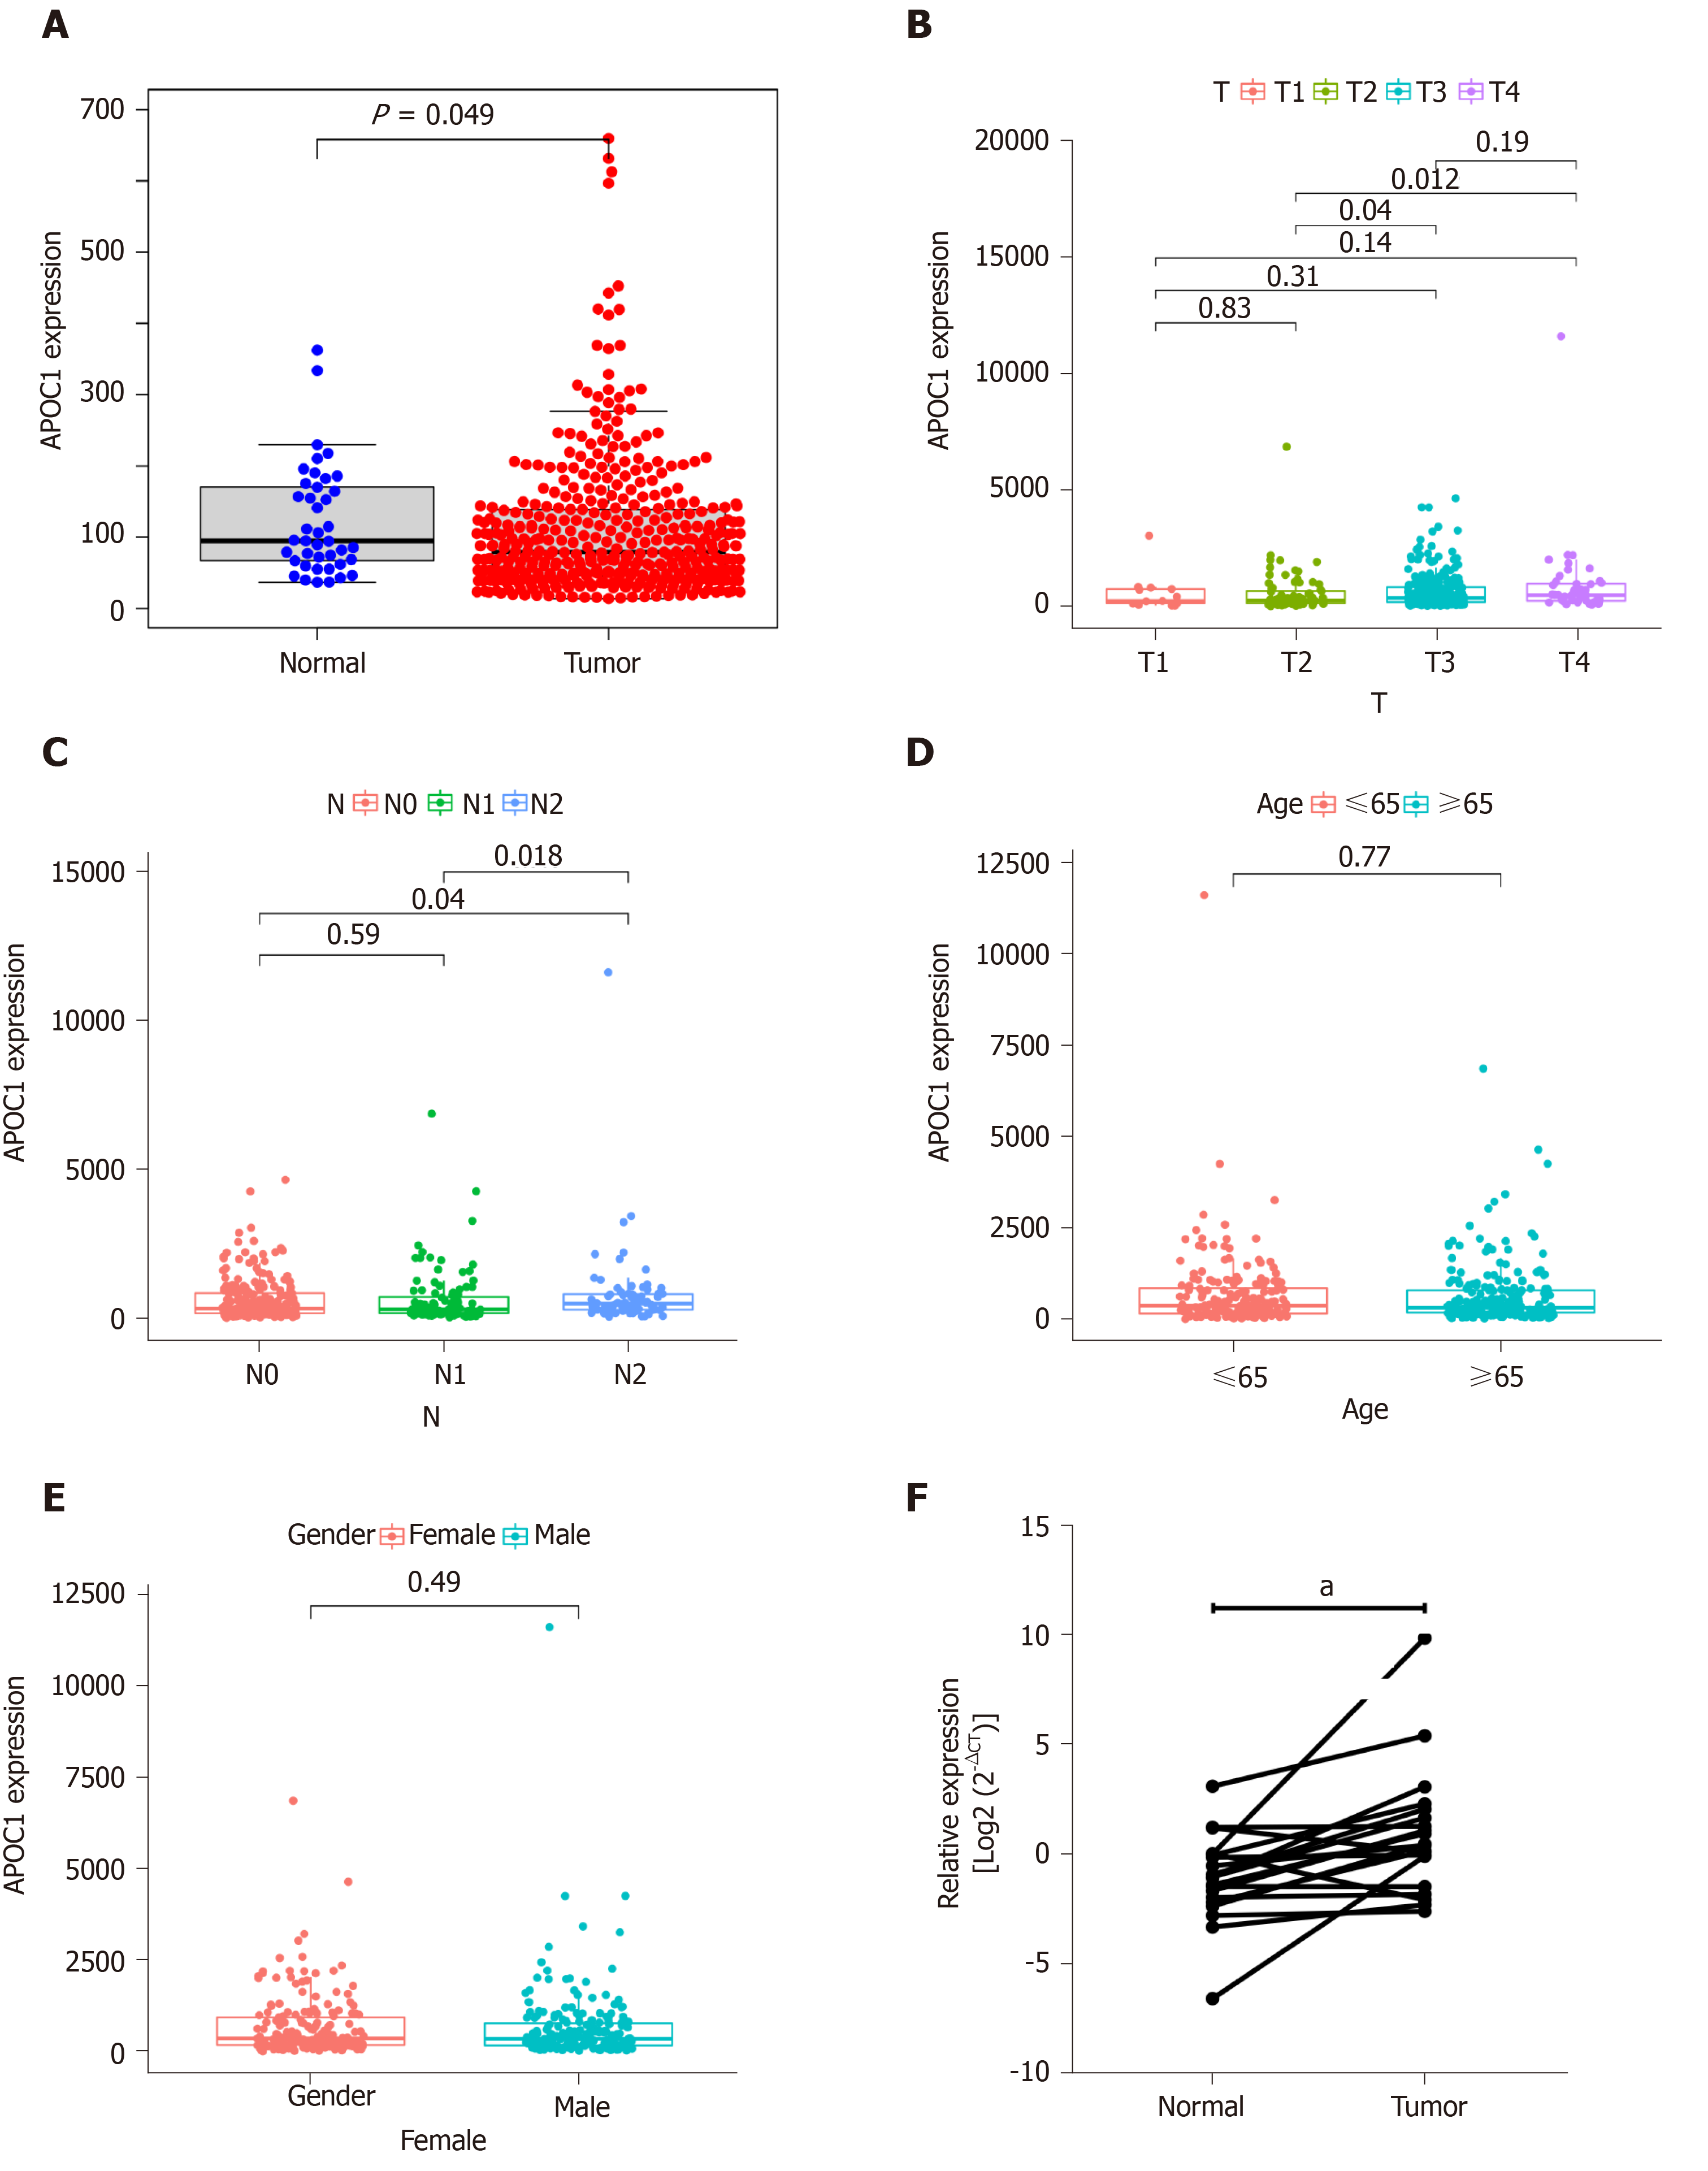
Figure 5 Visualization of correlations between APOC1 expression levels and clinical features.
A: Differences in APOC1 expression between control tissues and colorectal cancer tissues based on TCGA database; B: Differences in APOC1 expression between different T stages based on TCGA database; C: Differences in APOC1 expression between different N stages based on TCGA database; D: Differences in CLCA1 expression between different ages based on TCGA database; E: Differences in APOC1 expression between different gender based on TCGA database; F: Quantitative real-time polymerase chain reaction assay showed the mRNA expression of APOC1 in 20 paired colorectal cancer tissues and normal samples. aP < 0.05. T: Tumor; N: Normal.
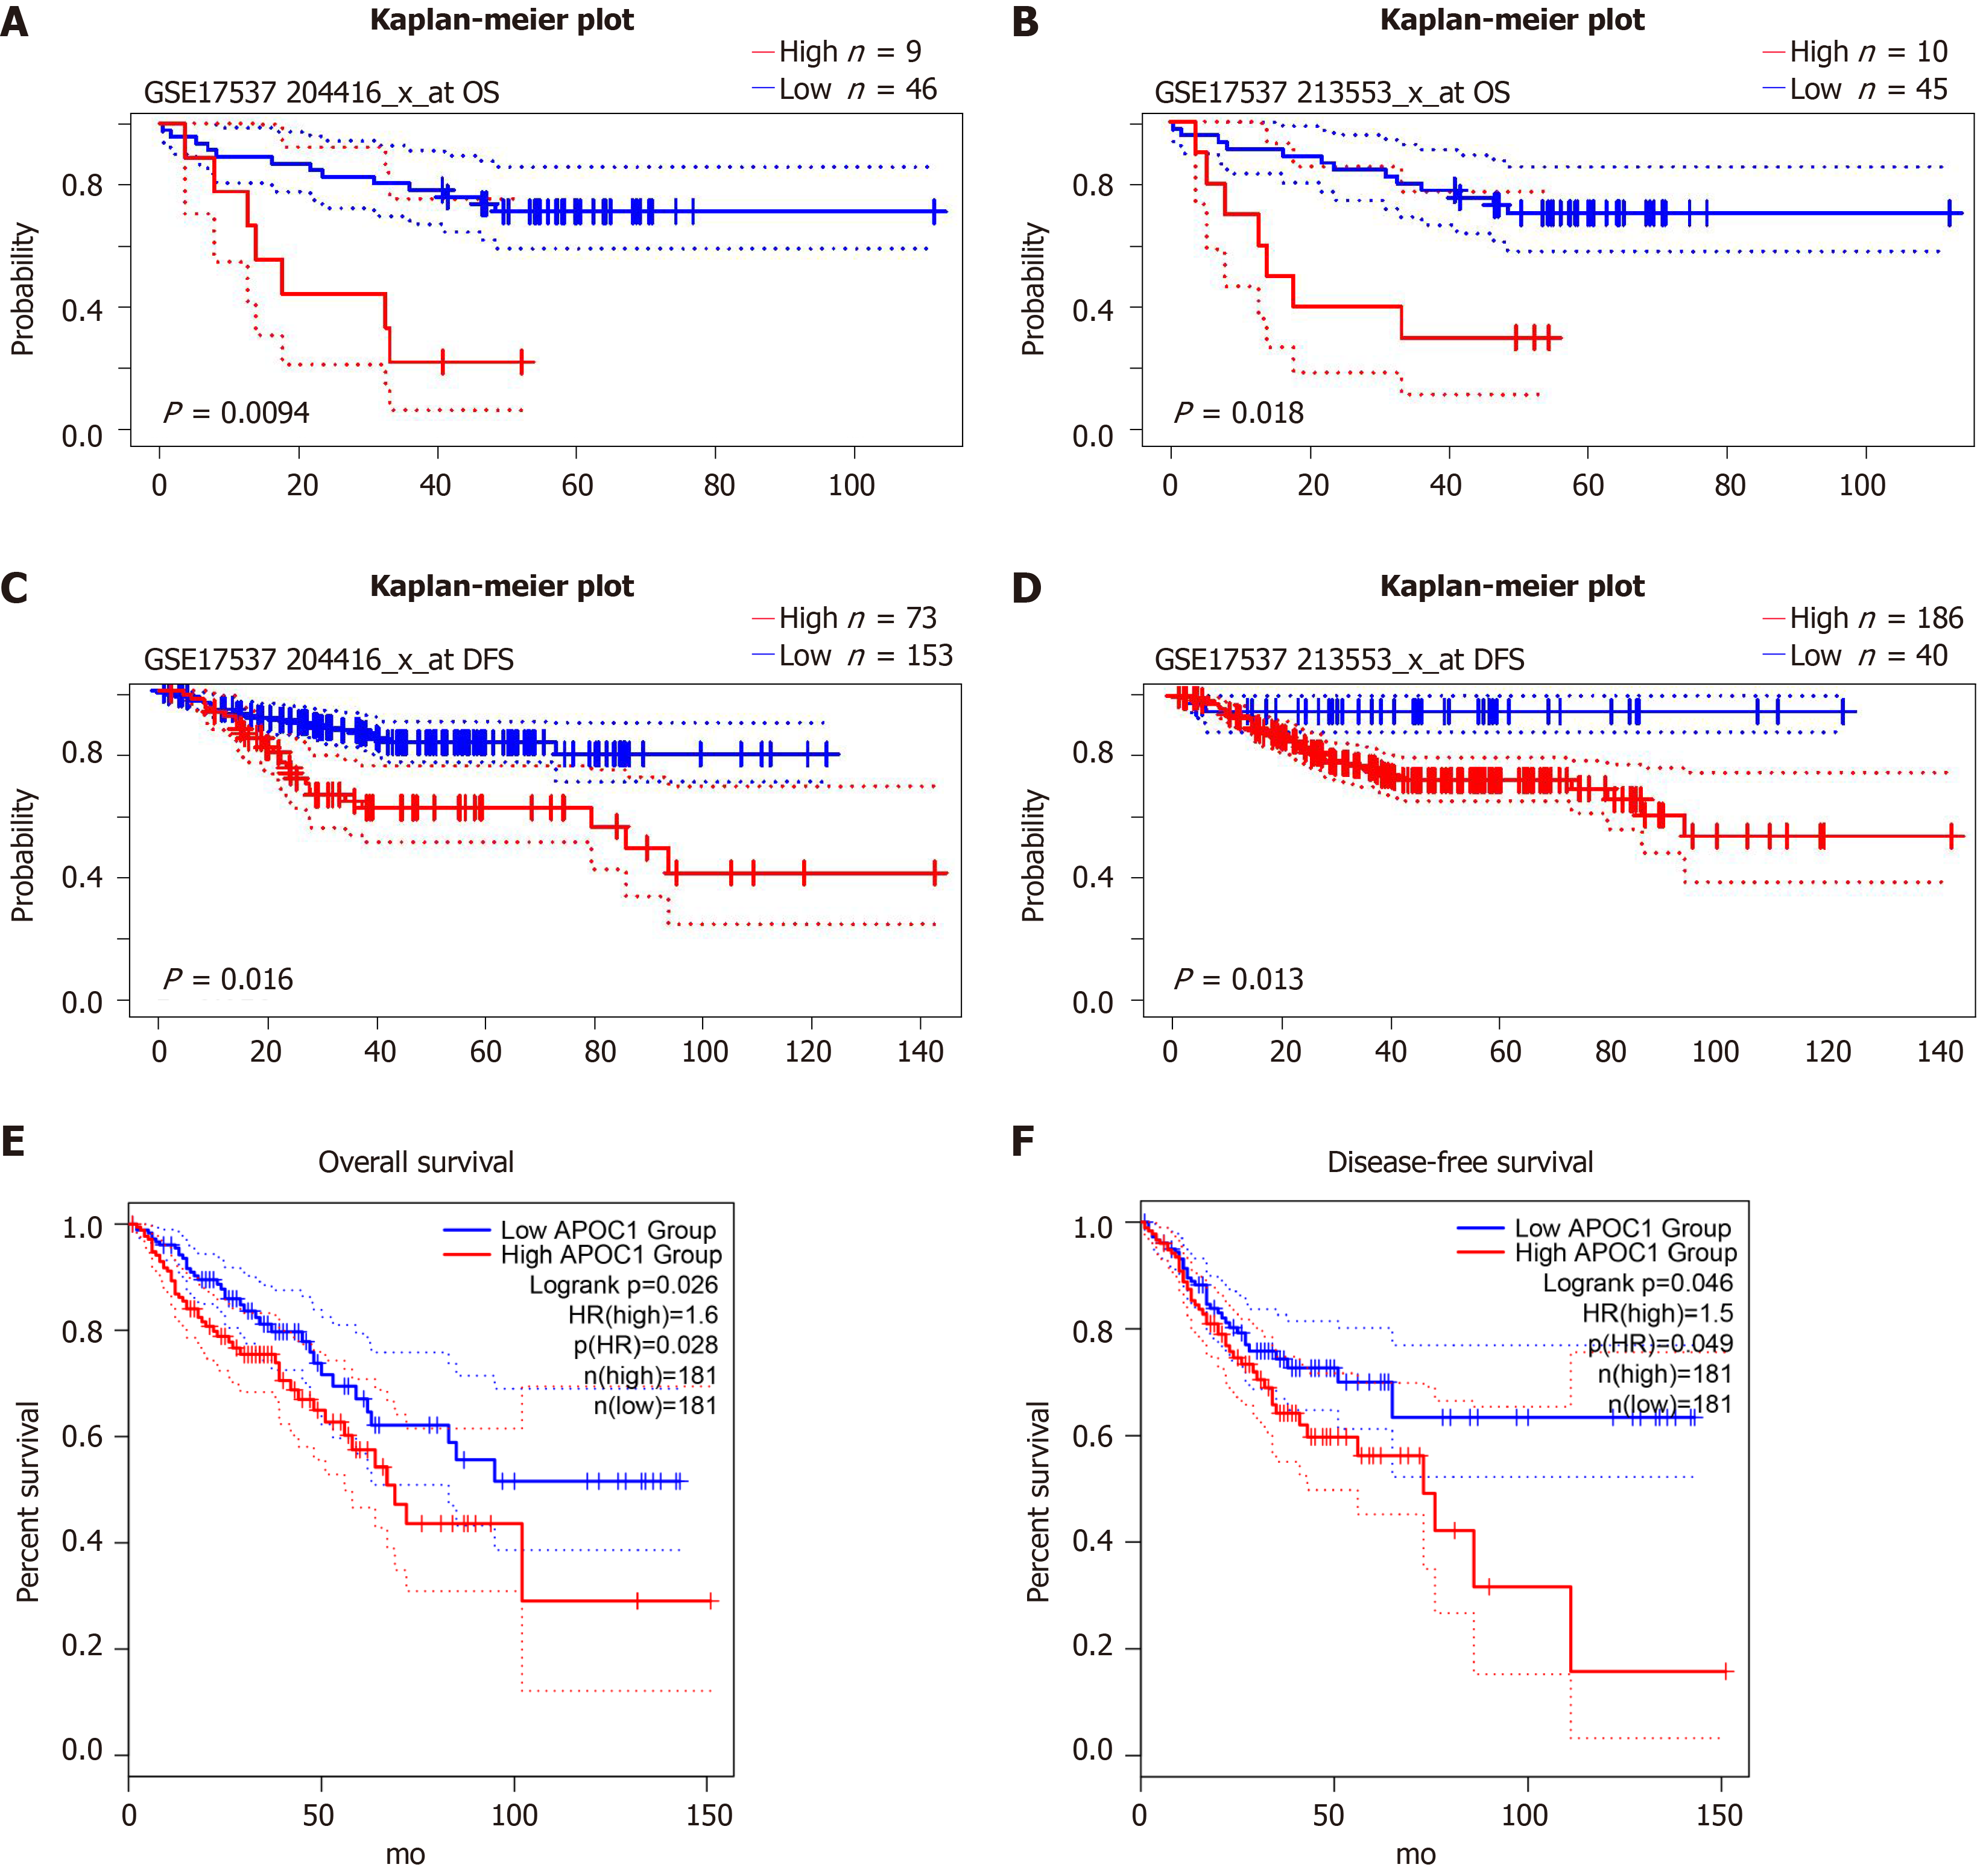
Figure 6 Validation of prognostic value of APOC1.
A and B: Overall survival of APOC1 in GSE17537; C and D: Disease-free survival of APOC1 in GSE14333; E: Overall survival of APOC1 in TCGA; F: Disease-free survival of APOC1 in TCGA. OS: Overall survival; DFS: Disease-free survival.
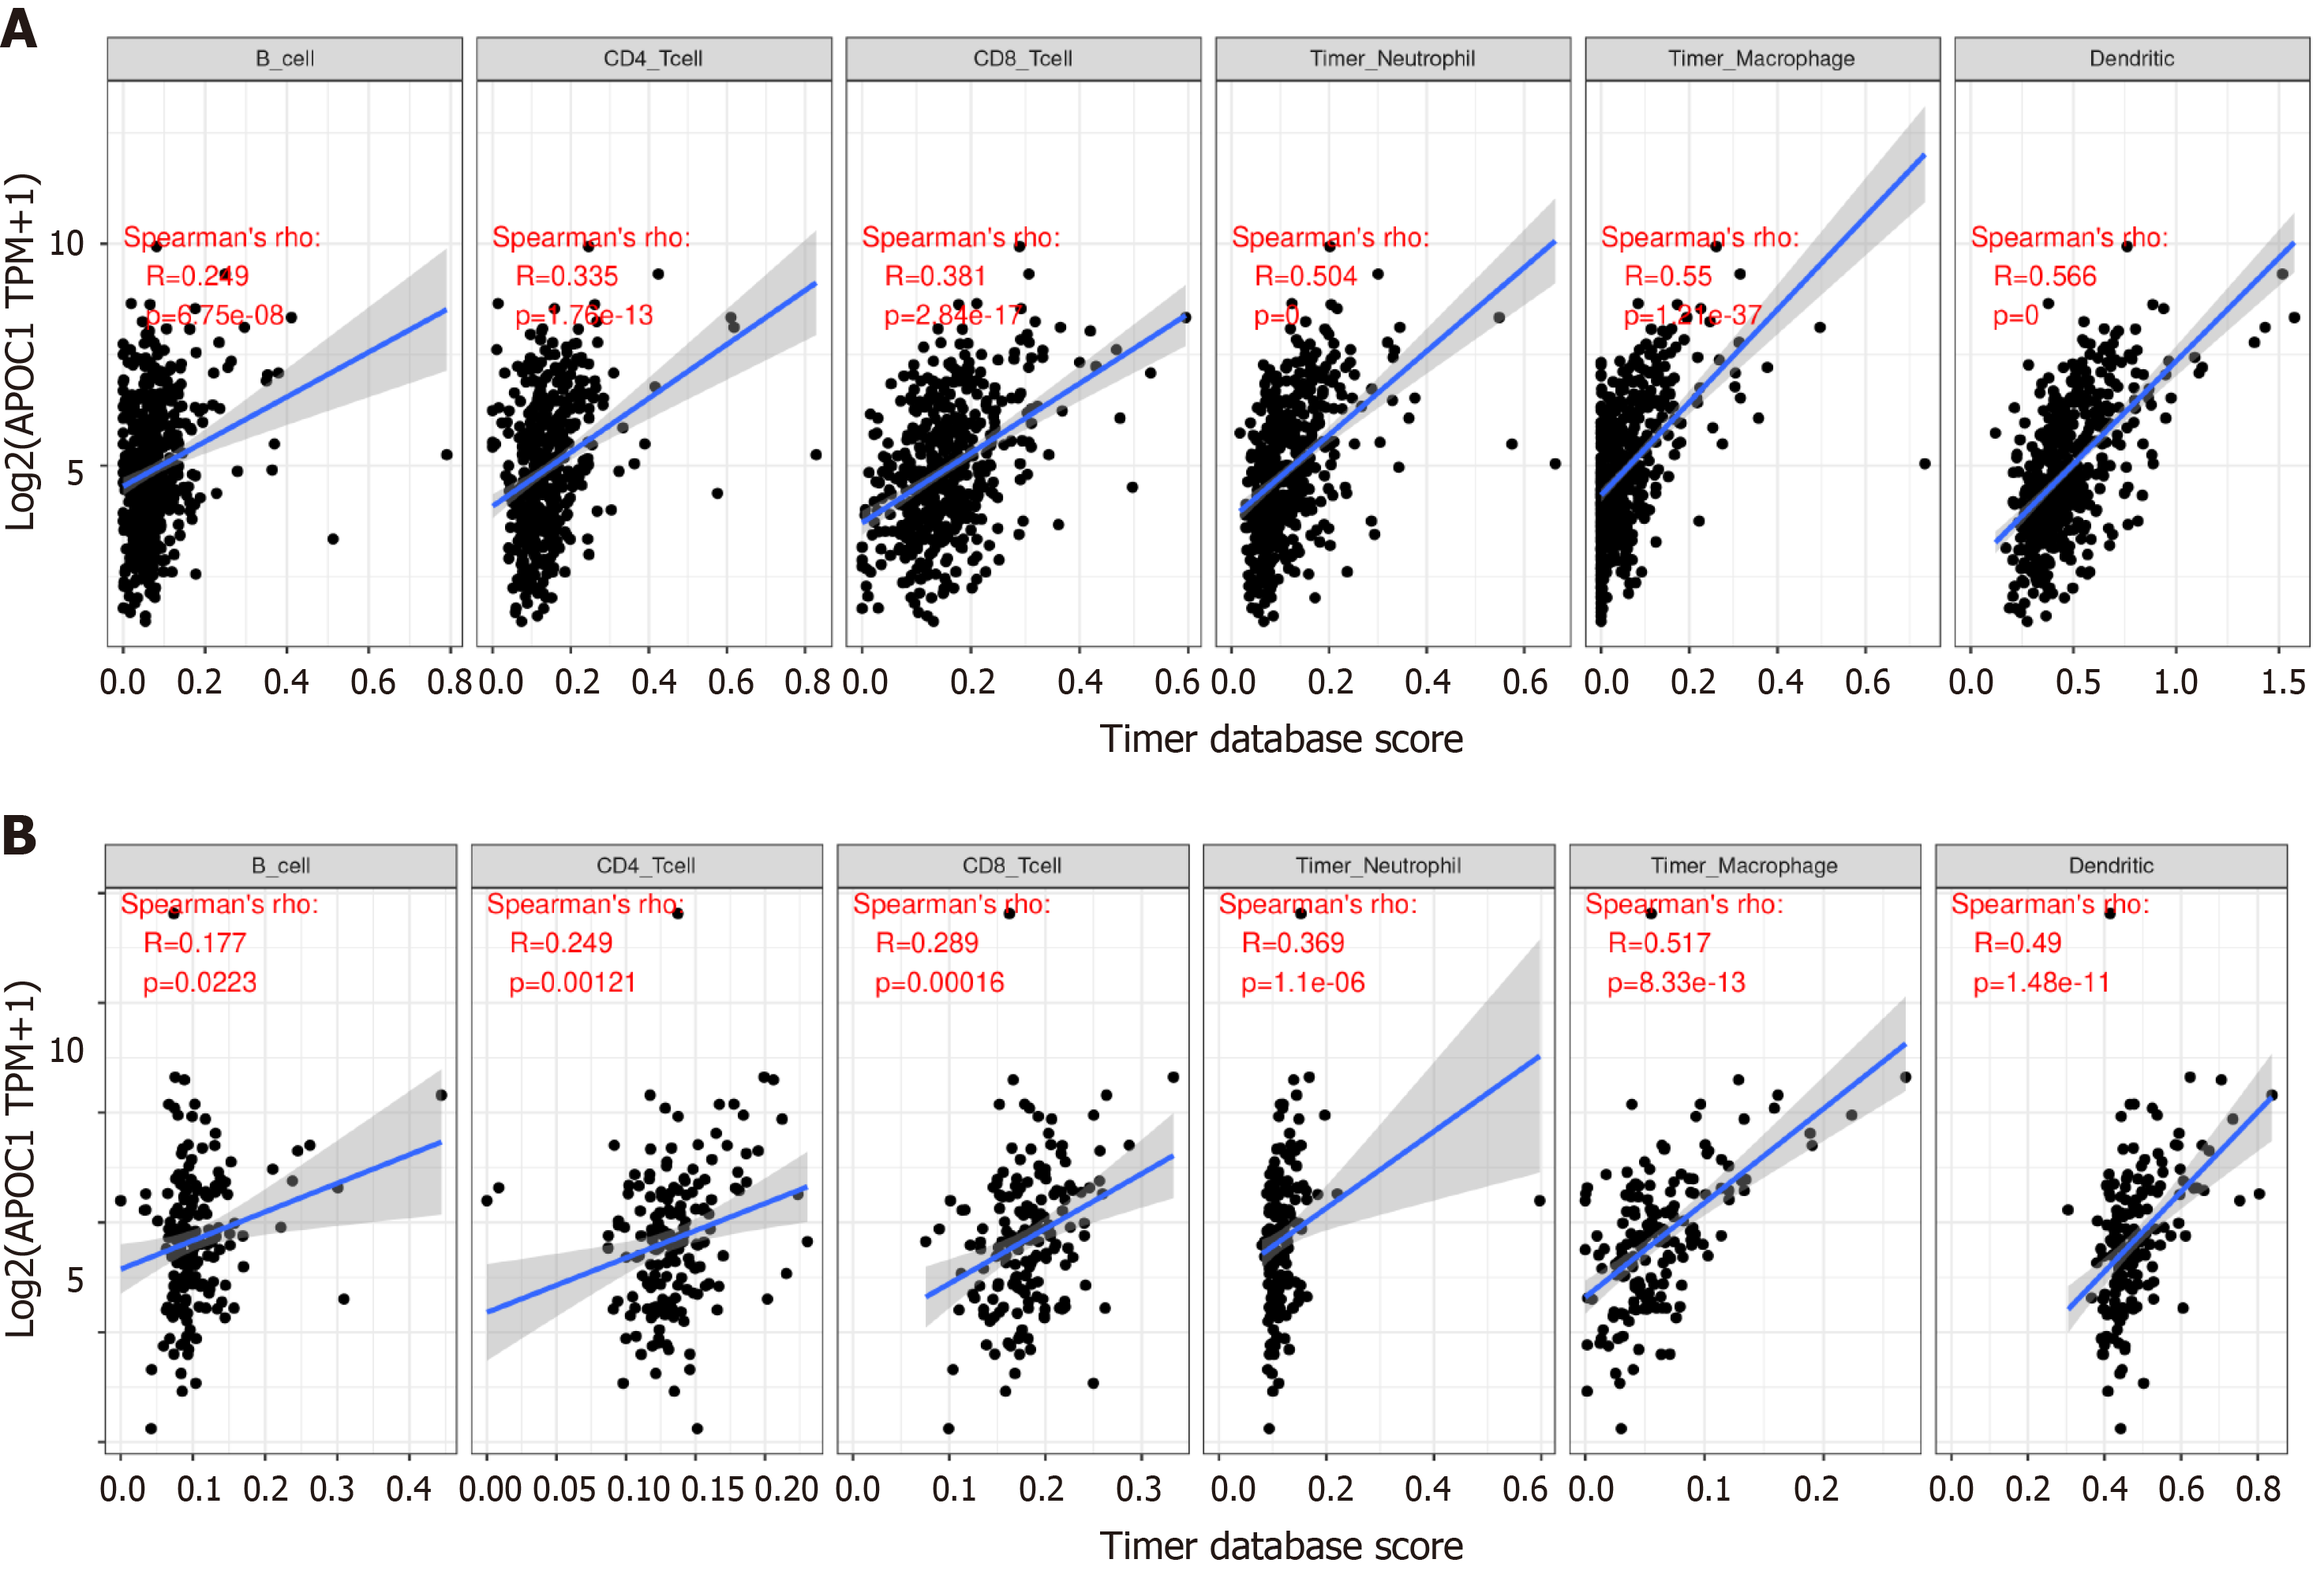
Figure 7 Relationship with immune infiltration.
A: Immune cell expression of APOC1 in colon cancer; B: Immune cell expression of APOC1 in rectal cancer.
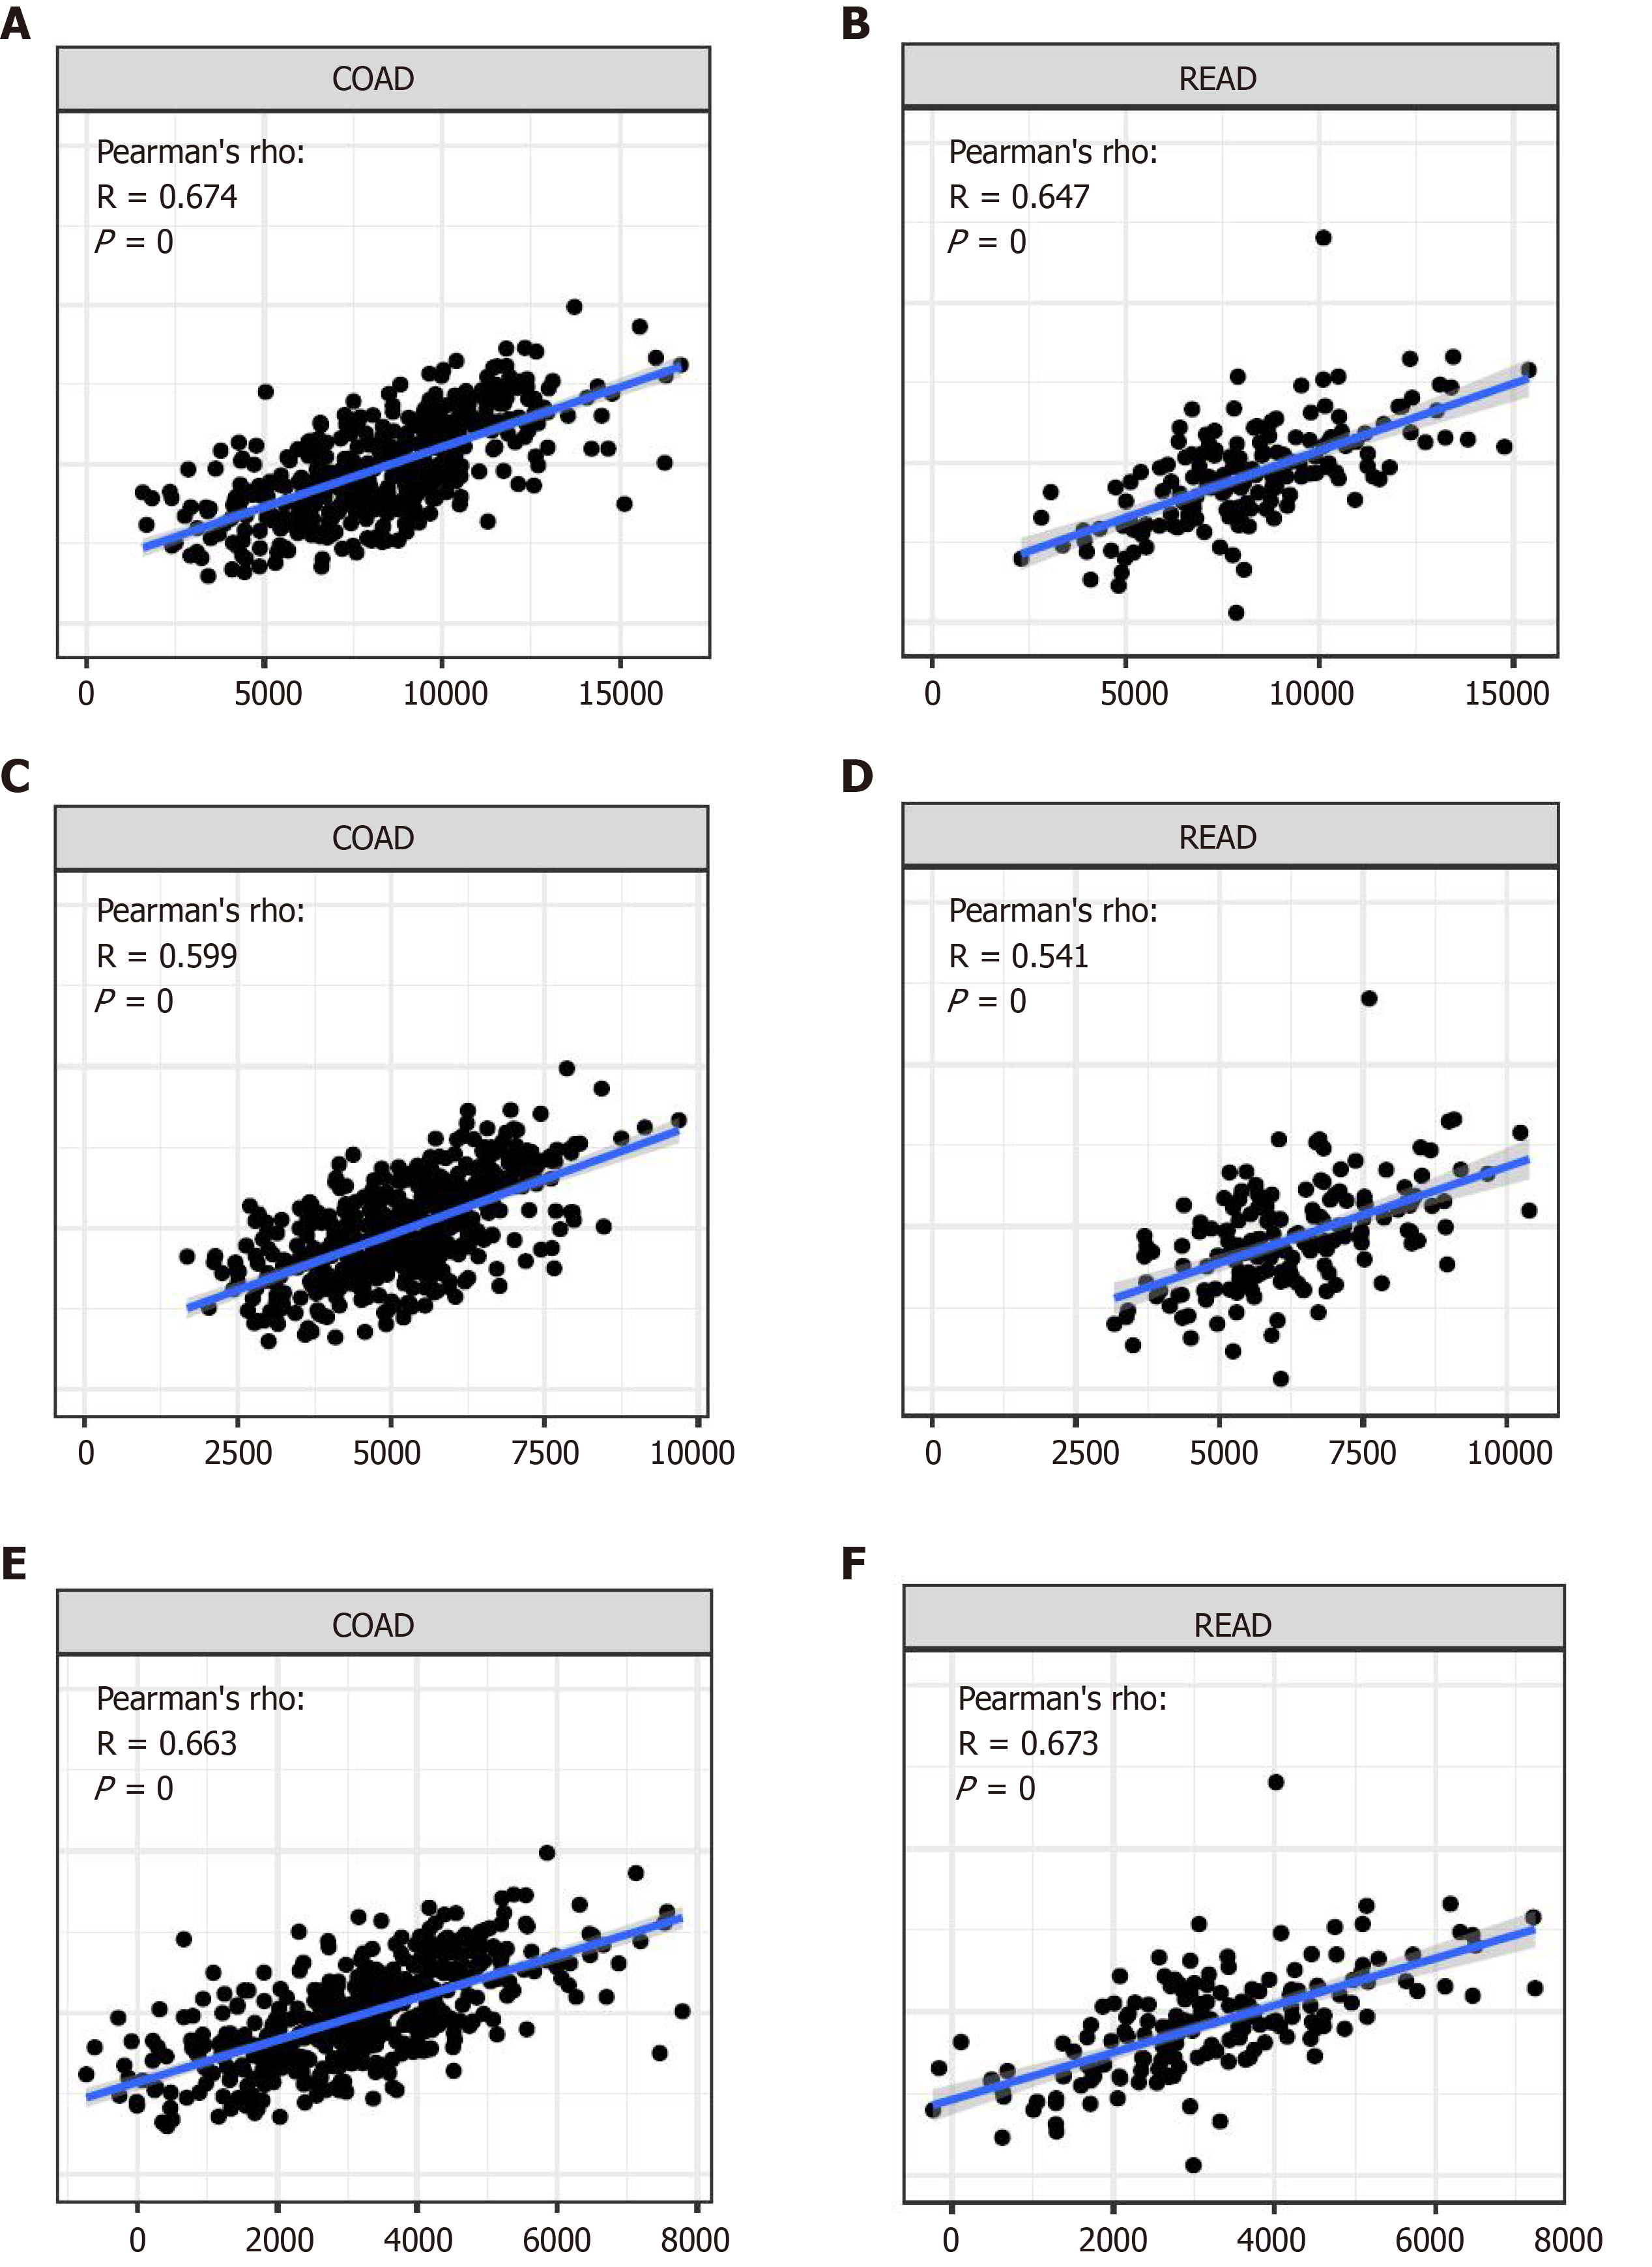
Figure 8 Relationship with tumor microenvironment.
A: Estimated score of APOC1 in colon cancer; B: Estimated score of APOC1 in rectum cancer; C: Immune score of APOC1 in colon cancer; D: Immune score of APOC1 in rectum cancer; E: Stromal score of APOC1 in colon cancer; F: Stromal score of APOC1 in rectum cancer.
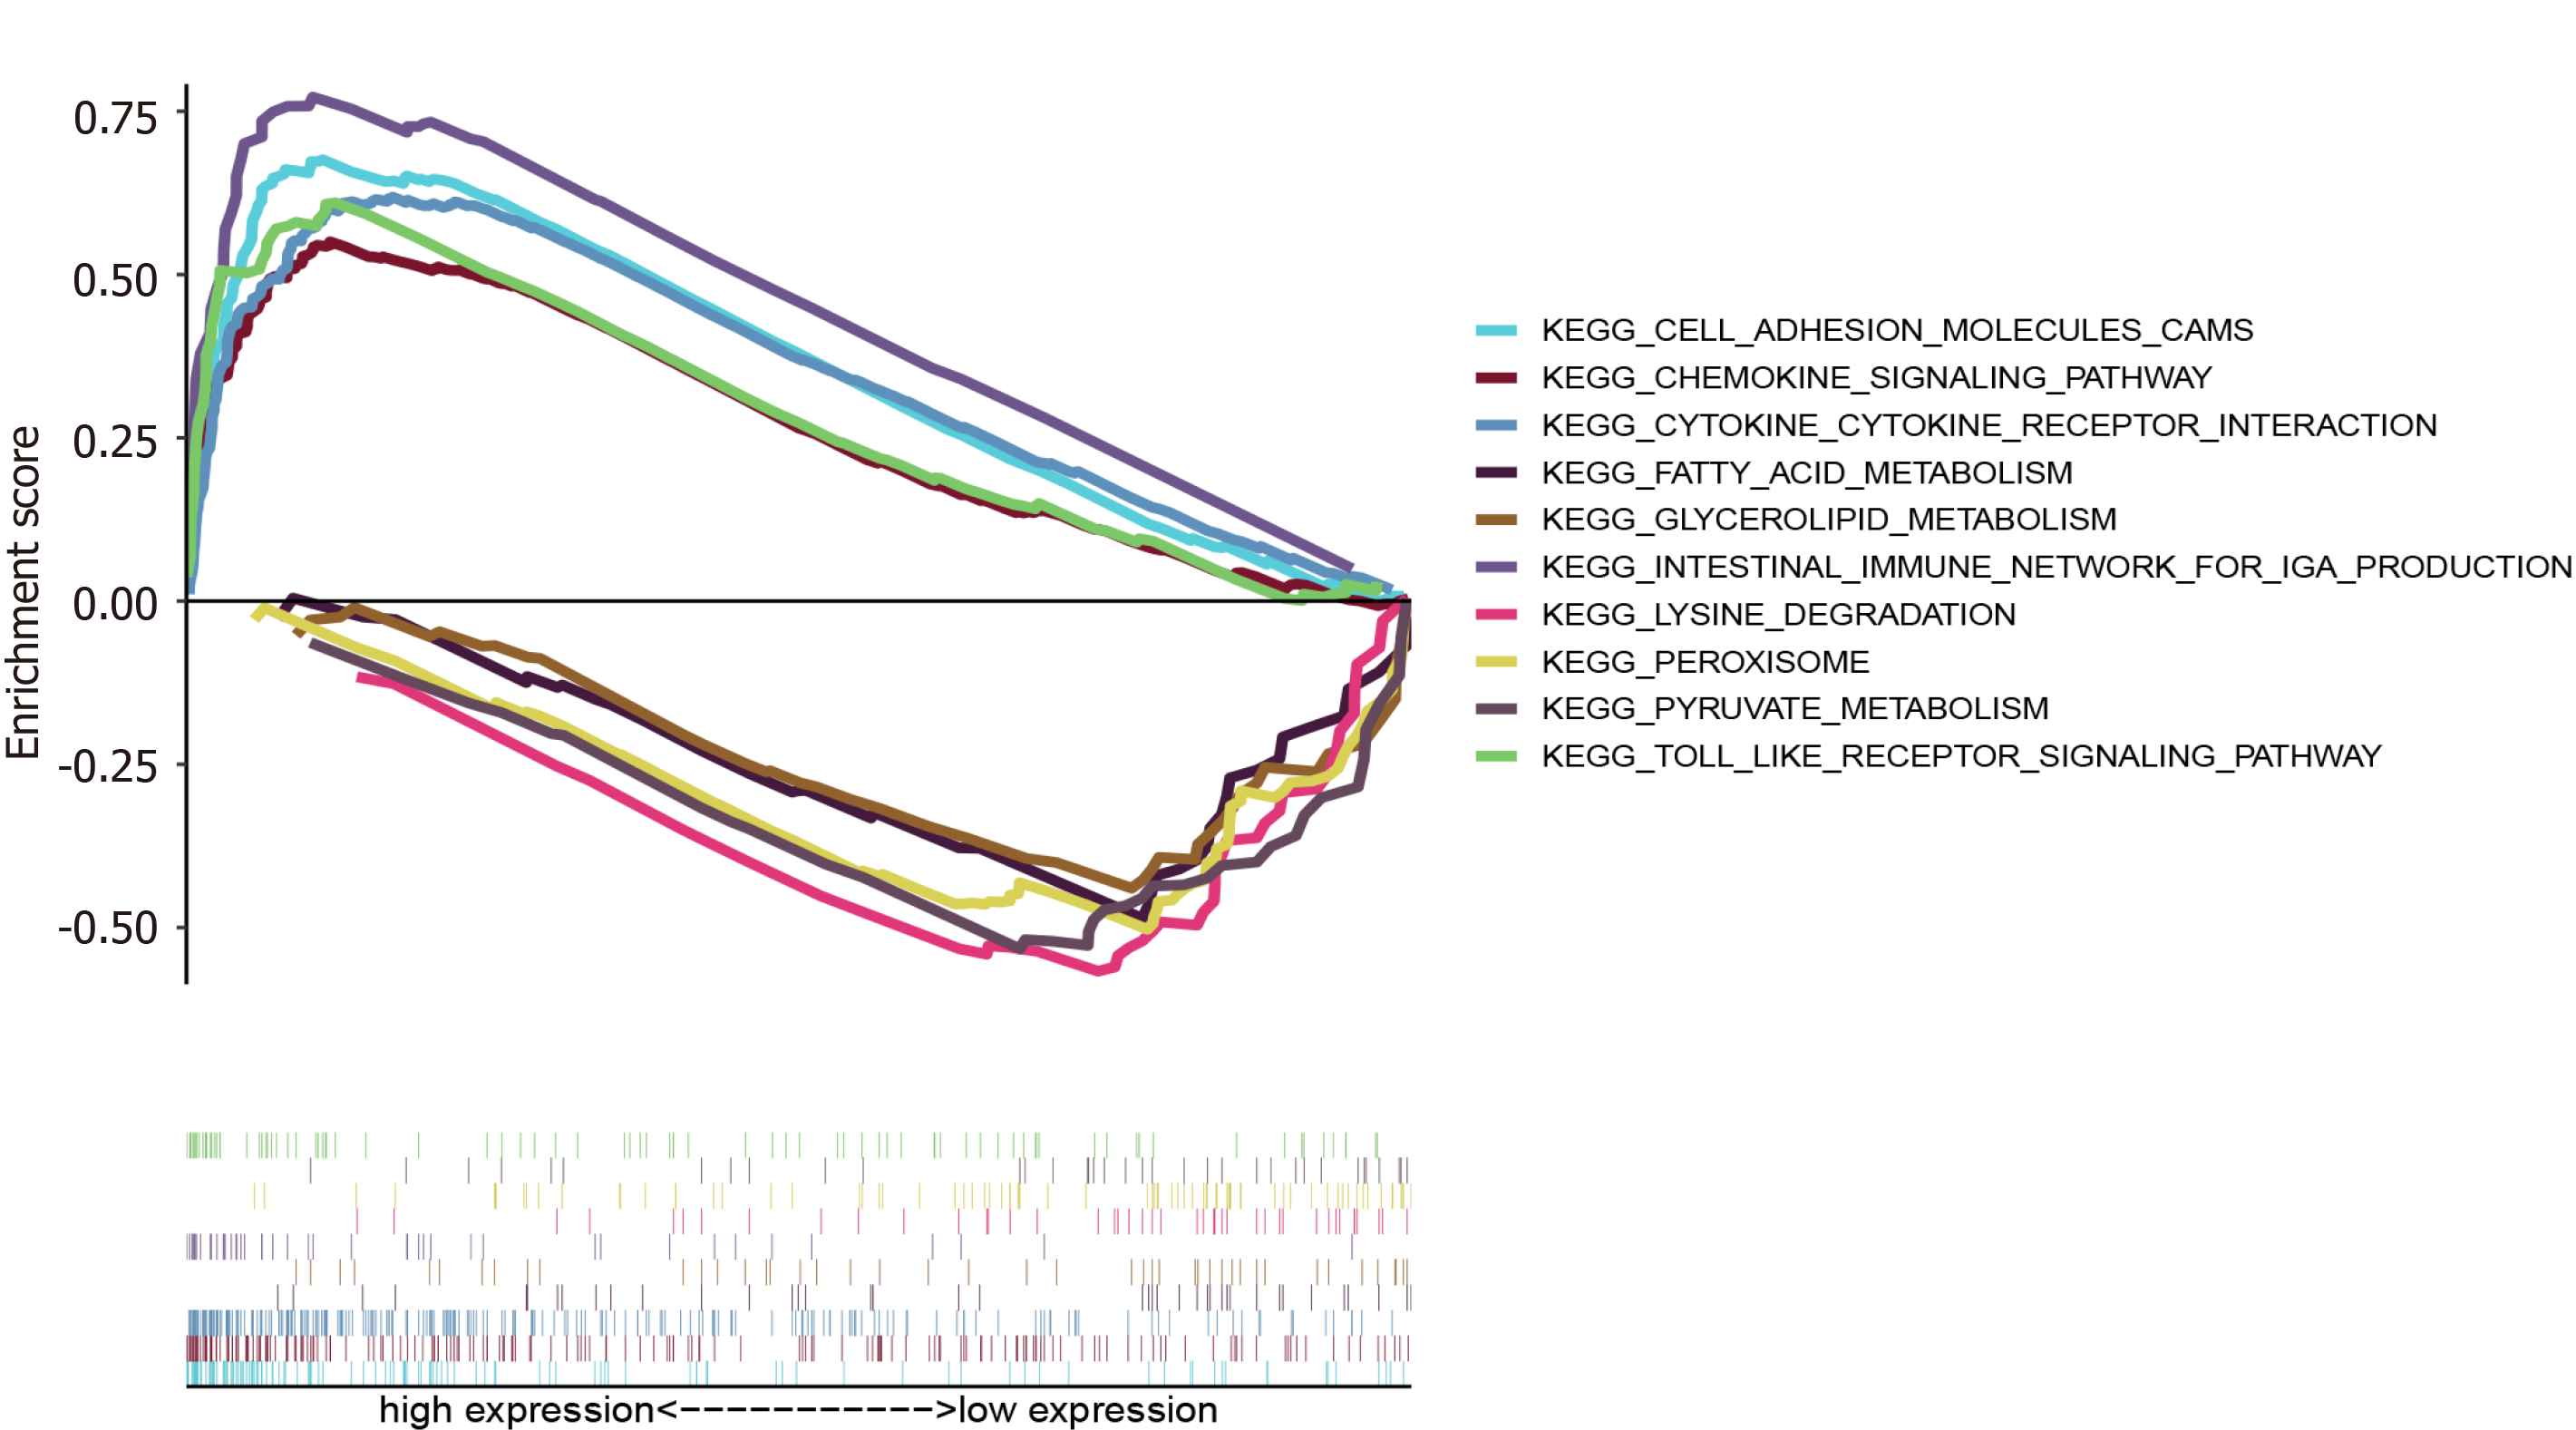
Figure 9 Gene set enrichment analysis of APOC1.
- Citation: Shen HY, Wei FZ, Liu Q. Differential analysis revealing APOC1 to be a diagnostic and prognostic marker for liver metastases of colorectal cancer. World J Clin Cases 2021; 9(16): 3880-3894
- URL: https://www.wjgnet.com/2307-8960/full/v9/i16/3880.htm
- DOI: https://dx.doi.org/10.12998/wjcc.v9.i16.3880


