Copyright
©The Author(s) 2022.
World J Clin Cases. Apr 16, 2022; 10(11): 3401-3413
Published online Apr 16, 2022. doi: 10.12998/wjcc.v10.i11.3401
Published online Apr 16, 2022. doi: 10.12998/wjcc.v10.i11.3401
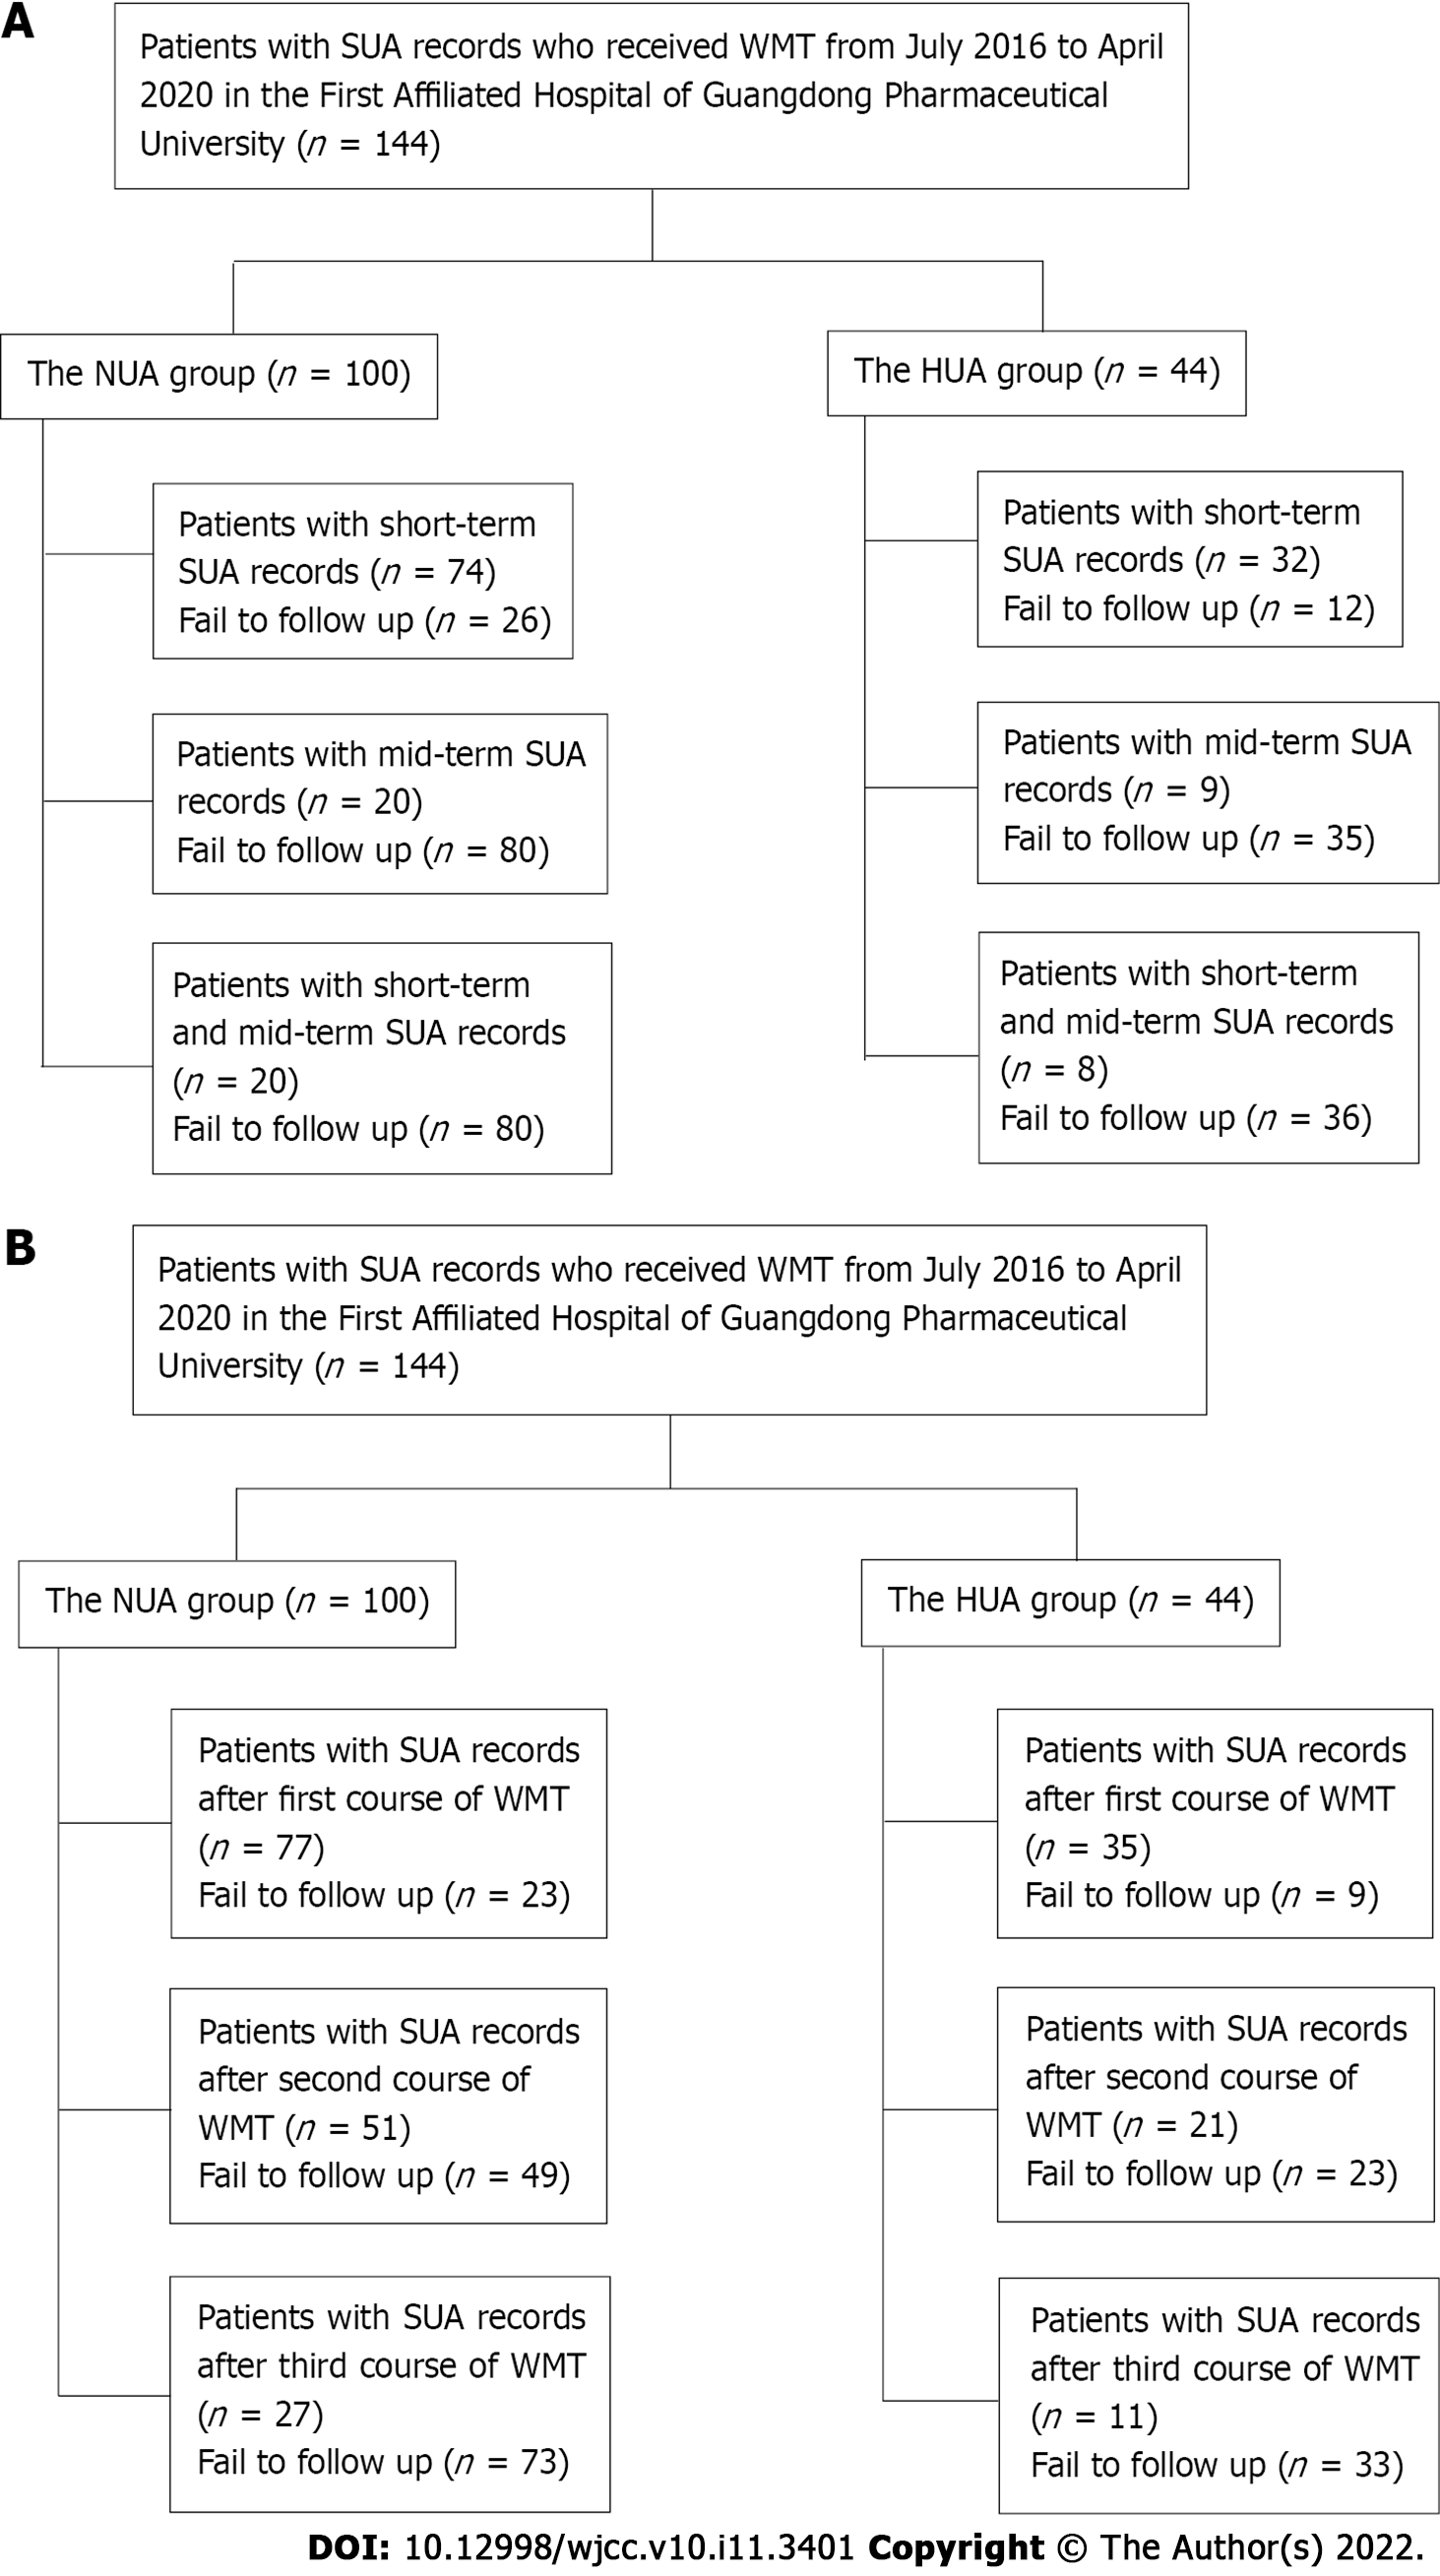
Figure 1 Flow chart of patient inclusion for analysis effects of washed microbiota transplantation on serum uric acid levels.
A: Flow chart of patient inclusion for analysis of the short-term and mid-term effects of washed microbiota transplantation (WMT) on serum uric acid (SUA) levels; B: Flow chart of patient inclusion for analysis of the effects of the course of WMT on SUA levels. HUA: Hyperuricaemia; NUA: Normal uric acid; SUA: Serum uric acid; WMT: Washed microbiota transplantation.
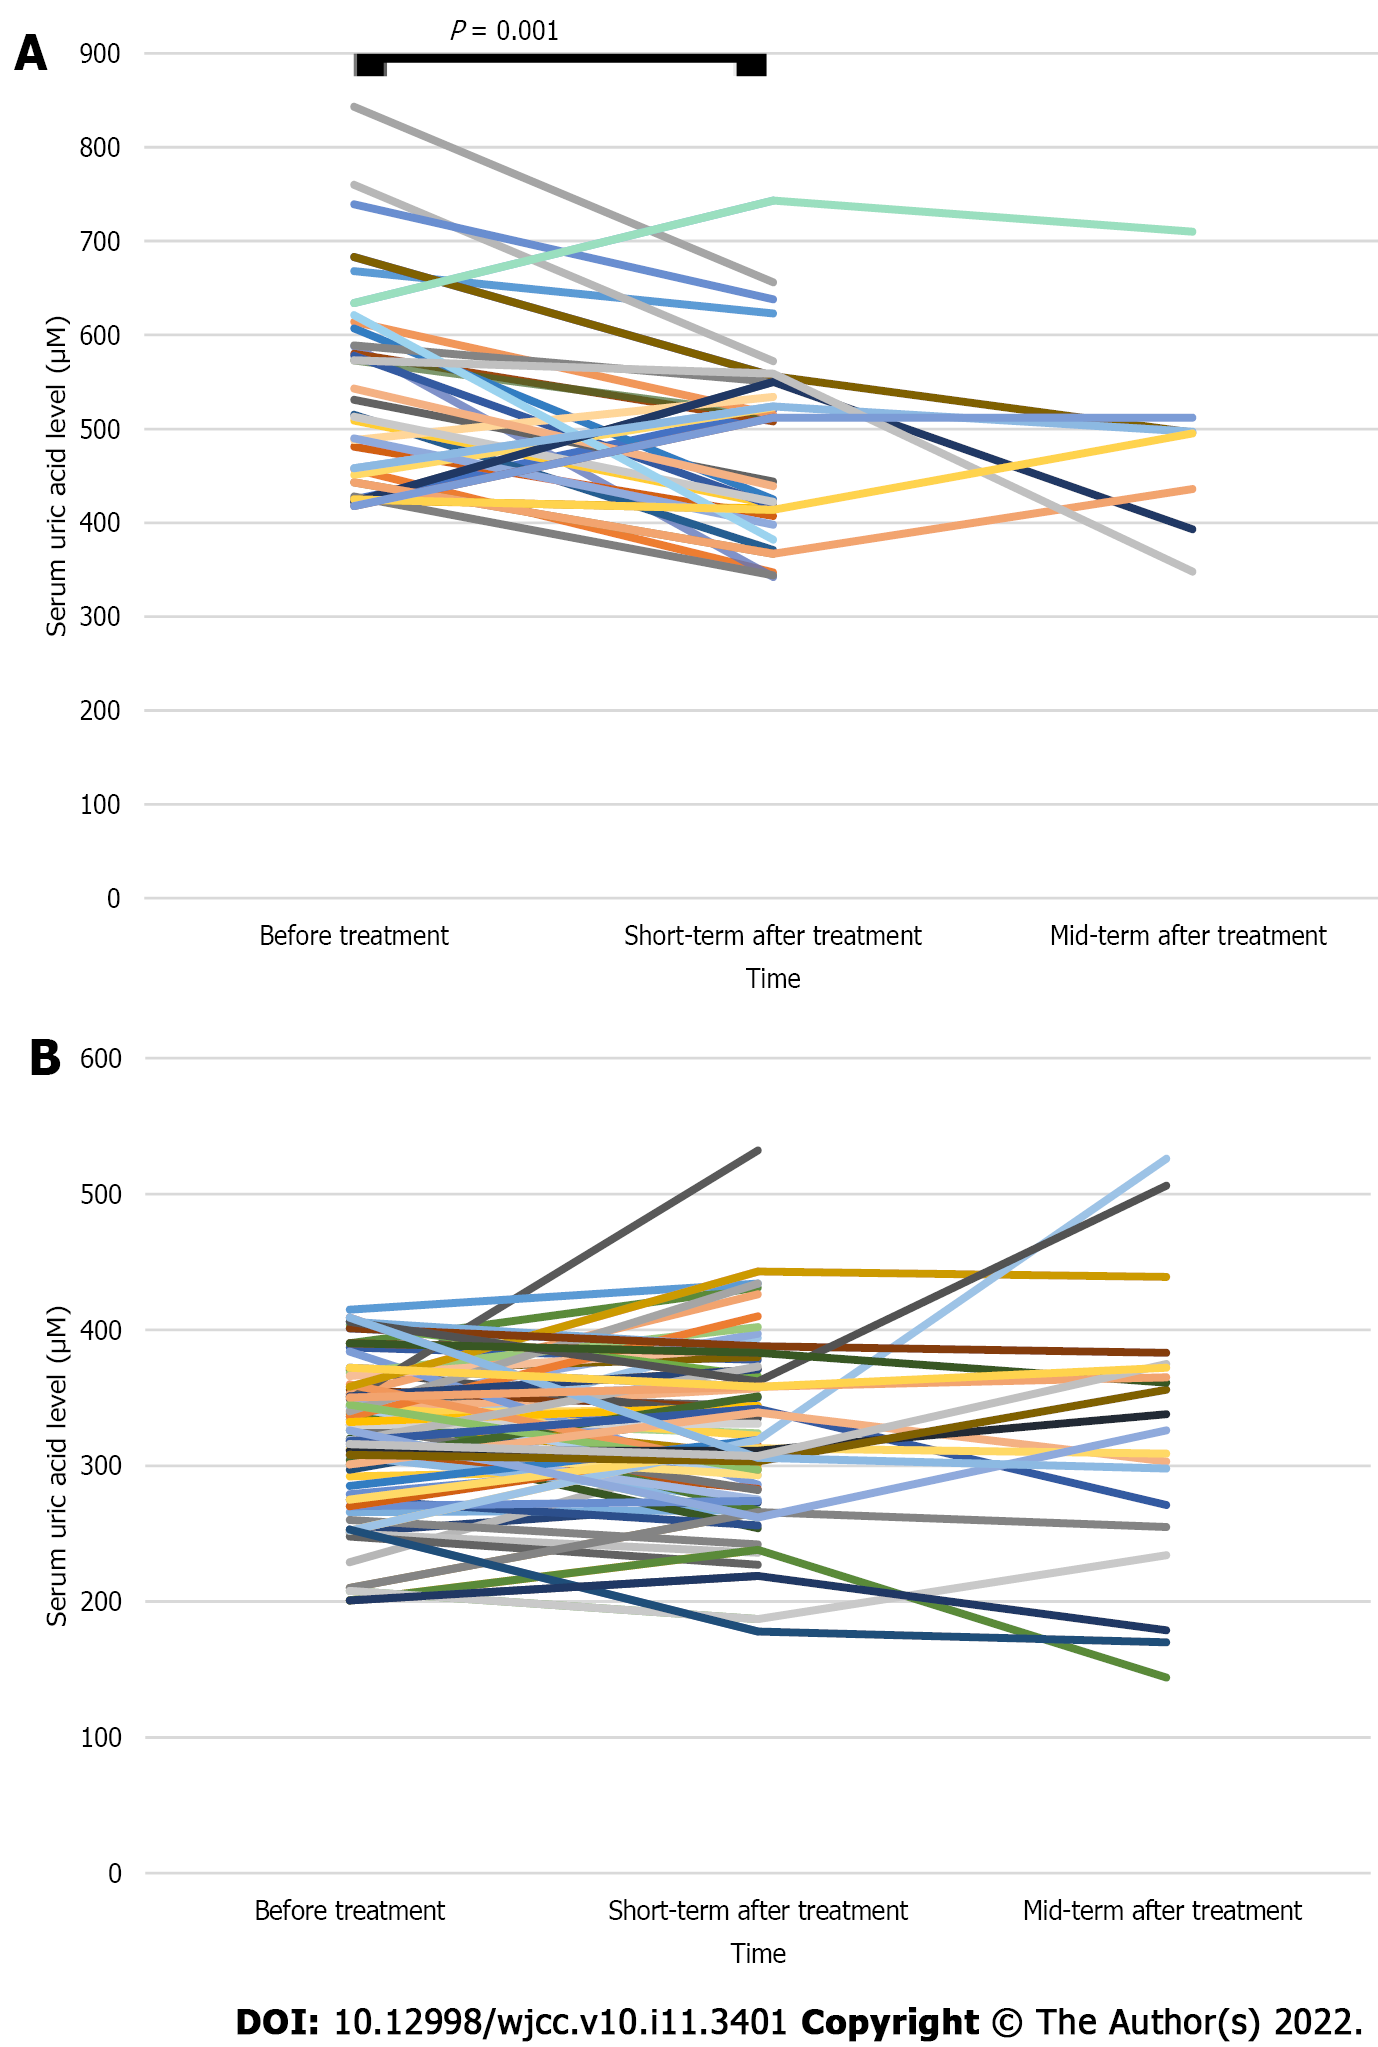
Figure 2 Changes in short-term (within 3 mo) and mid-term (within 6 mo) serum uric acid levels.
A: Hyperuricaemia group (n = 32) before and after washed microbiota transplantation (WMT) treatment. Short-term after treatment and before treatment: 481.00 ± 99.85 vs 546.81 ± 109.64 μM, P = 0.001. Mid-term after treatment and before treatment: 483.00 ± 101.21 vs 504.00 ± 100.30, P = 0.596. Short-term after treatment and mid-term after treatment: 485.88 ± 107.80 vs 528.12 ± 111.89, P = 0.276; B: Normal uric acid group (n = 100) before and after WMT treatment. Short-term after treatment and before treatment: 326.62 ± 63.30 vs 322.80 ± 52.00 μM, P = 0.500. Mid-term after treatment and before treatment: 325.50 ± 101.03 vs 308.30 ± 70.28, P = 0.350. Short-term after treatment and mid-term after treatment: 325.50 ± 101.03 vs 309.10 ± 68.32, P = 0.301.
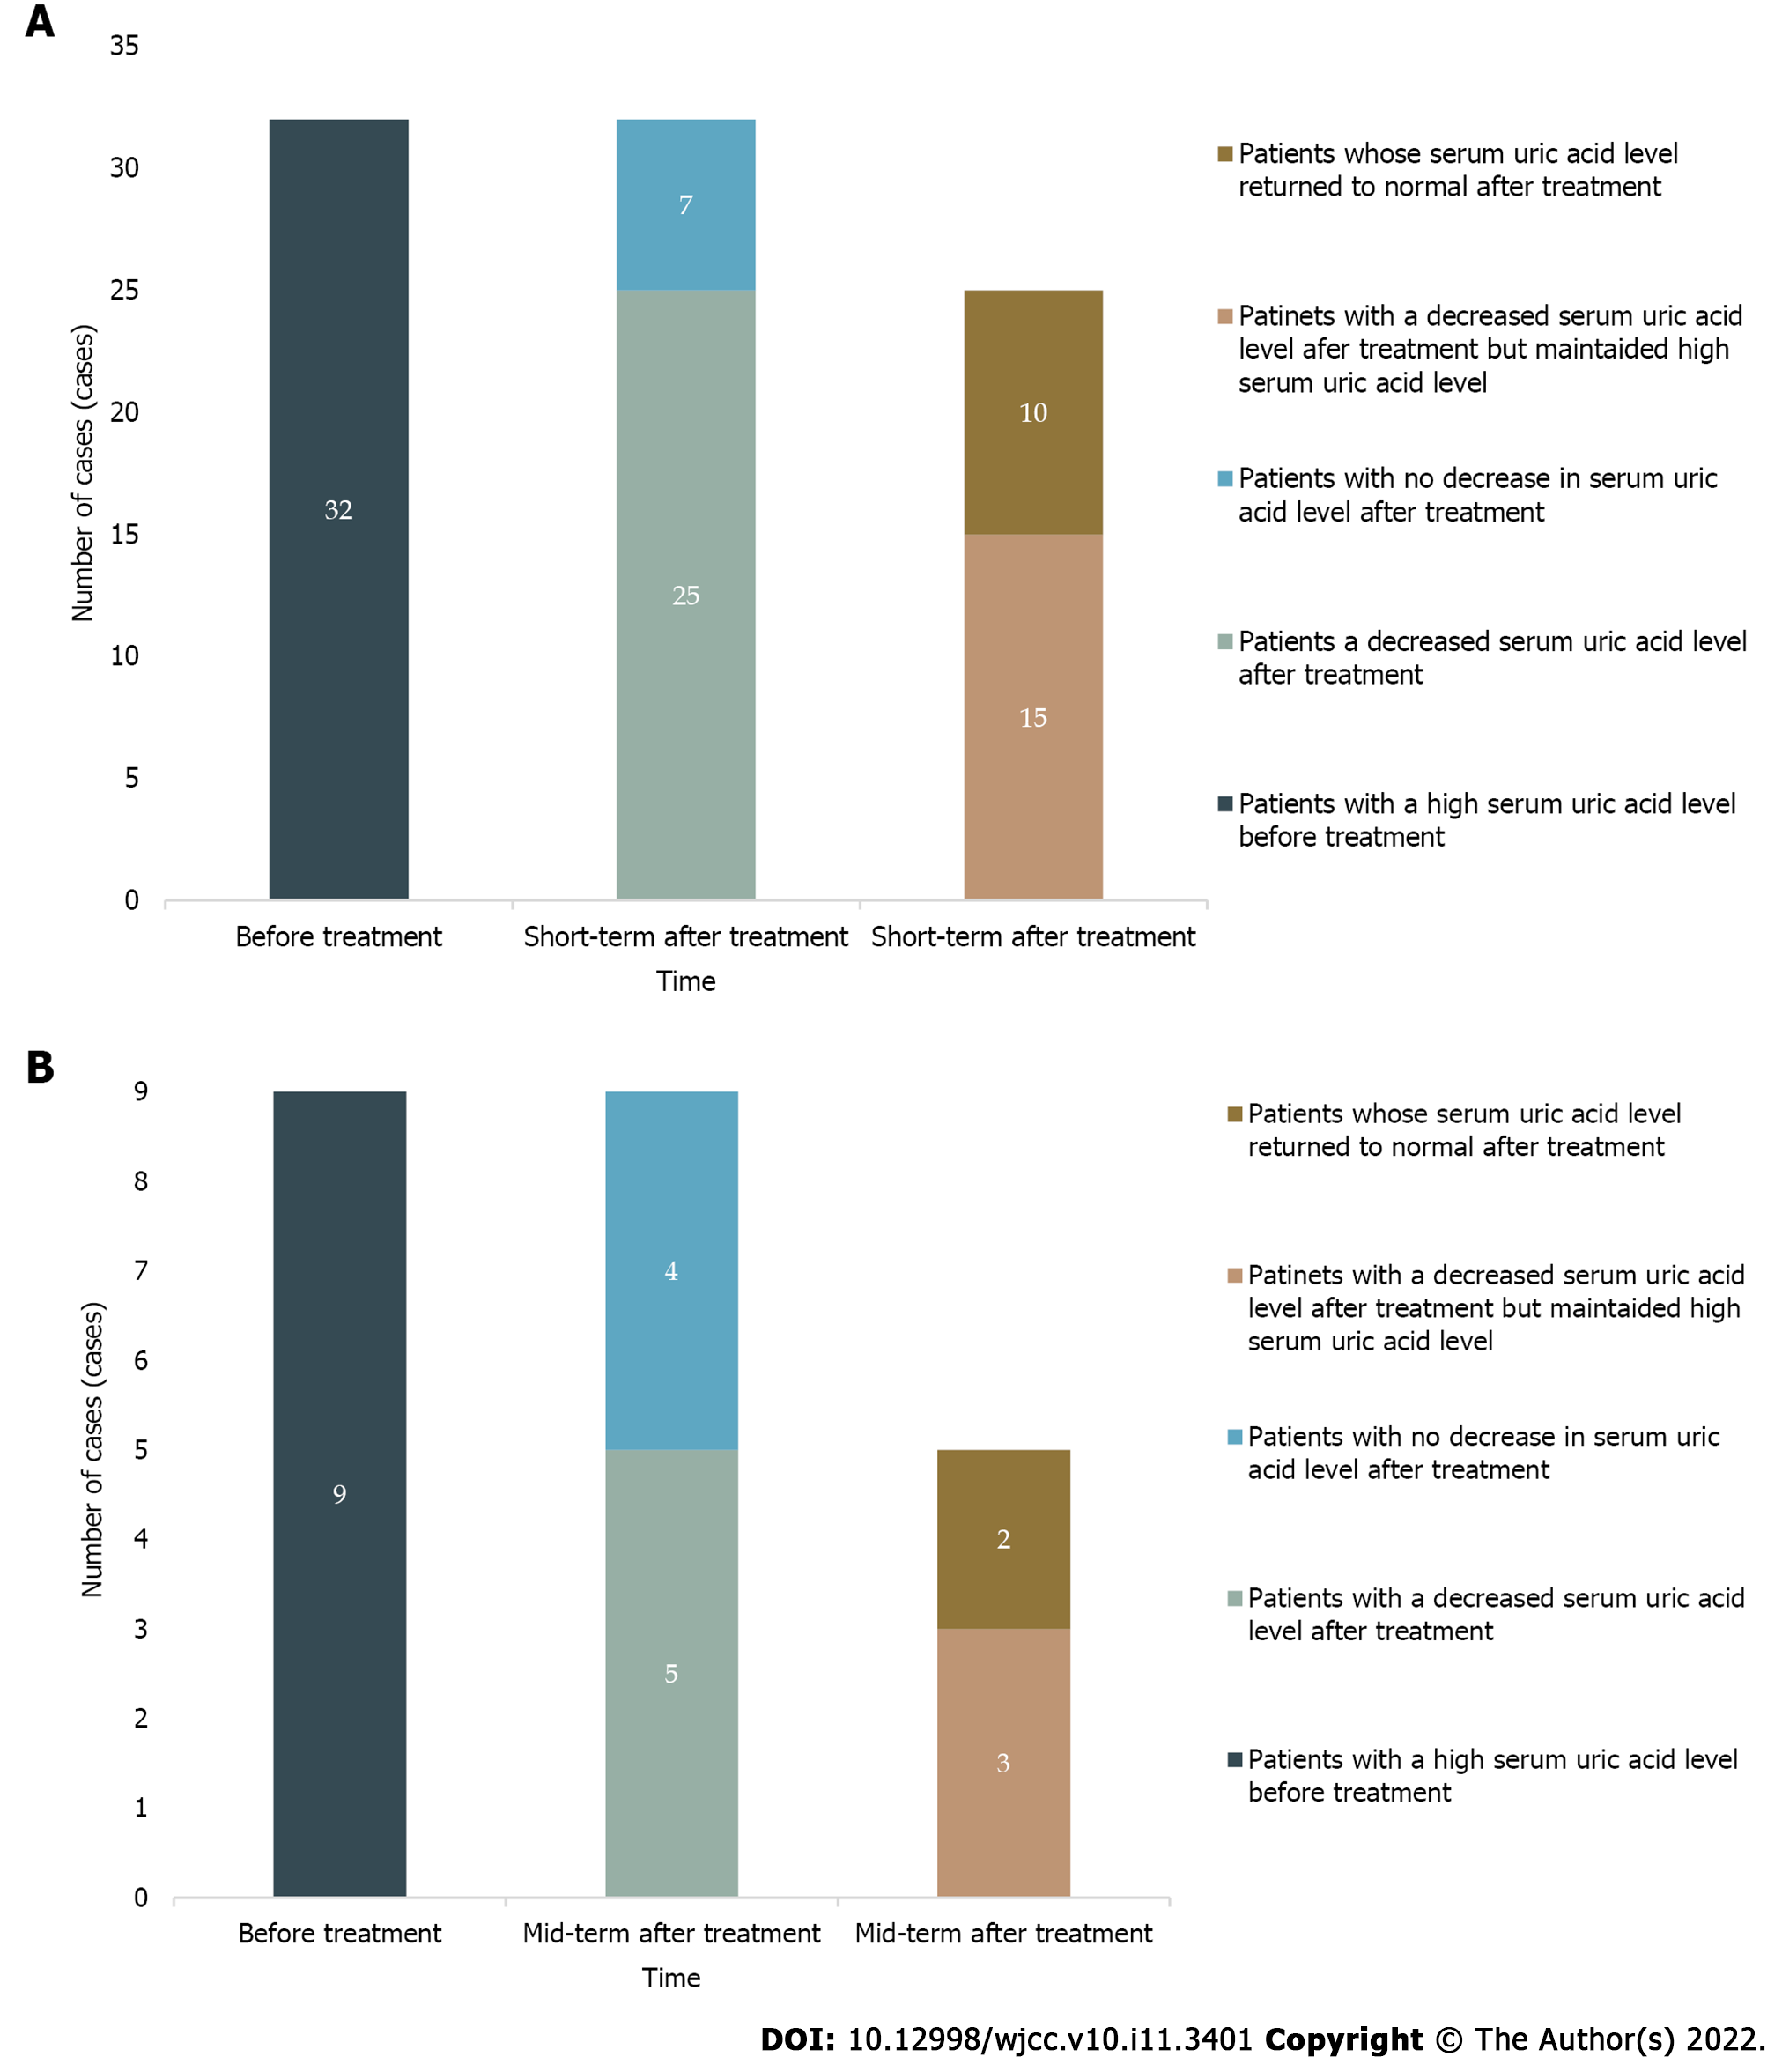
Figure 3 The number of cases serum uric acid level reduction after washed microbiota transplantation treatment in the hyperuricaemia group.
A: The number of cases with short-term (within 3 mo) serum uric acid level reduction after washed microbiota transplantation (WMT) treatment in the hyperuricaemia (HUA) group; B: The number of cases with mid-term (within 6 mo) serum uric acid level reduction after WMT treatment in the HUA group.
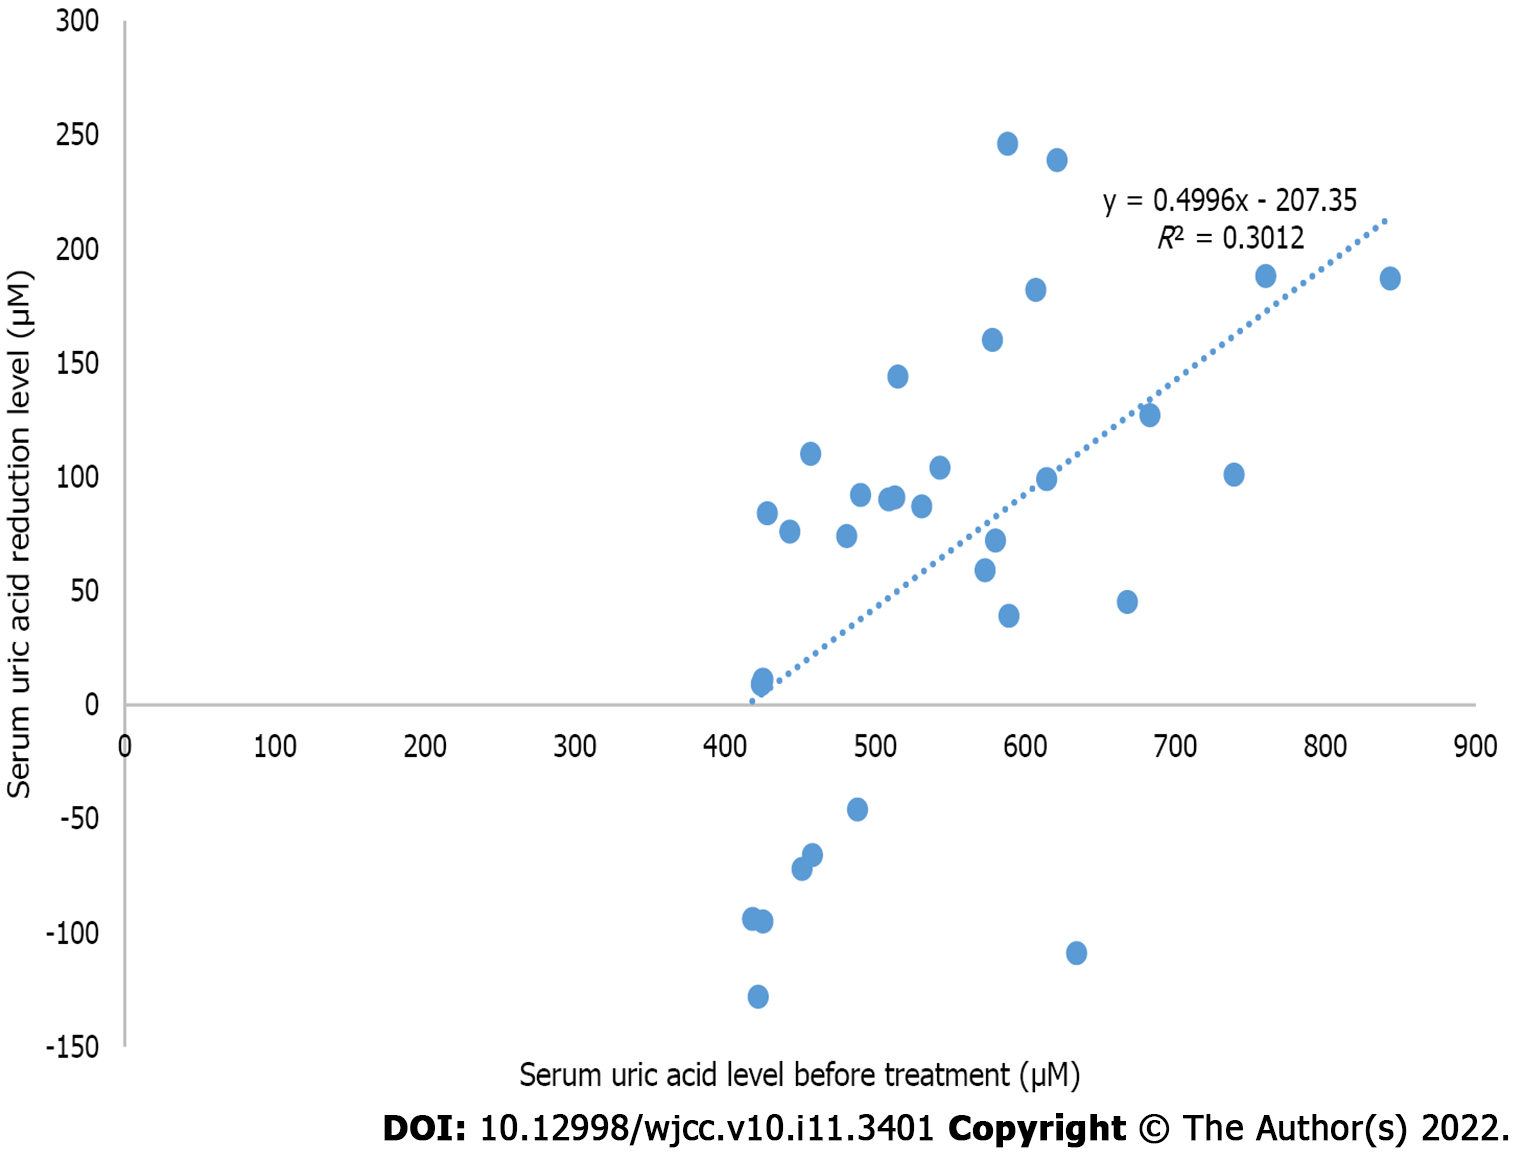
Figure 4 The linear relationship between the short-term (within 3 mo) uric acid reduction level after washed microbiota transplantation treatment and the serum uric acid level before treatment in the hyperuricaemia group (n = 32).
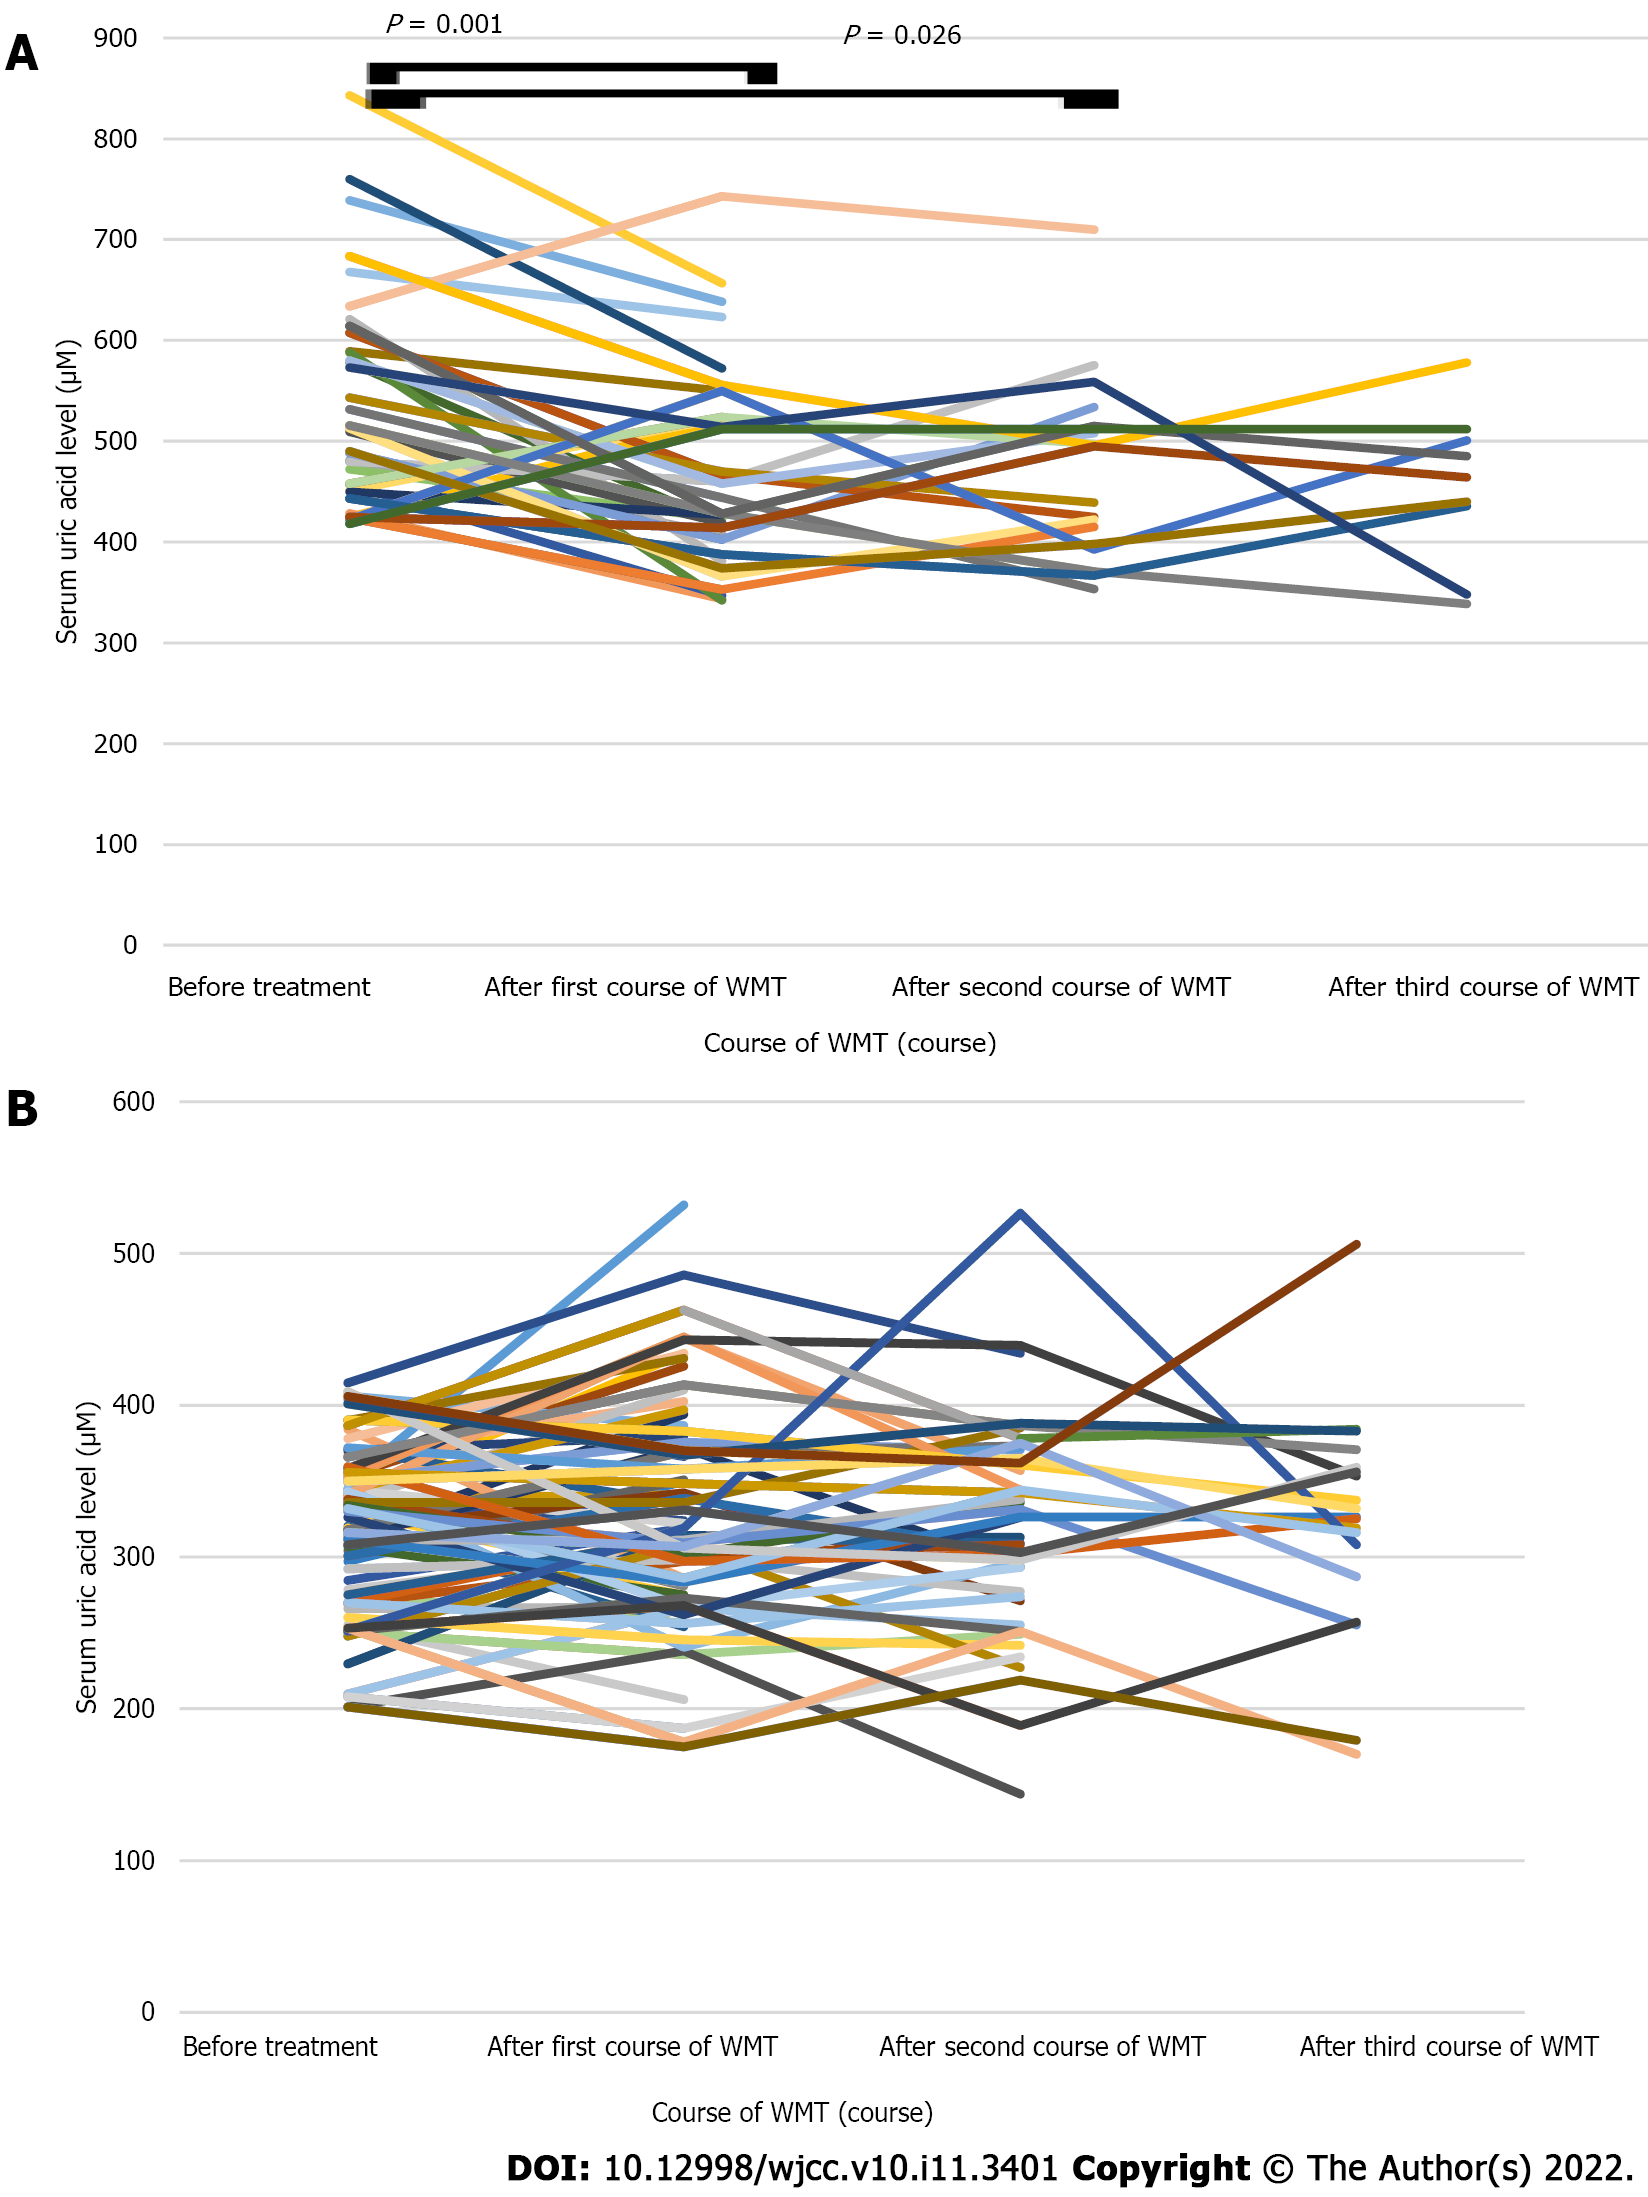
Figure 5 Changes in the serum uric acid level before and after different courses of washed microbiota transplantation.
A: Hyperuricaemia group (n = 44). After the first course of washed microbiota transplantation (WMT) and before treatment: 469.74 ± 97.68 vs 540.00 ± 107.16, P = 0.001. After the second course of WMT and before treatment: 465.57 ± 88.88 vs 513.19 ± 78.14, P = 0.026. After the third course of WMT and before treatment: 417.36 ± 92.84 vs 526.73 ± 111.30, P = 0.101; B: Normal uric acid group (n = 100). After the first course of WMT and before treatment: 328.86 ± 71.91 vs 320.55 ± 52.73, P = 0.184. After the second course of WMT and before treatment: 323.18 ± 68.06 vs 317.29 ± 57.44, P = 0.442. After the third course of WMT and before treatment: 328.59 ± 73.52 vs 333 ± 55.49, P = 0.628. WMT: Washed microbiota transplantation.
- Citation: Cai JR, Chen XW, He YJ, Wu B, Zhang M, Wu LH. Washed microbiota transplantation reduces serum uric acid levels in patients with hyperuricaemia. World J Clin Cases 2022; 10(11): 3401-3413
- URL: https://www.wjgnet.com/2307-8960/full/v10/i11/3401.htm
- DOI: https://dx.doi.org/10.12998/wjcc.v10.i11.3401


