Copyright
©The Author(s) 2019.
World J Clin Cases. May 26, 2019; 7(10): 1122-1132
Published online May 26, 2019. doi: 10.12998/wjcc.v7.i10.1122
Published online May 26, 2019. doi: 10.12998/wjcc.v7.i10.1122
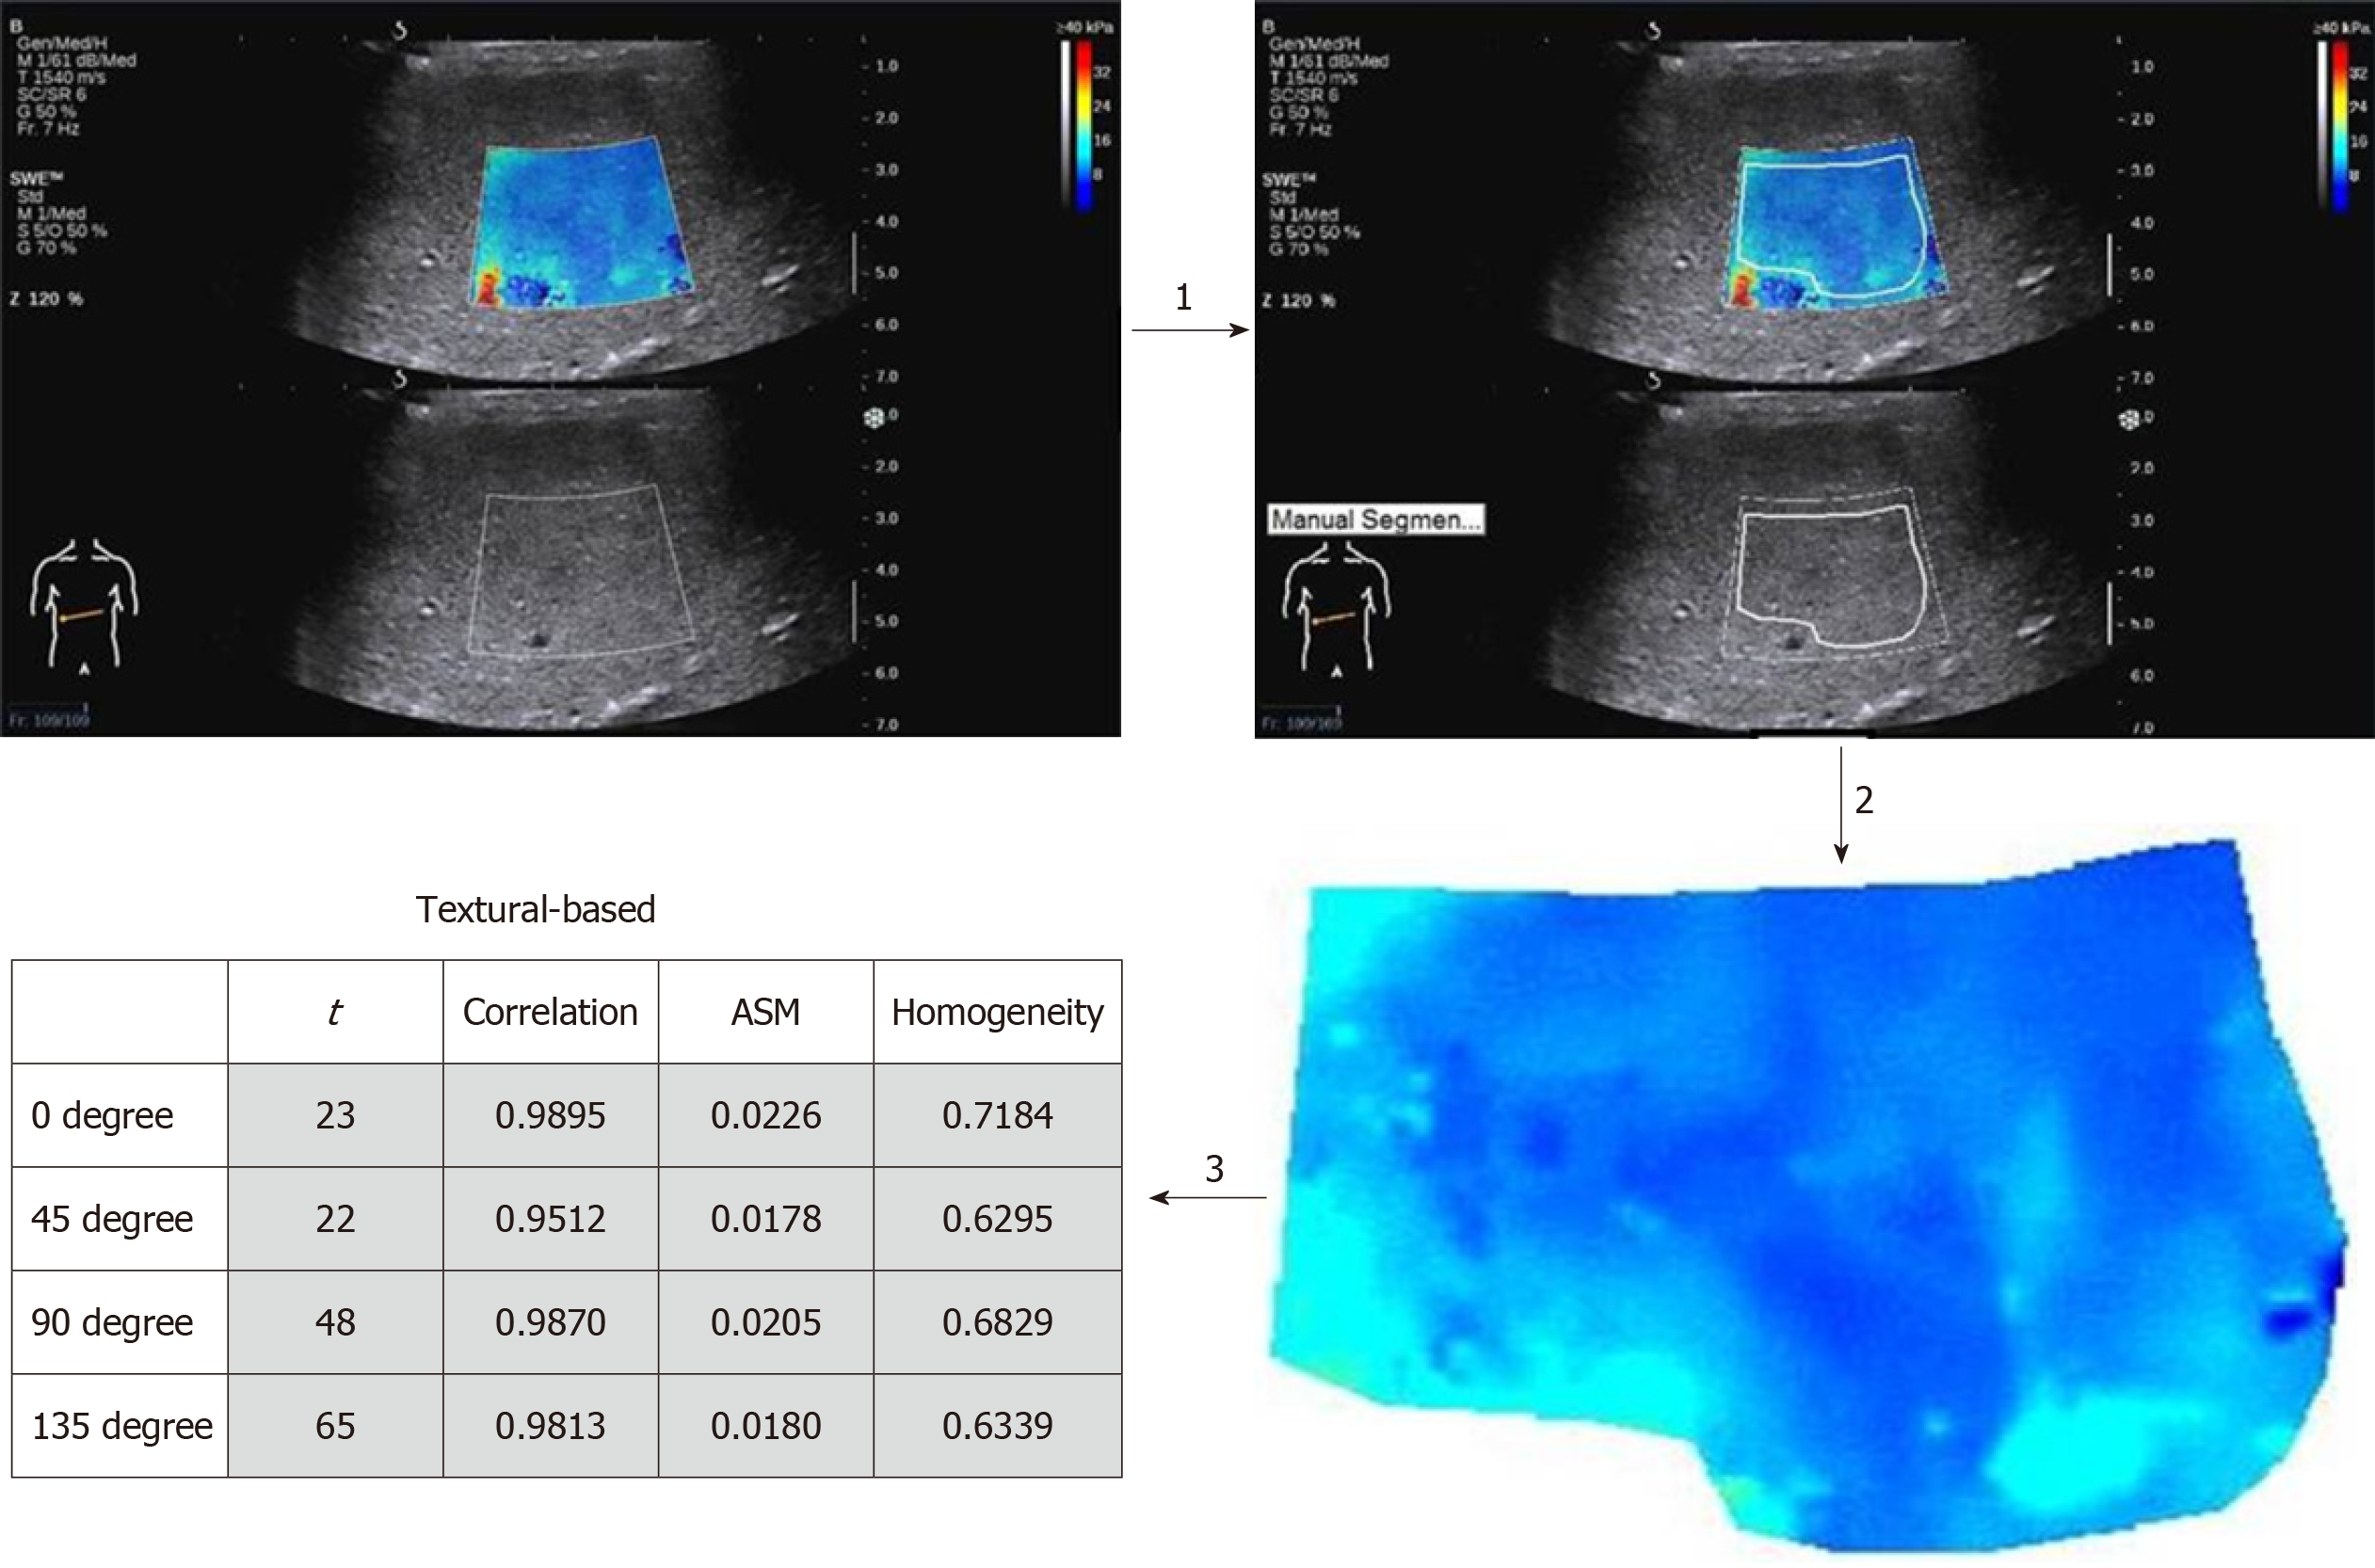
Figure 1 Texture analysis process.
Step 1, texture analysis software was used to delineate the filling area (without filling defect area) on the raw elastic image, avoiding vascular and biliary cavities. Step 2, a texture analysis image was generated. Step 3, 4 sets of indexes were acquired from 4 different angles (0o, 45o, 135o, and 180o), including contrast, correlation, angular second moment, and homogeneity. ASM: Angular second moment.
- Citation: Jian ZC, Long JF, Liu YJ, Hu XD, Liu JB, Shi XQ, Li WS, Qian LX. Diagnostic value of two dimensional shear wave elastography combined with texture analysis in early liver fibrosis. World J Clin Cases 2019; 7(10): 1122-1132
- URL: https://www.wjgnet.com/2307-8960/full/v7/i10/1122.htm
- DOI: https://dx.doi.org/10.12998/wjcc.v7.i10.1122


