Copyright
©The Author(s) 2021.
World J Clin Cases. Nov 26, 2021; 9(33): 10222-10232
Published online Nov 26, 2021. doi: 10.12998/wjcc.v9.i33.10222
Published online Nov 26, 2021. doi: 10.12998/wjcc.v9.i33.10222
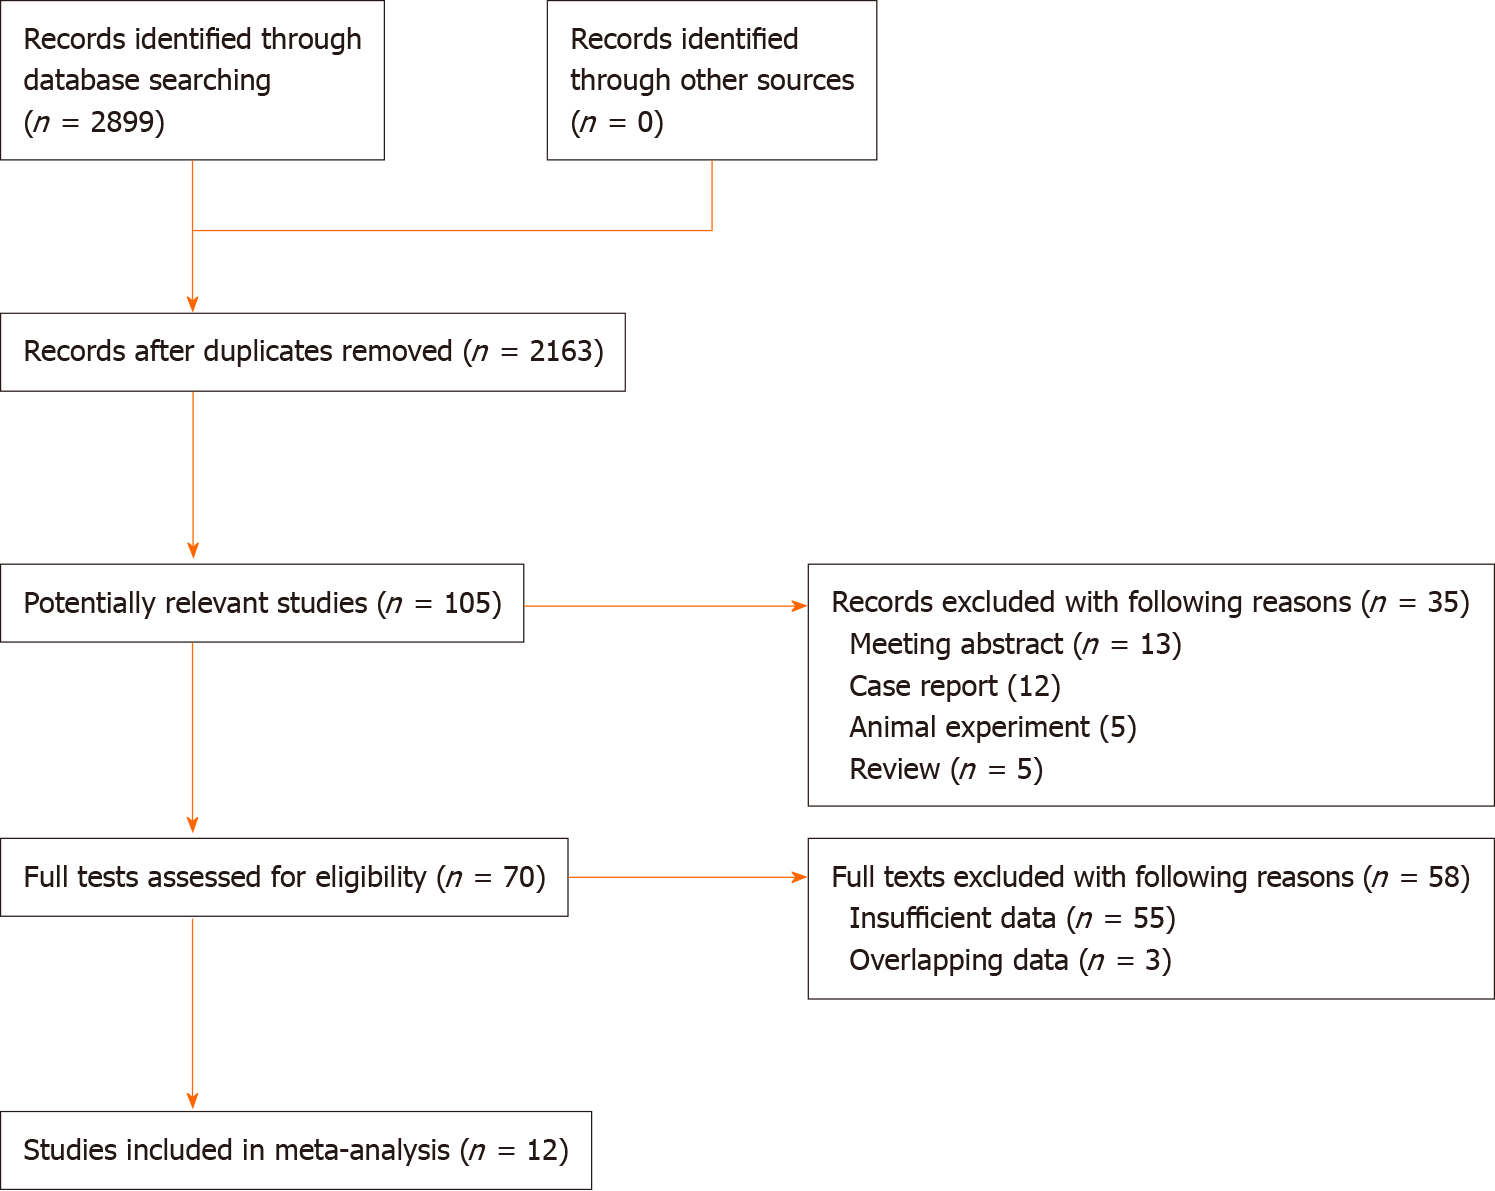
Figure 1
Flow diagram of this meta-analysis.
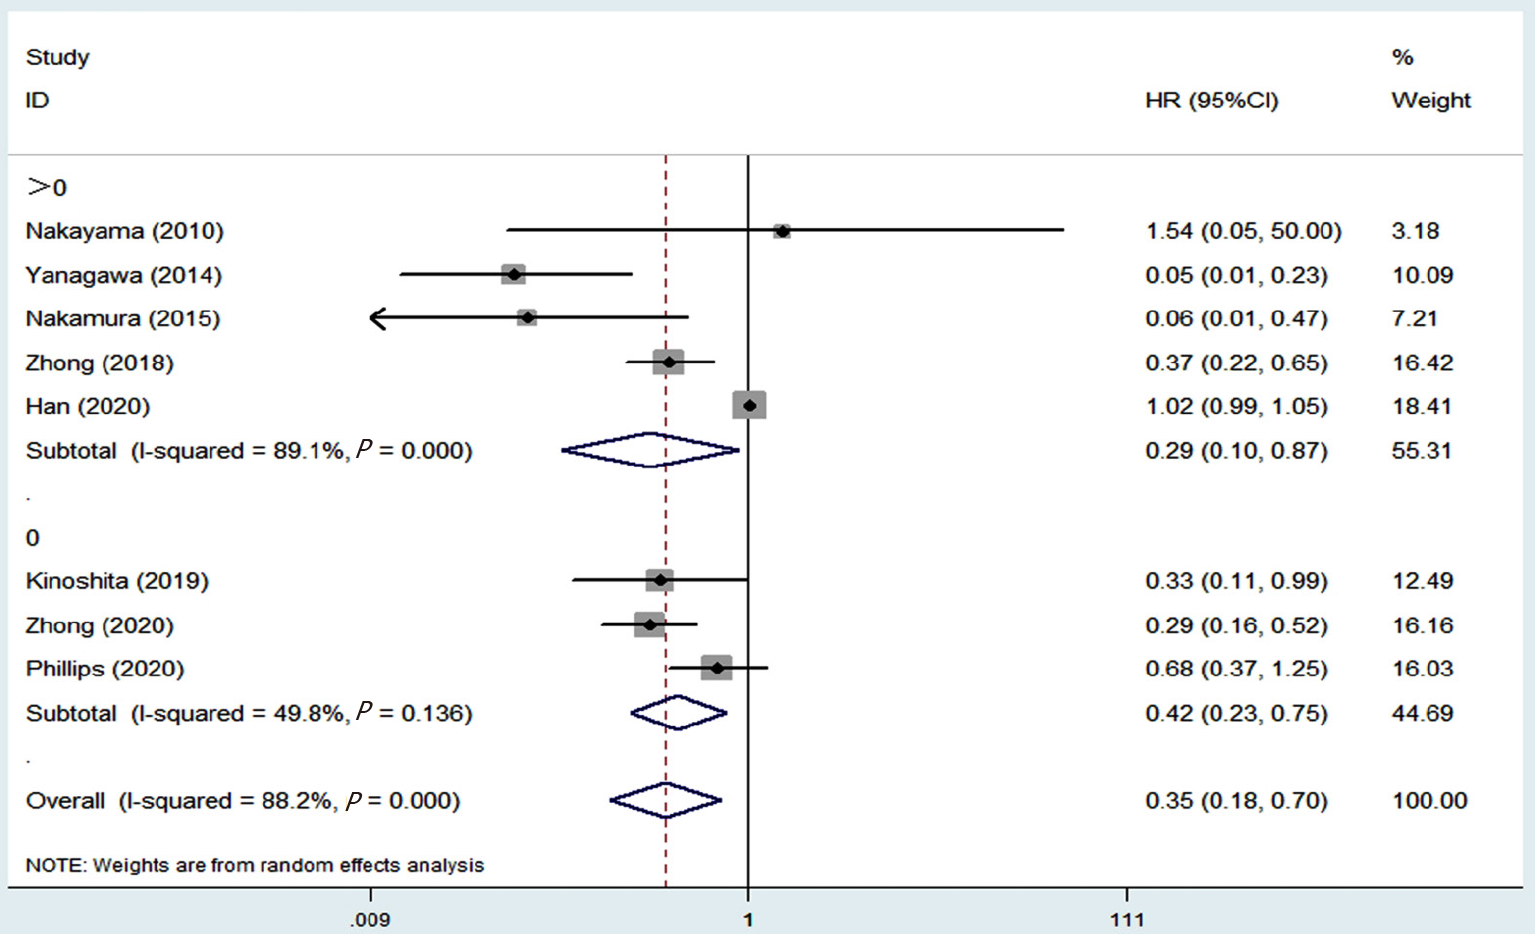
Figure 2 Funnel plot for the association between the presence of ground glass opacity on computed tomography and overall survival of stage I pulmonary adenocarcinoma patients.
HR: Hazard ratio; CI: Confidence interval.
Figure 3 Funnel plot of subgroup analysis based on the ratio of ground glass opacity for the association between the presence of ground glass opacity on computed tomography and overall survival in stage I pulmonary adenocarcinoma patients.
HR: Hazard ratio; CI: Confidence interval.
Figure 4 Funnel plot for the association between the presence of ground glass opacity on computed tomography and disease-free survival of stage I pulmonary adenocarcinoma patients.
HR: Hazard ratio; CI: Confidence interval.
Figure 5 Funnel plot of subgroup analysis based on the ratio of ground glass opacity for the association between the presence of ground glass opacity on computed tomography and disease-free survival in stage I pulmonary adenocarcinoma patients.
HR: Hazard ratio; Confidence interval.
Figure 6 Sensitivity analysis.
A: The association between the presence of ground glass opacity on computed tomography and overall survival in stage I pulmonary adenocarcinoma patients; B: The association between the presence of ground glass opacity on computed tomography and disease-free survival in stage I pulmonary adenocarcinoma patients. CI: Confidence interval.
- Citation: Pan XL, Liao ZL, Yao H, Yan WJ, Wen DY, Wang Y, Li ZL. Prognostic value of ground glass opacity on computed tomography in pathological stage I pulmonary adenocarcinoma: A meta-analysis. World J Clin Cases 2021; 9(33): 10222-10232
- URL: https://www.wjgnet.com/2307-8960/full/v9/i33/10222.htm
- DOI: https://dx.doi.org/10.12998/wjcc.v9.i33.10222


