Copyright
©The Author(s) 2021.
World J Clin Cases. Oct 16, 2021; 9(29): 8749-8762
Published online Oct 16, 2021. doi: 10.12998/wjcc.v9.i29.8749
Published online Oct 16, 2021. doi: 10.12998/wjcc.v9.i29.8749
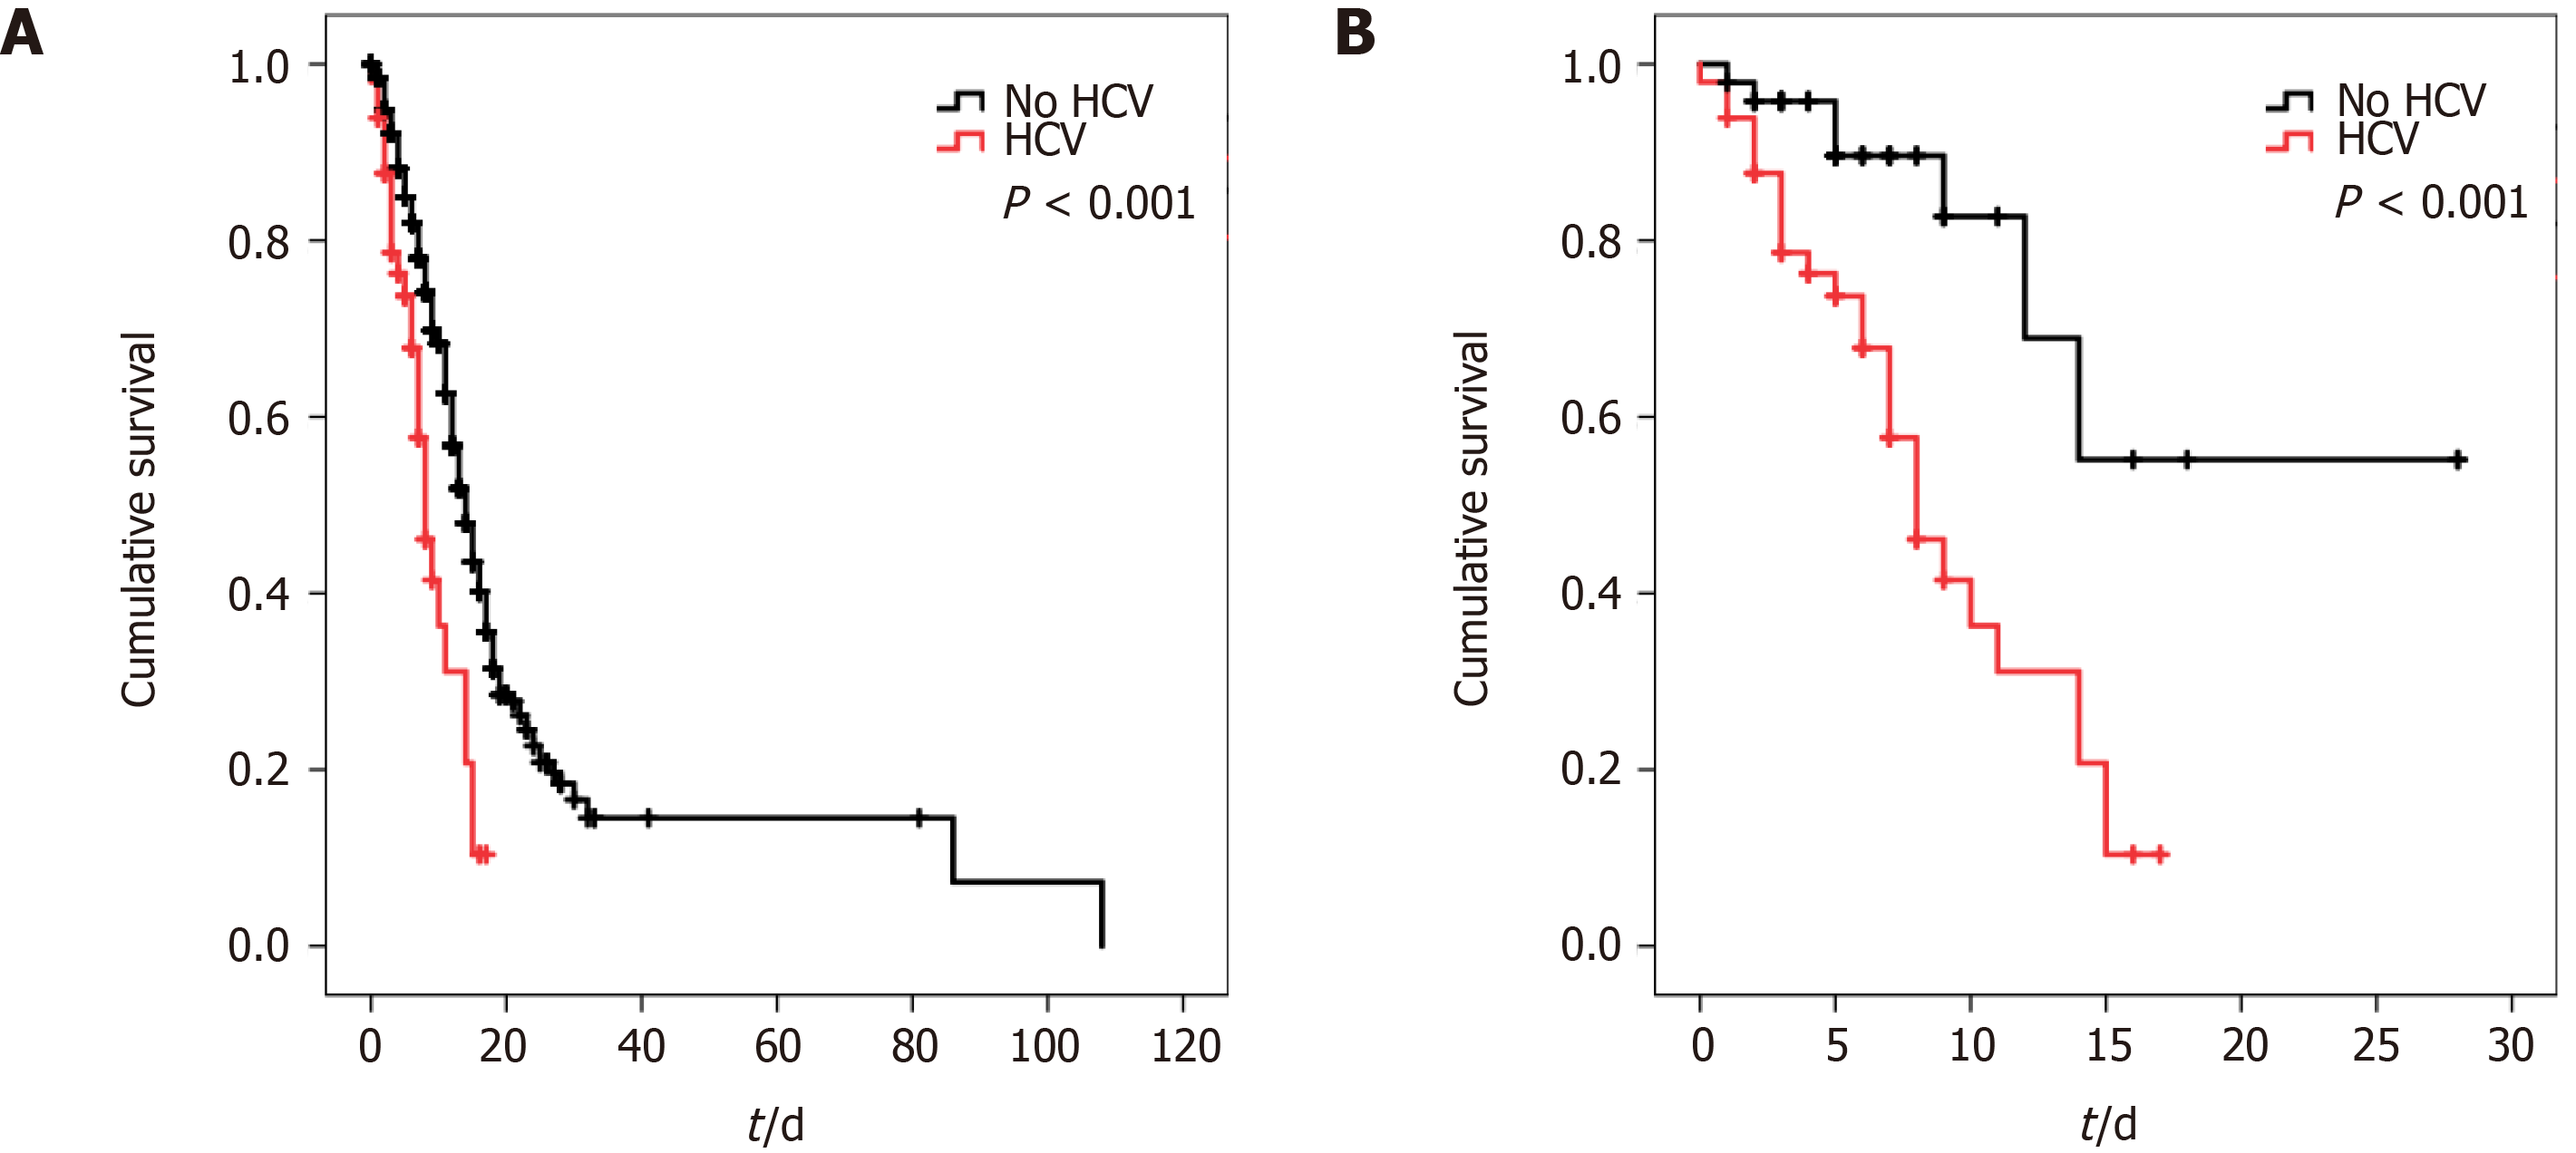
Figure 1 Kaplan-Myer curves for in-hospital survival in patients with and without hepatitis C virus.
A: In the overall study group; B: After propensity score matching. HCV: Hepatitis C virus.
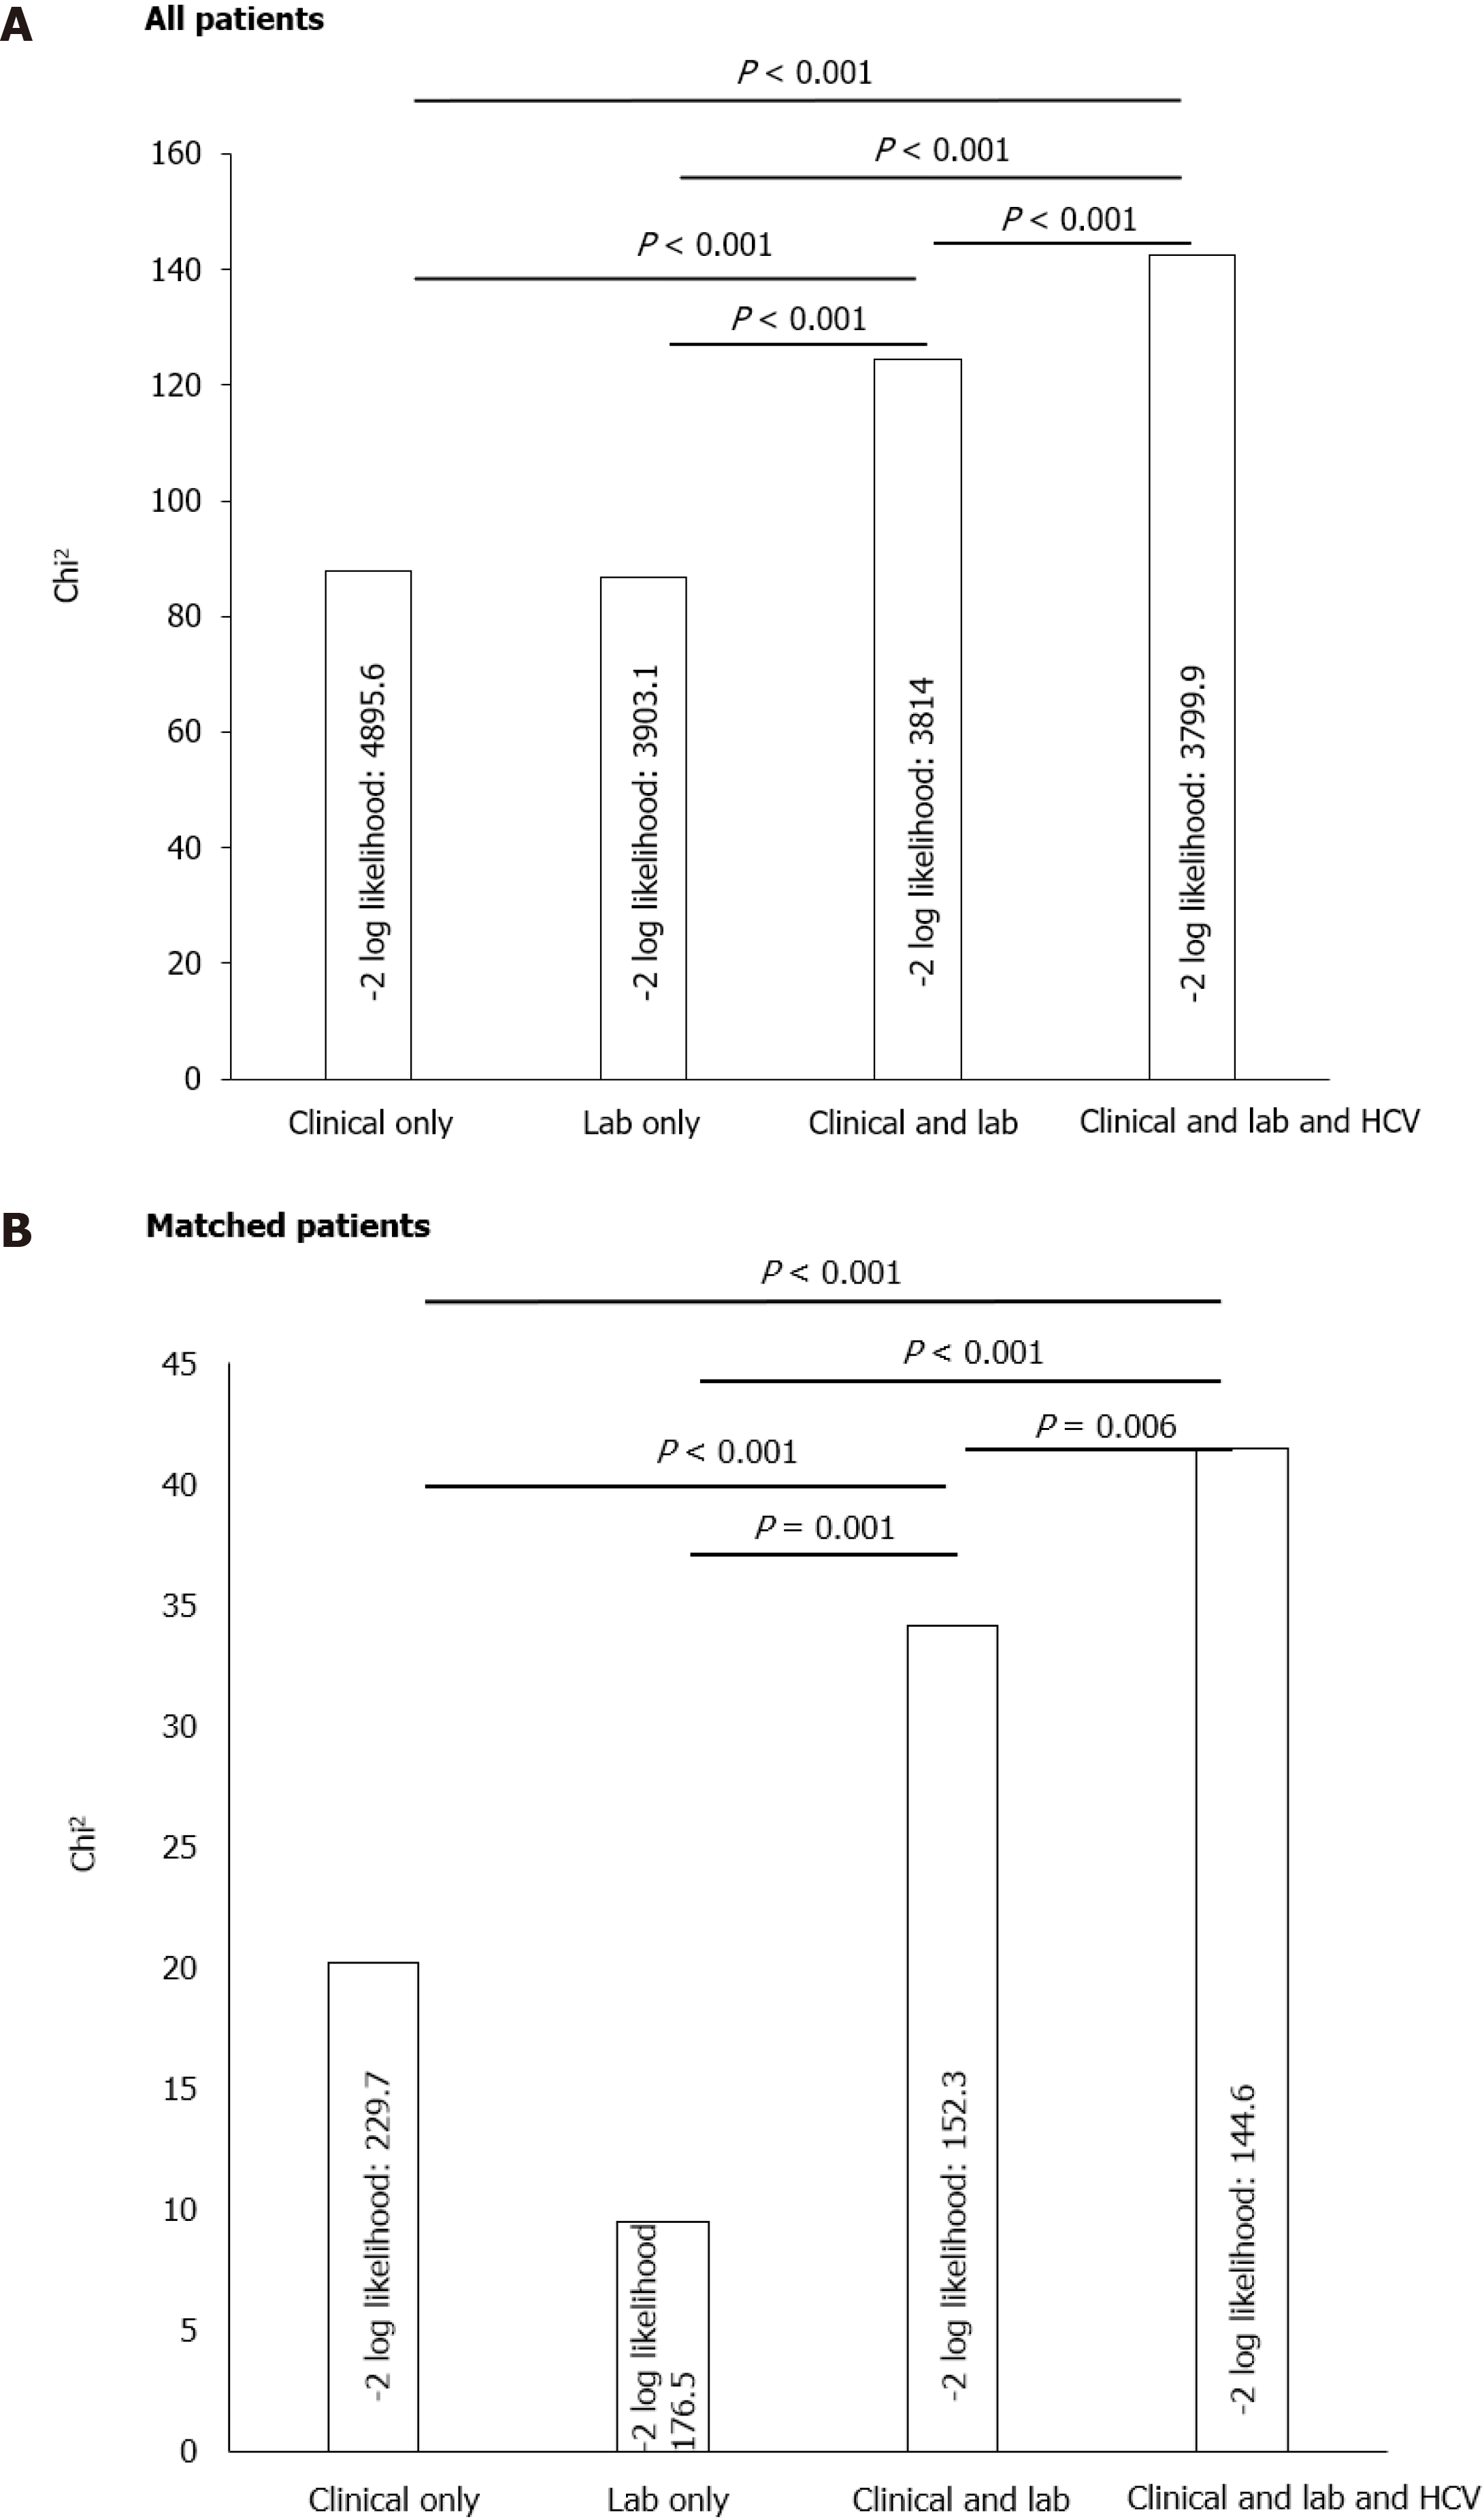
Figure 2 Comparison between different models for prediction of coronavirus disease 2019 associated in-hospital mortality.
Comparisons were done using the -2-log likelihood ratio. The first model (clinical model) consisted of clinical parameters (age, sex, hypertension, diabetes mellitus, history of respiratory disease, and history of cardiac disease). The second model (laboratory model) consisted of laboratory values (D-dimer, lactate dehydrogenase, high sensitivity C-reactive protein, and serum creatinine). The third model was a combined clinical and laboratory model, and the fourth model was the combined model with the addition of history of hepatitis C virus. A: In the overall study group; B: After propensity score matching. HCV: Hepatitis C virus.
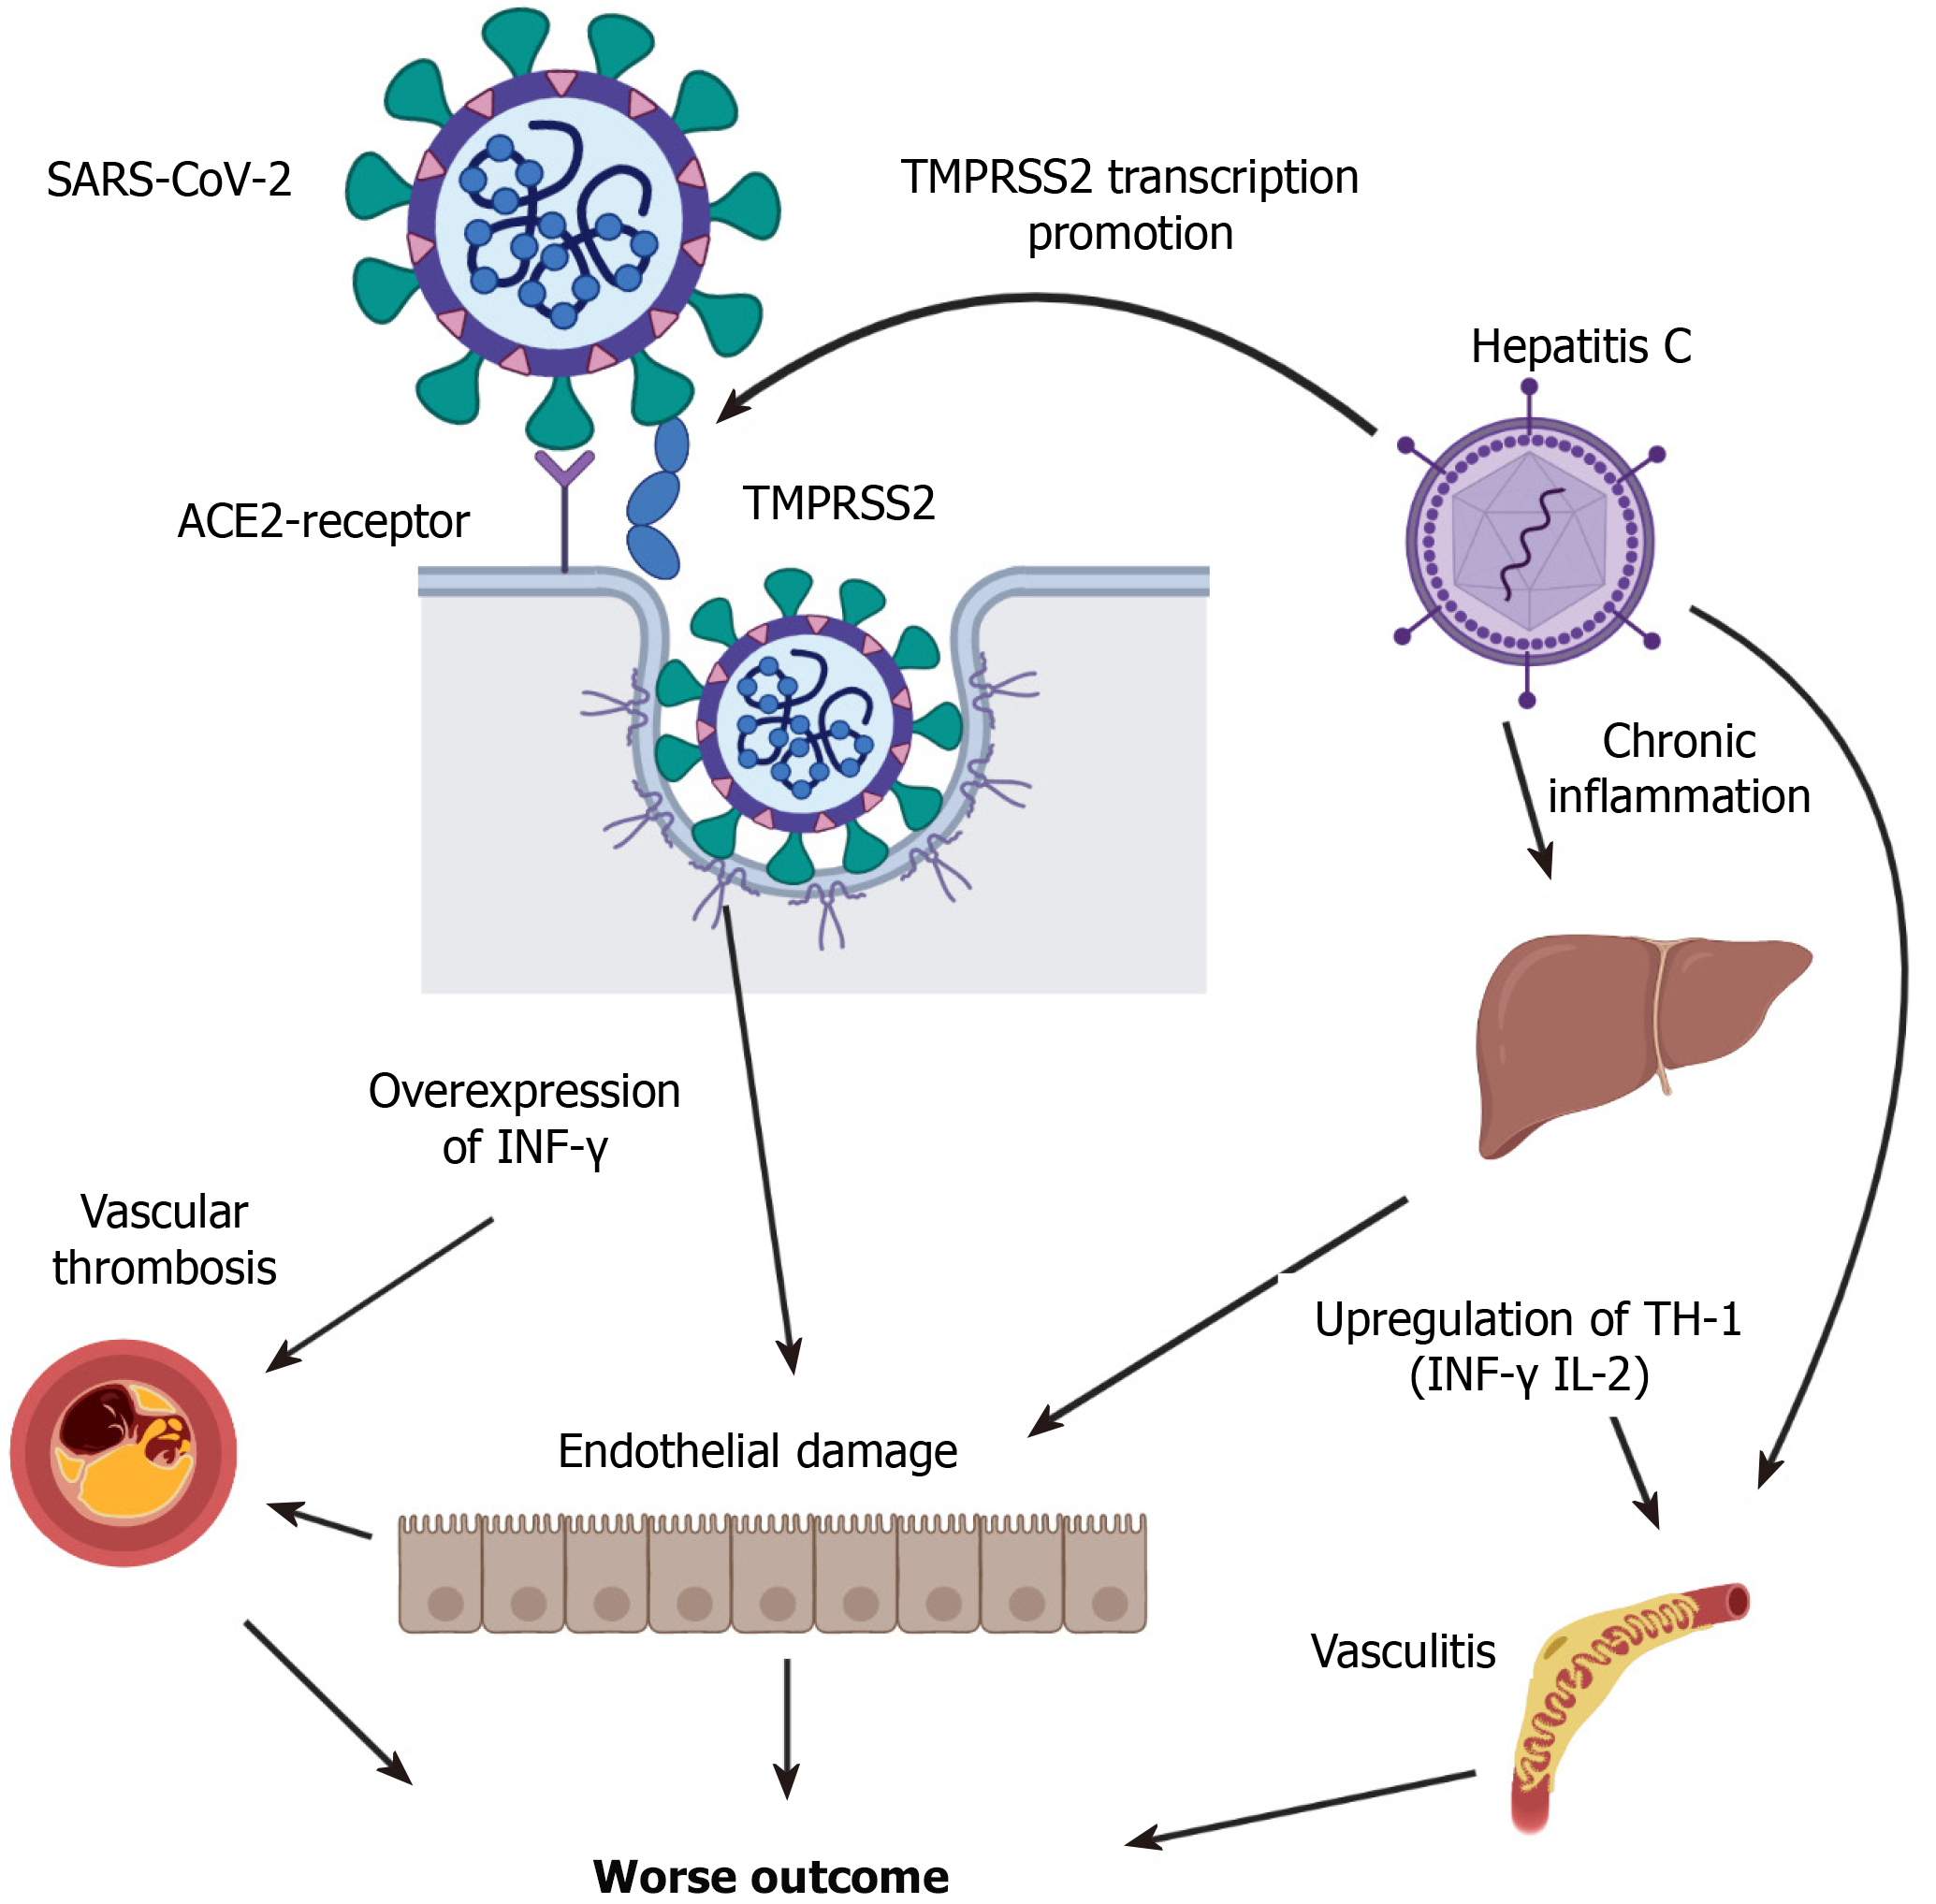
Figure 3 Relationship between Chronic hepatitis C and severe acute respiratory syndrome coronavirus 2 physiopathology.
Postulation of 4 possible mechanisms involved. SARS-CoV2: Severe acute respiratory syndrome coronavirus 2; TMPRSS2: Transmembrane protease serine 2.
- Citation: Ronderos D, Omar AMS, Abbas H, Makker J, Baiomi A, Sun H, Mantri N, Choi Y, Fortuzi K, Shin D, Patel H, Chilimuri S. Chronic hepatitis-C infection in COVID-19 patients is associated with in-hospital mortality. World J Clin Cases 2021; 9(29): 8749-8762
- URL: https://www.wjgnet.com/2307-8960/full/v9/i29/8749.htm
- DOI: https://dx.doi.org/10.12998/wjcc.v9.i29.8749


