Copyright
©The Author(s) 2021.
World J Clin Cases. Sep 16, 2021; 9(26): 7762-7771
Published online Sep 16, 2021. doi: 10.12998/wjcc.v9.i26.7762
Published online Sep 16, 2021. doi: 10.12998/wjcc.v9.i26.7762
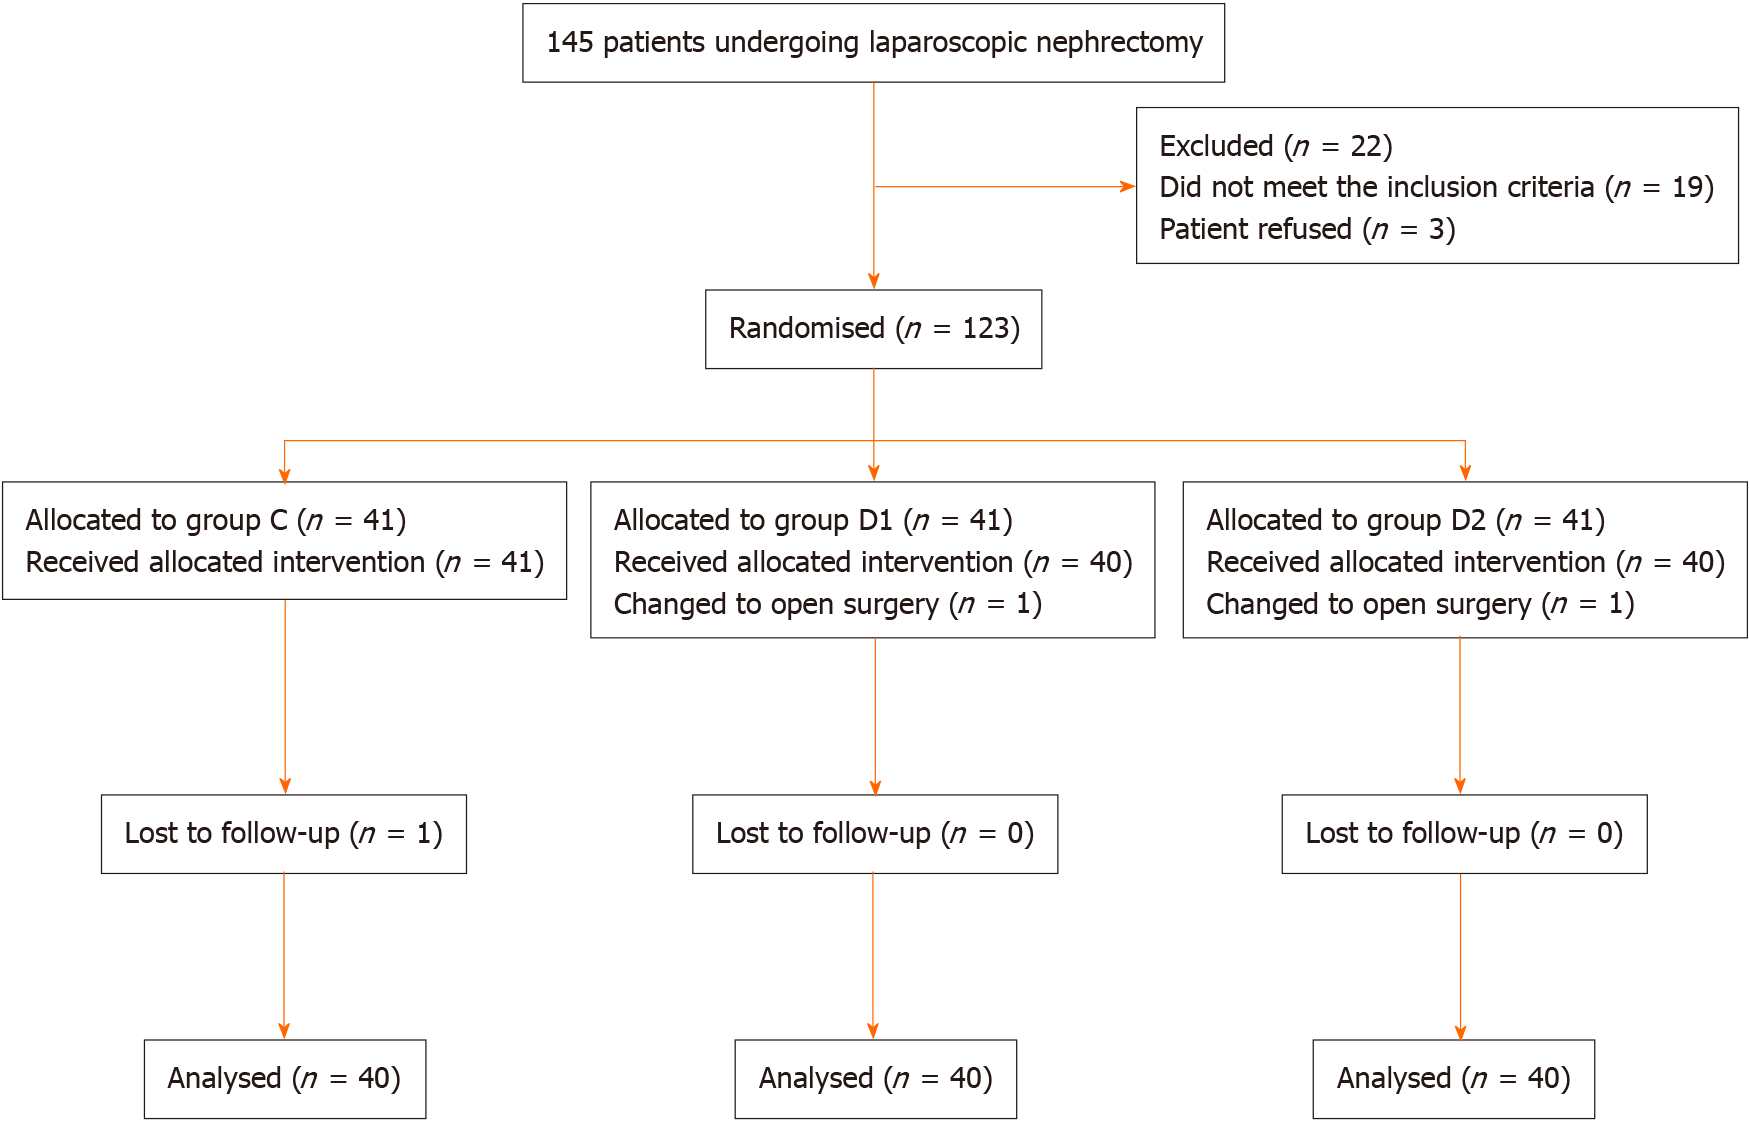
Figure 1 Patient enrolment flow diagram.
This illustrates the flow of all patients screened, excluded, and randomized.
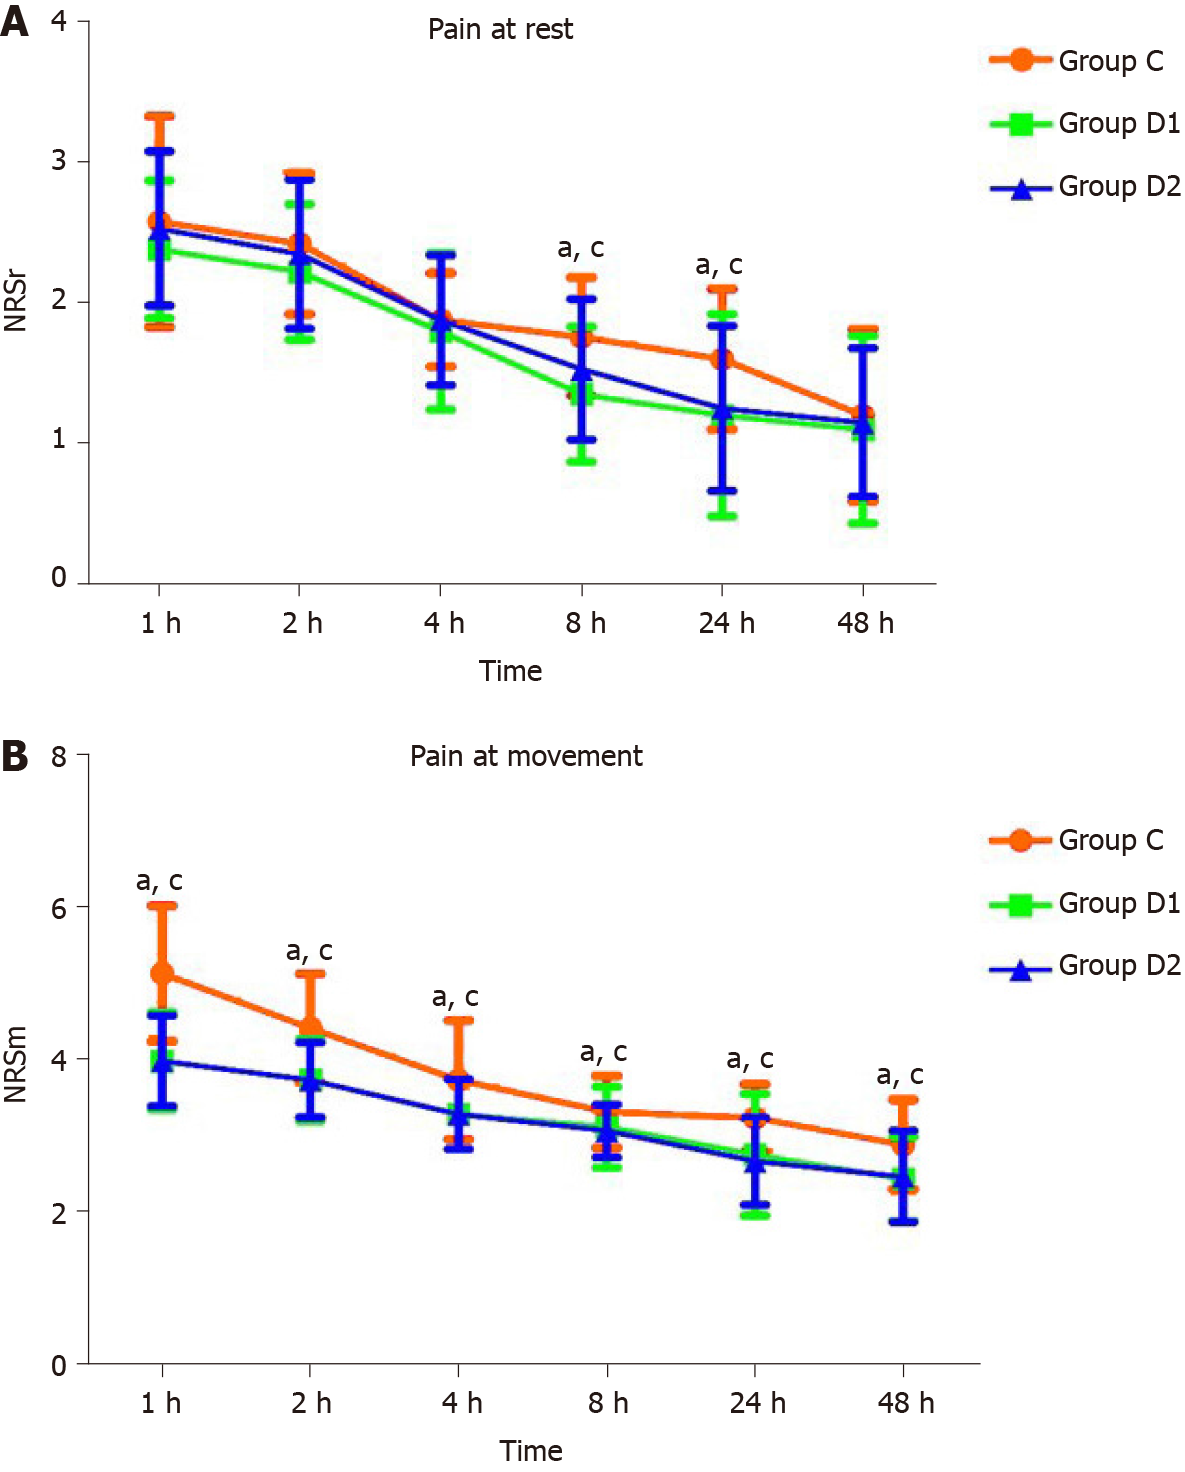
Figure 2 Pain scores during 48 h after surgery in groups C, D1, and D2.
Variables are presented as the mean ± SD. The numerical rating scale scores at 8 h and 24 h were significantly lower in groups D1 and D2 than in group C at rest and at movement. aP < 0.05, group D1 vs group C; cP < 0.05, group D2 vs group C. NRS: Numerical rating scale.
- Citation: Huang SS, Song FX, Yang SZ, Hu S, Zhao LY, Wang SQ, Wu Q, Liu X, Qi F. Impact of intravenous dexmedetomidine on postoperative bowel movement recovery after laparoscopic nephrectomy: A consort-prospective, randomized, controlled trial. World J Clin Cases 2021; 9(26): 7762-7771
- URL: https://www.wjgnet.com/2307-8960/full/v9/i26/7762.htm
- DOI: https://dx.doi.org/10.12998/wjcc.v9.i26.7762


