Copyright
©The Author(s) 2021.
World J Clin Cases. Jul 26, 2021; 9(21): 5932-5942
Published online Jul 26, 2021. doi: 10.12998/wjcc.v9.i21.5932
Published online Jul 26, 2021. doi: 10.12998/wjcc.v9.i21.5932
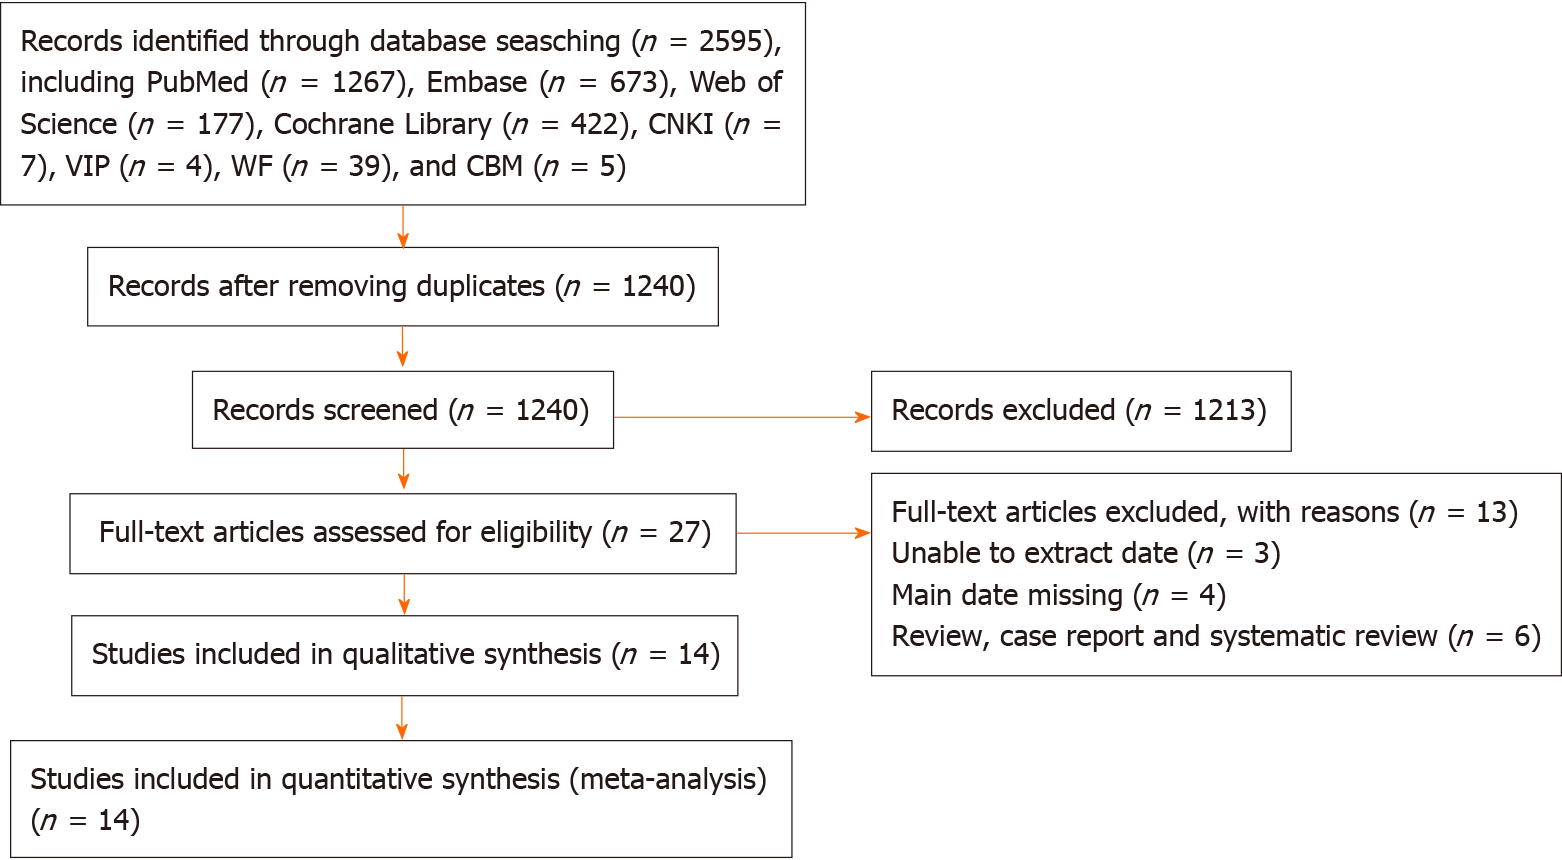
Figure 1 Study selection flow diagram (up to July 2020).
CBM: Chinese Biological Medical database; CNKI: China National Knowledge Infrastructure; VIP: China Science and Technology Journal database; WF: WANFANG DATA database.
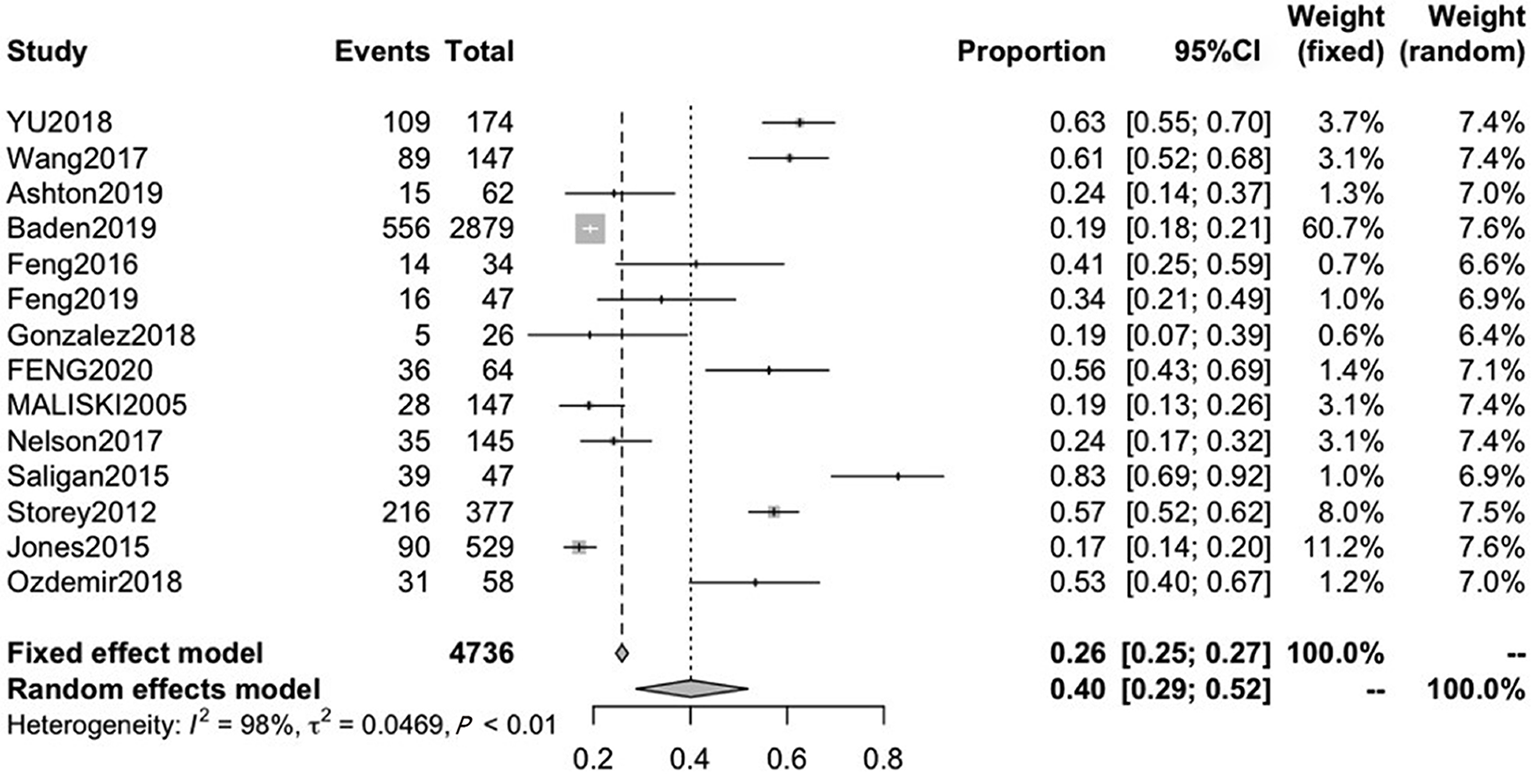
Figure 2 Forest plot of cancer-related fatigue prevalence in prostate cancer patients.
CI: Confidence interval.
Figure 3 Forest plot of the prevalence of cancer-related fatigue in prostate cancer patients treated with androgen deprivation therapy.
CI: Confidence interval.
Figure 4 Forest plot of the prevalence of cancer-related fatigue in prostate cancer patients treated with radical prostatectomy.
CI: Confidence interval.
Figure 5 Forest plot of the prevalence of cancer-related fatigue in prostate cancer patients treated with radiation therapy.
CI: Confidence interval.
Figure 6 Forest plot of acute fatigue prevalence in prostate cancer patients.
CI: Confidence interval.
Figure 7 Forest plot of persistent fatigue prevalence in prostate cancer patients.
CI: Confidence interval.
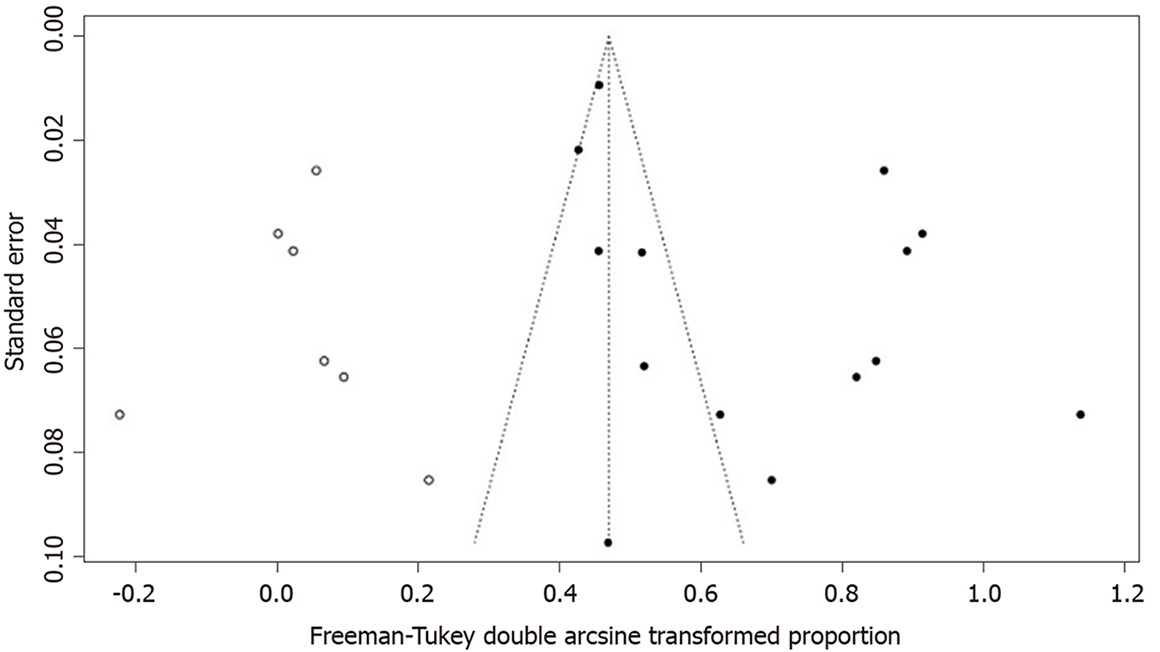
Figure 8
Egger’s funnel plots for testing publication bias.
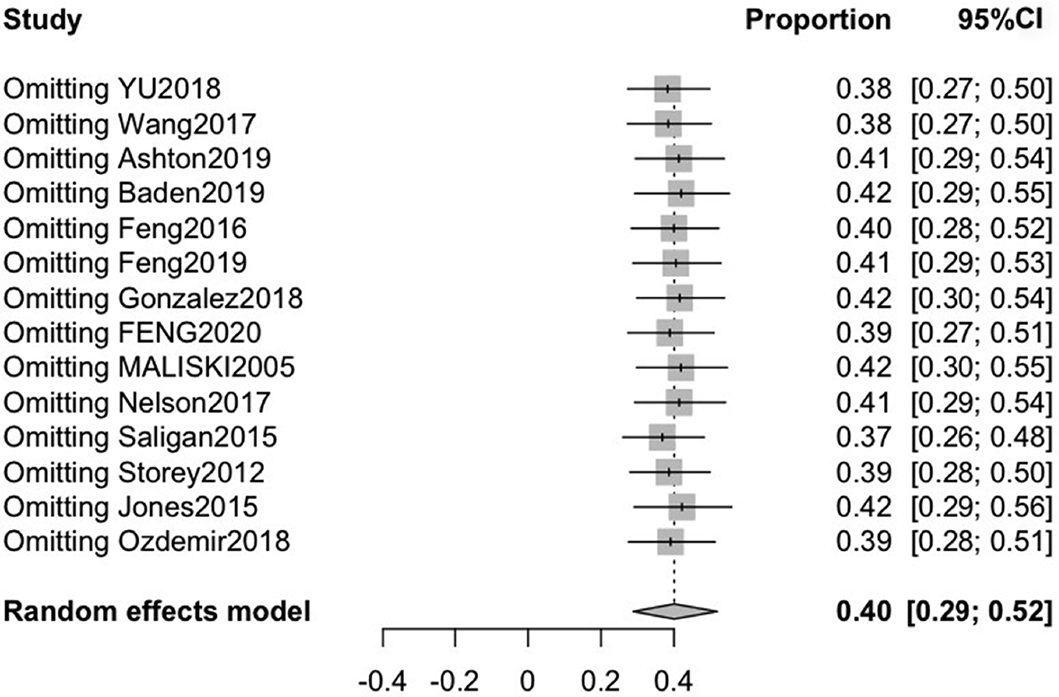
Figure 9 Sensitivity analysis of cancer-related fatigue prevalence in prostate cancer patients in all studies.
CI: Confidence interval.
- Citation: Luo YH, Yang YW, Wu CF, Wang C, Li WJ, Zhang HC. Fatigue prevalence in men treated for prostate cancer: A systematic review and meta-analysis. World J Clin Cases 2021; 9(21): 5932-5942
- URL: https://www.wjgnet.com/2307-8960/full/v9/i21/5932.htm
- DOI: https://dx.doi.org/10.12998/wjcc.v9.i21.5932


