Copyright
©The Author(s) 2021.
World J Clin Cases. Jul 16, 2021; 9(20): 5637-5646
Published online Jul 16, 2021. doi: 10.12998/wjcc.v9.i20.5637
Published online Jul 16, 2021. doi: 10.12998/wjcc.v9.i20.5637
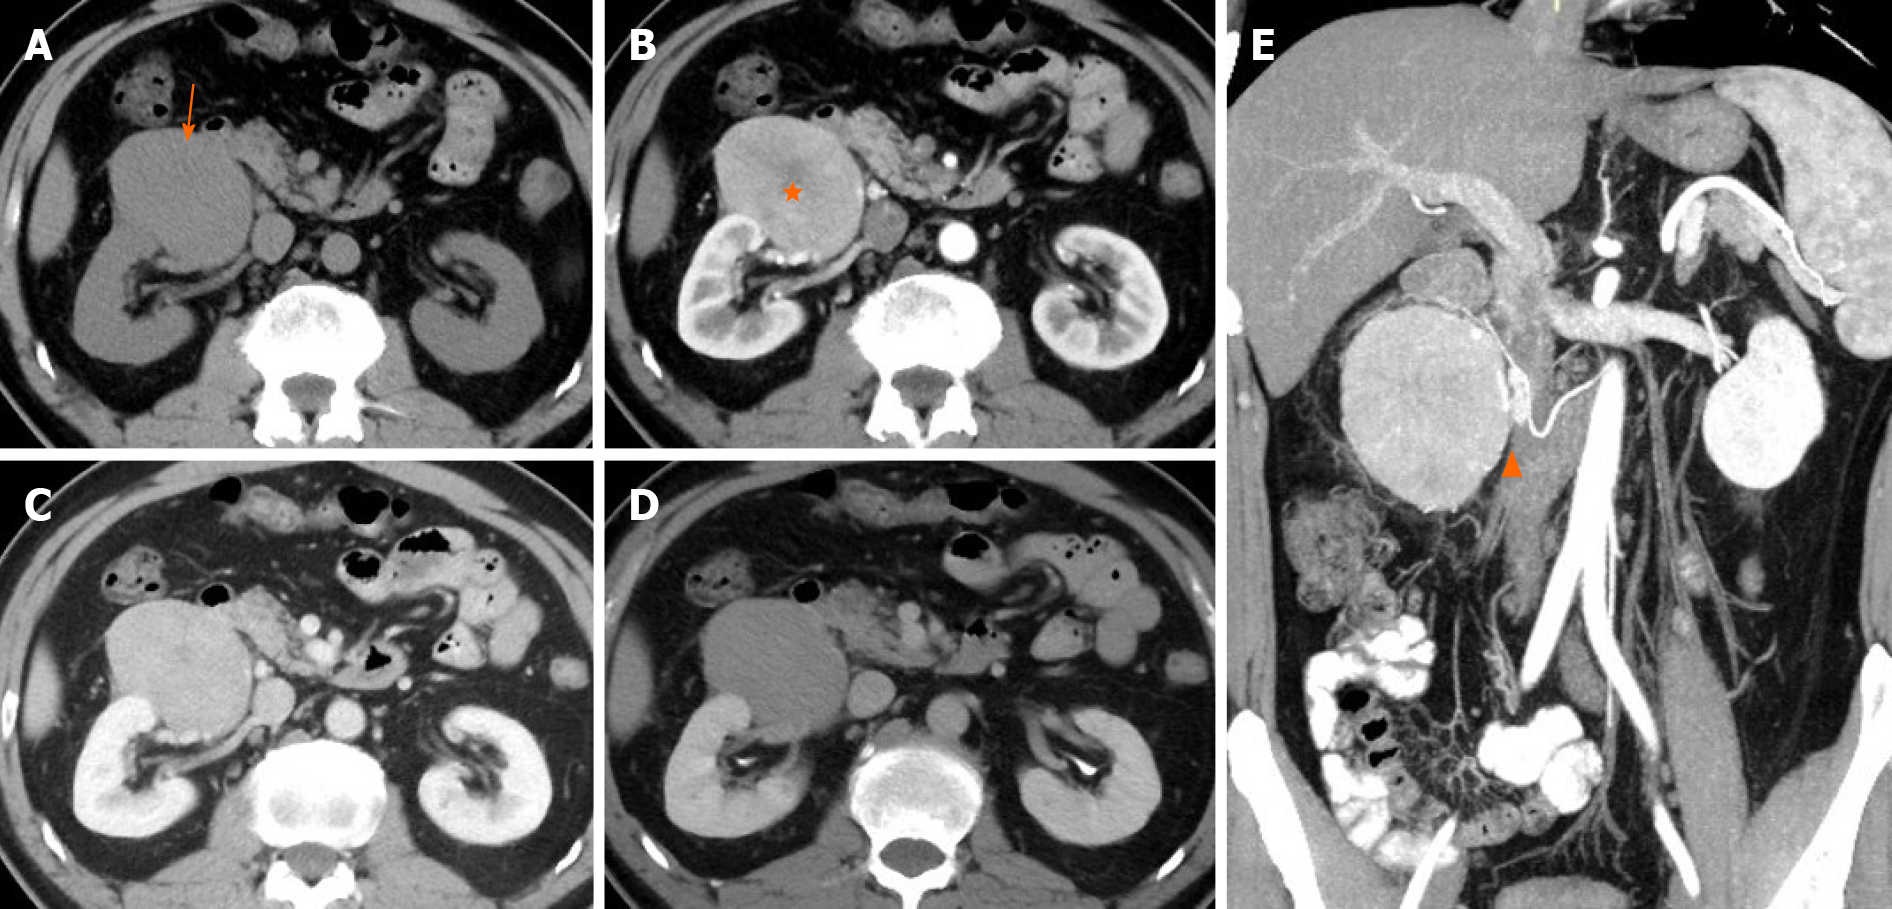
Figure 1 Computed tomography.
A: Pre-contrast image in the transverse plane showed that the density of mass was 40 HU (arrow); B-D: On a contrast-enhanced scan, the tumor presented uneven high enhancement with a stellate central scar in arterial phase (B, 111 HU, orange star) and withdrawal enhancement uniformly in portal vein (C, 95 HU) and delayed phases (D, 79 HU); E: On multiplanar reconstruction, the blood supply of the tumor derives from the right testicular artery (orange arrowhead).
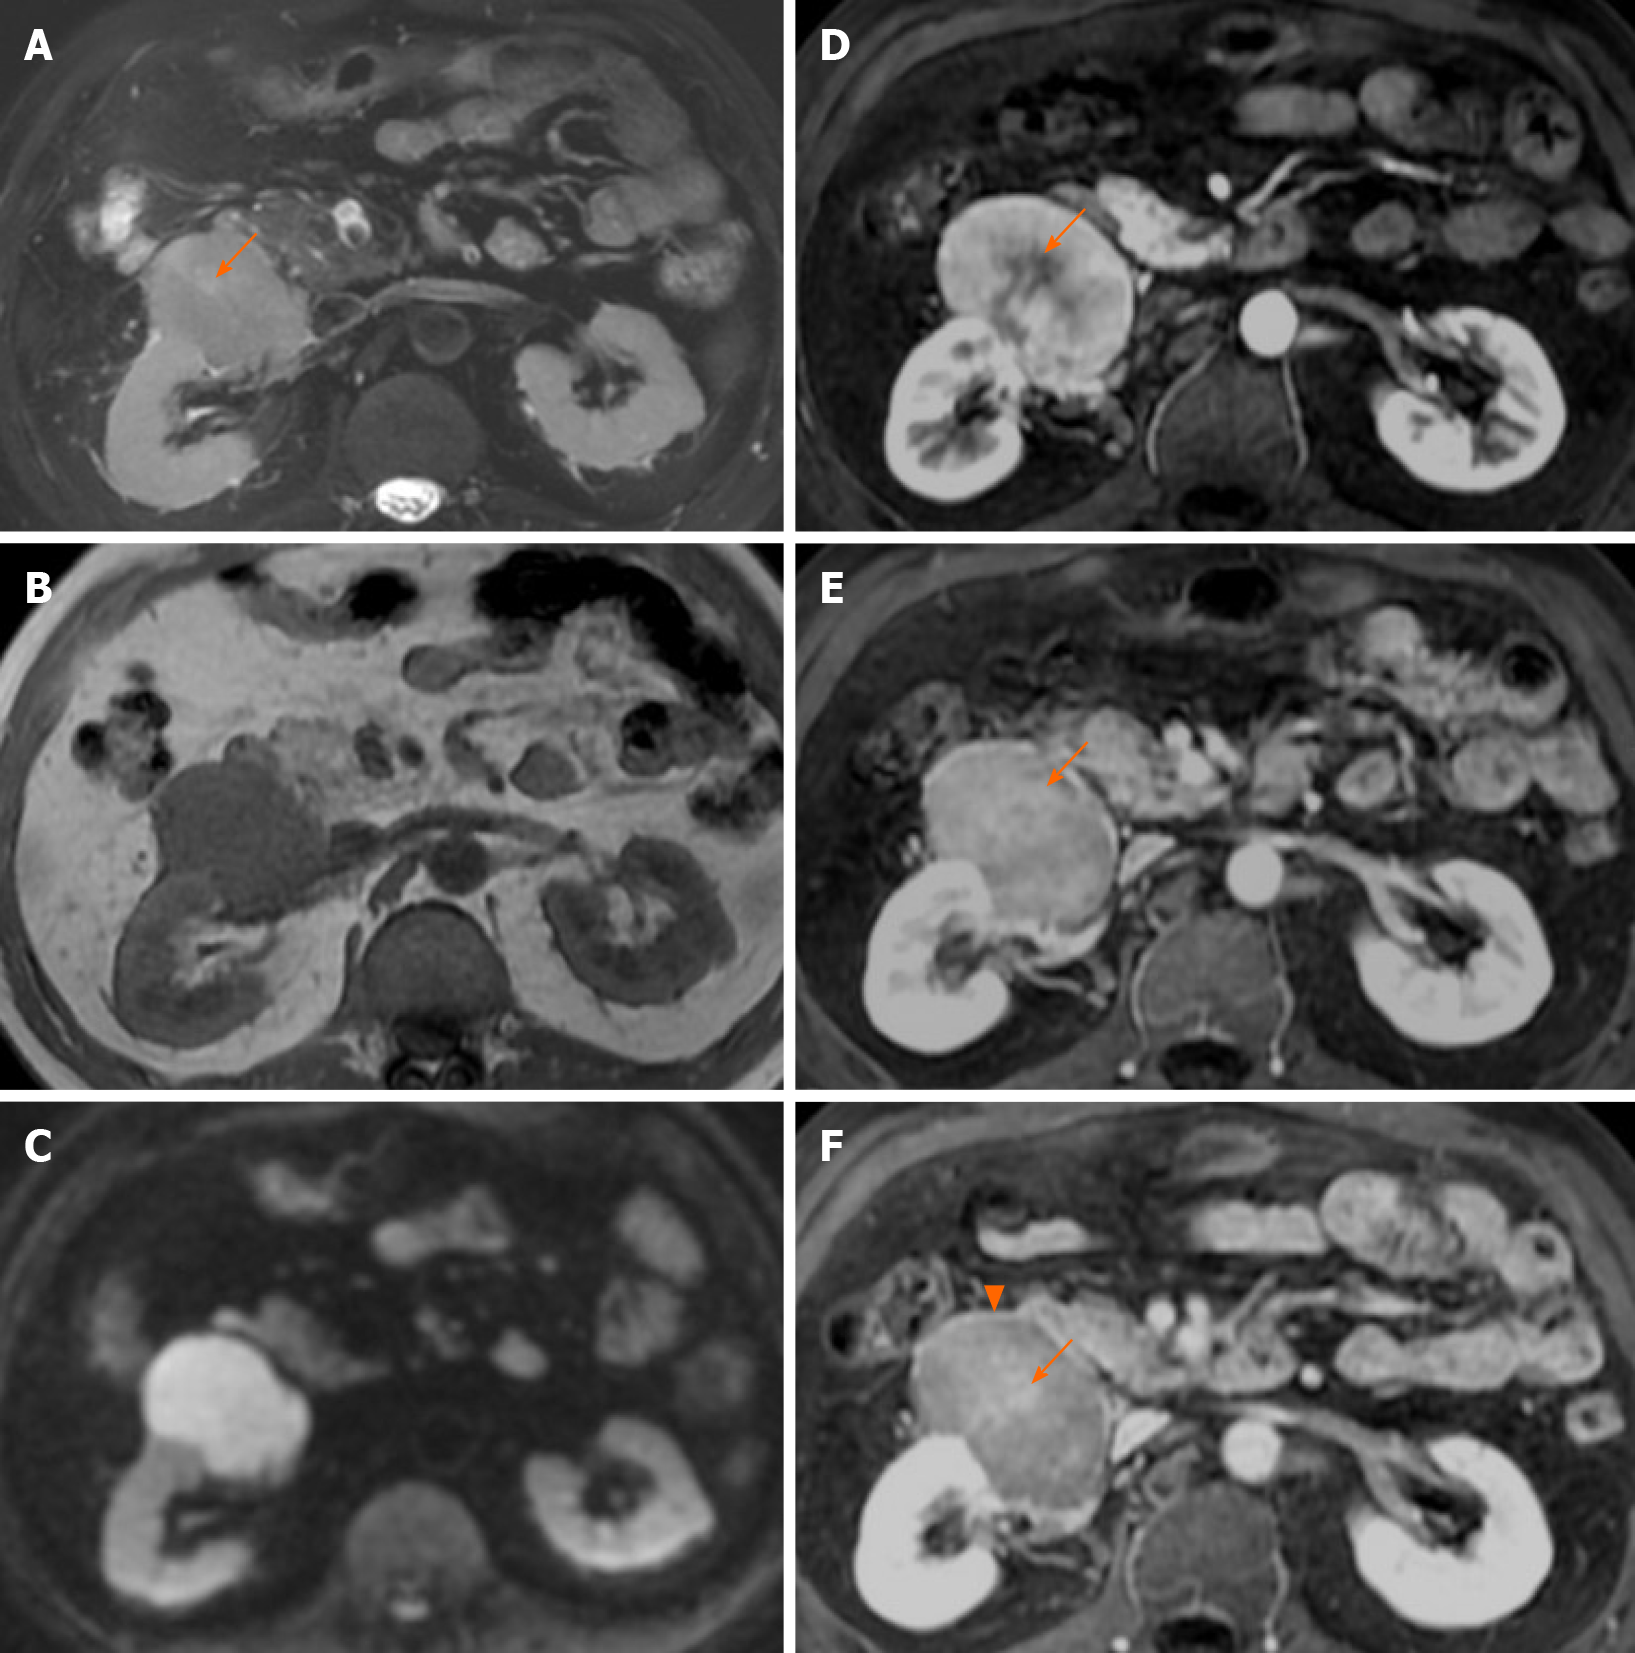
Figure 2 Magnetic resonance imaging.
A and B: A mass near the right kidney had a hyperintense signal on fat suppression T2WI (A) and a hypointense signal on T1WI (B); there was a stellate area with hyperintense signal on T2WI within the tumor (A, orange arrow); C: Diffusion-weighted imaging showed restricted diffusion with high signal; D-F: Gadolinium-enhanced imaging showed the internal stellate area (central scar) and hypo-enhancement in arterial phase (D, orange arrow) and further hyper-enhancement in the portal vein (E, orange arrow) and delayed phases (F, orange arrow). MRI of the abdomen in the transverse plane obtained during the portal vein and delayed phases showed tumor-enhanced encapsulation (F, orange arrowhead).
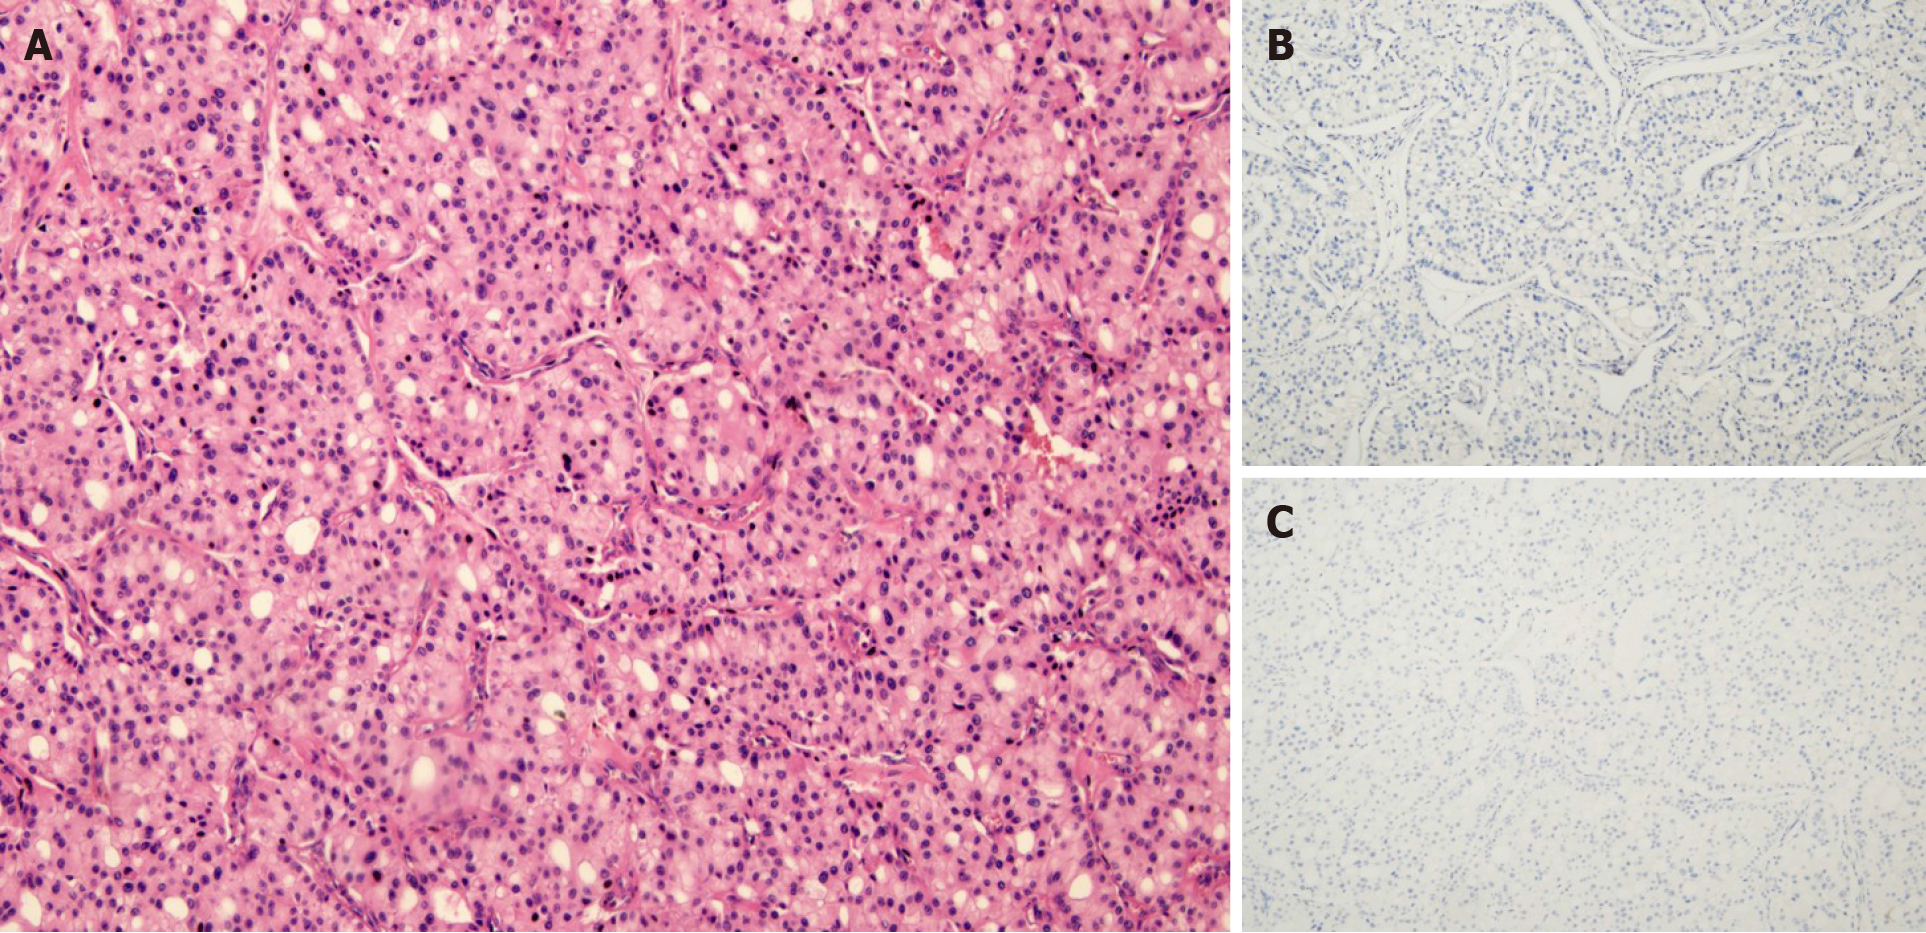
Figure 3 Microscopic features of acinar cell carcinoma.
A: Acinar pattern of tumor cell structure; B and C: Most tumor cells were negative for chromogranin A (B) and synaptophysin (C).
- Citation: Wei YY, Li Y, Shi YJ, Li XT, Sun YS. Primary extra-pancreatic pancreatic-type acinar cell carcinoma in the right perinephric space: A case report and review of literature. World J Clin Cases 2021; 9(20): 5637-5646
- URL: https://www.wjgnet.com/2307-8960/full/v9/i20/5637.htm
- DOI: https://dx.doi.org/10.12998/wjcc.v9.i20.5637


