Copyright
©The Author(s) 2021.
World J Clin Cases. Jul 16, 2021; 9(20): 5526-5534
Published online Jul 16, 2021. doi: 10.12998/wjcc.v9.i20.5526
Published online Jul 16, 2021. doi: 10.12998/wjcc.v9.i20.5526
Figure 1 The examination of the patient.
A: Patient has microcephaly and congenital esotropia; B: Corpus callosum and splenium are thin; C: Ventricle is dilated.
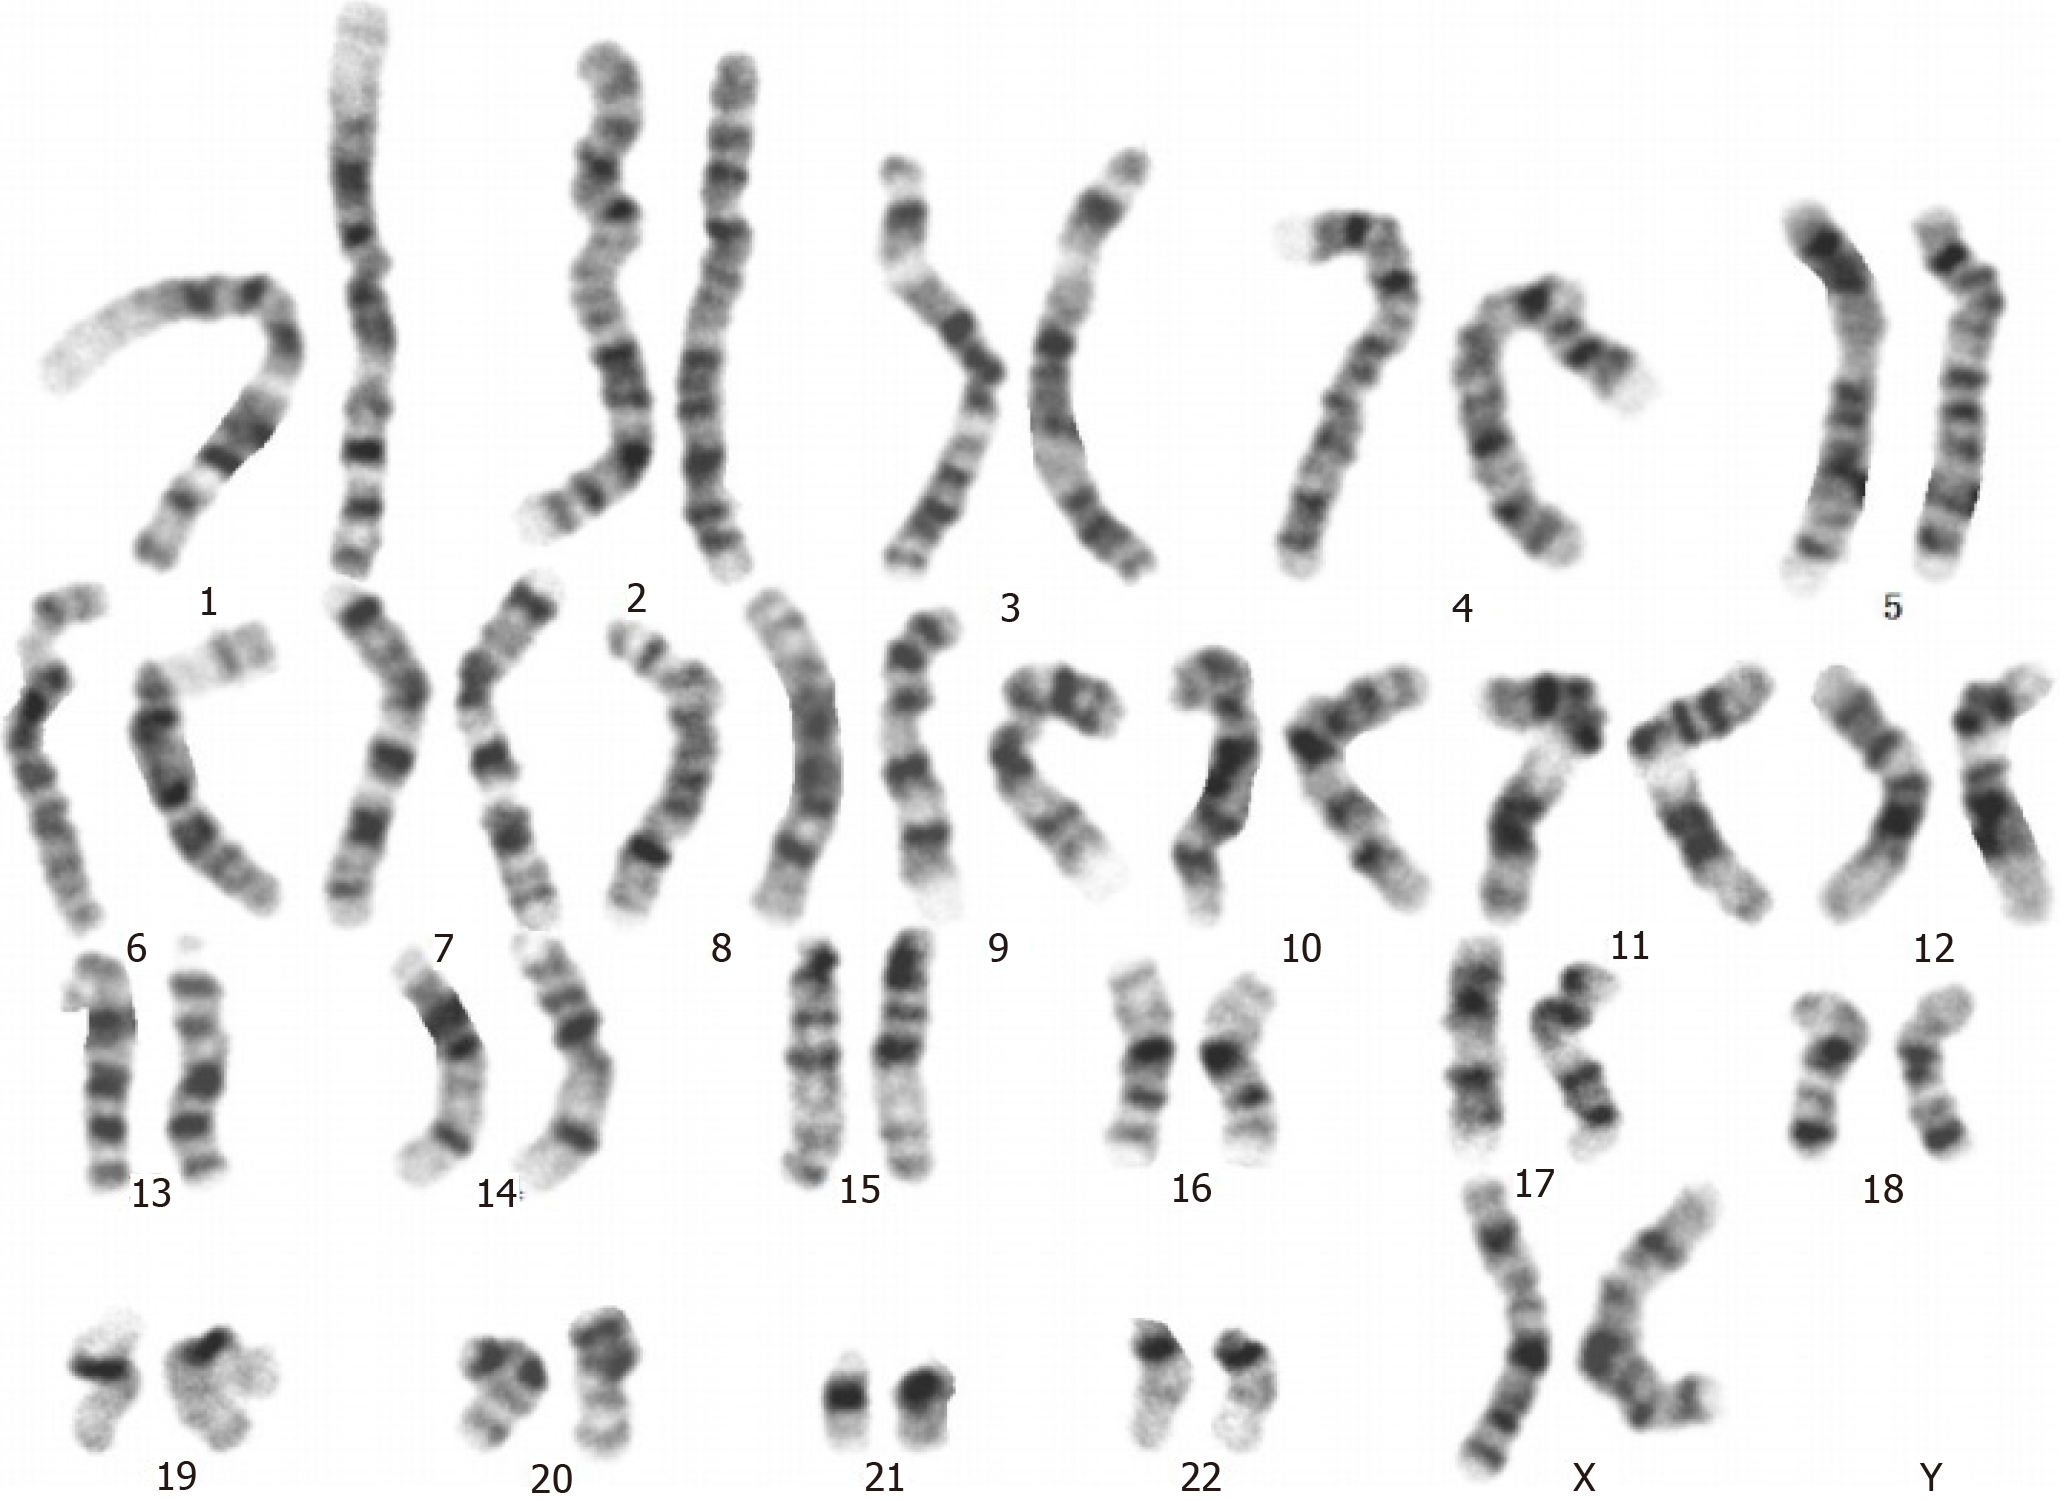
Figure 2 G-banded analysis at the 550-band level shows a normal karyotype, 46, XX (20).
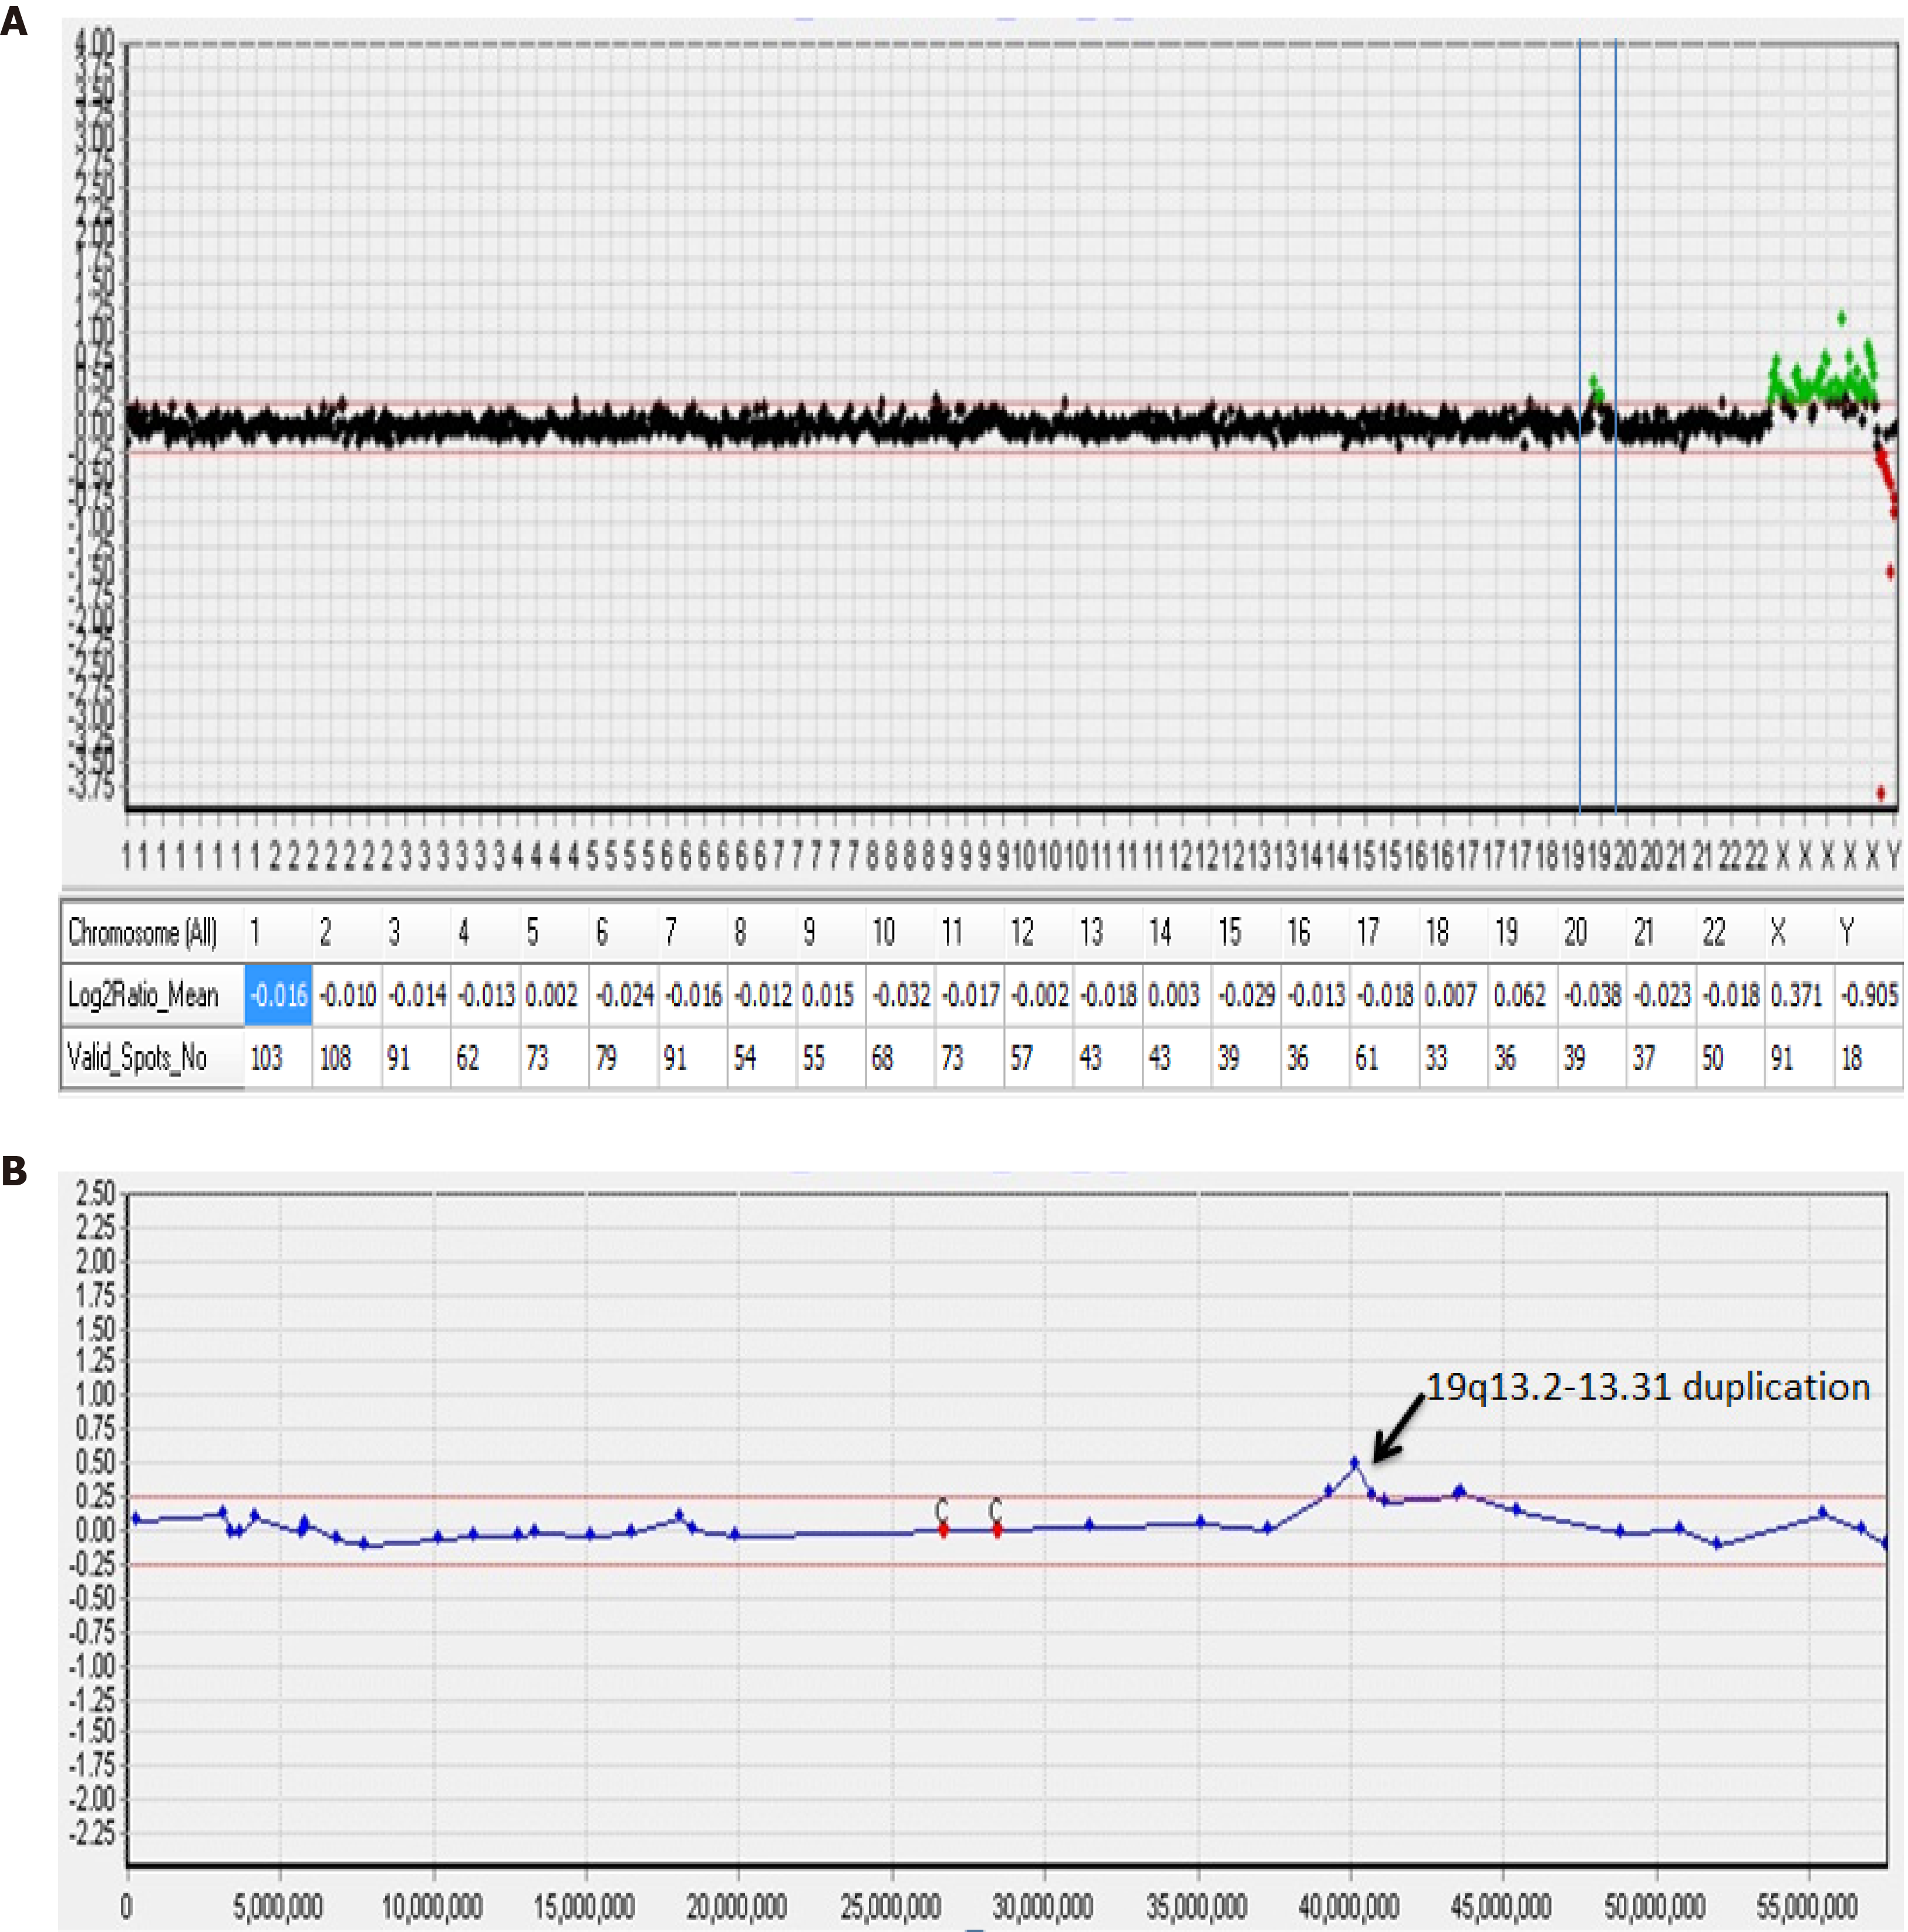
Figure 3 Array comparative genomic hybridization analysis performed suggests a mosaic gain of 19q.
A: Array comparative genomic hybridization (aCGH) data profile in whole chromosomes. A dot represents a bacterial artificial chromosome clone, the X-axis represents the chromosome number (1-22, X,Y), and the Y-axis represents the log2 T/R signal ratio value. The table below the graph represents the average log2 T/R signal ratio value for each chromosome. Green dots represent a copy number gain (log2 T/R signal ratio value > 0.25) and duplication on chromosome 19; B: aCGH profile from chromosome 19 shows a duplication on the long arm. The size of the duplication fragment was estimated to be 4.42 Mb (chr19:39,343,725-43,762,586).
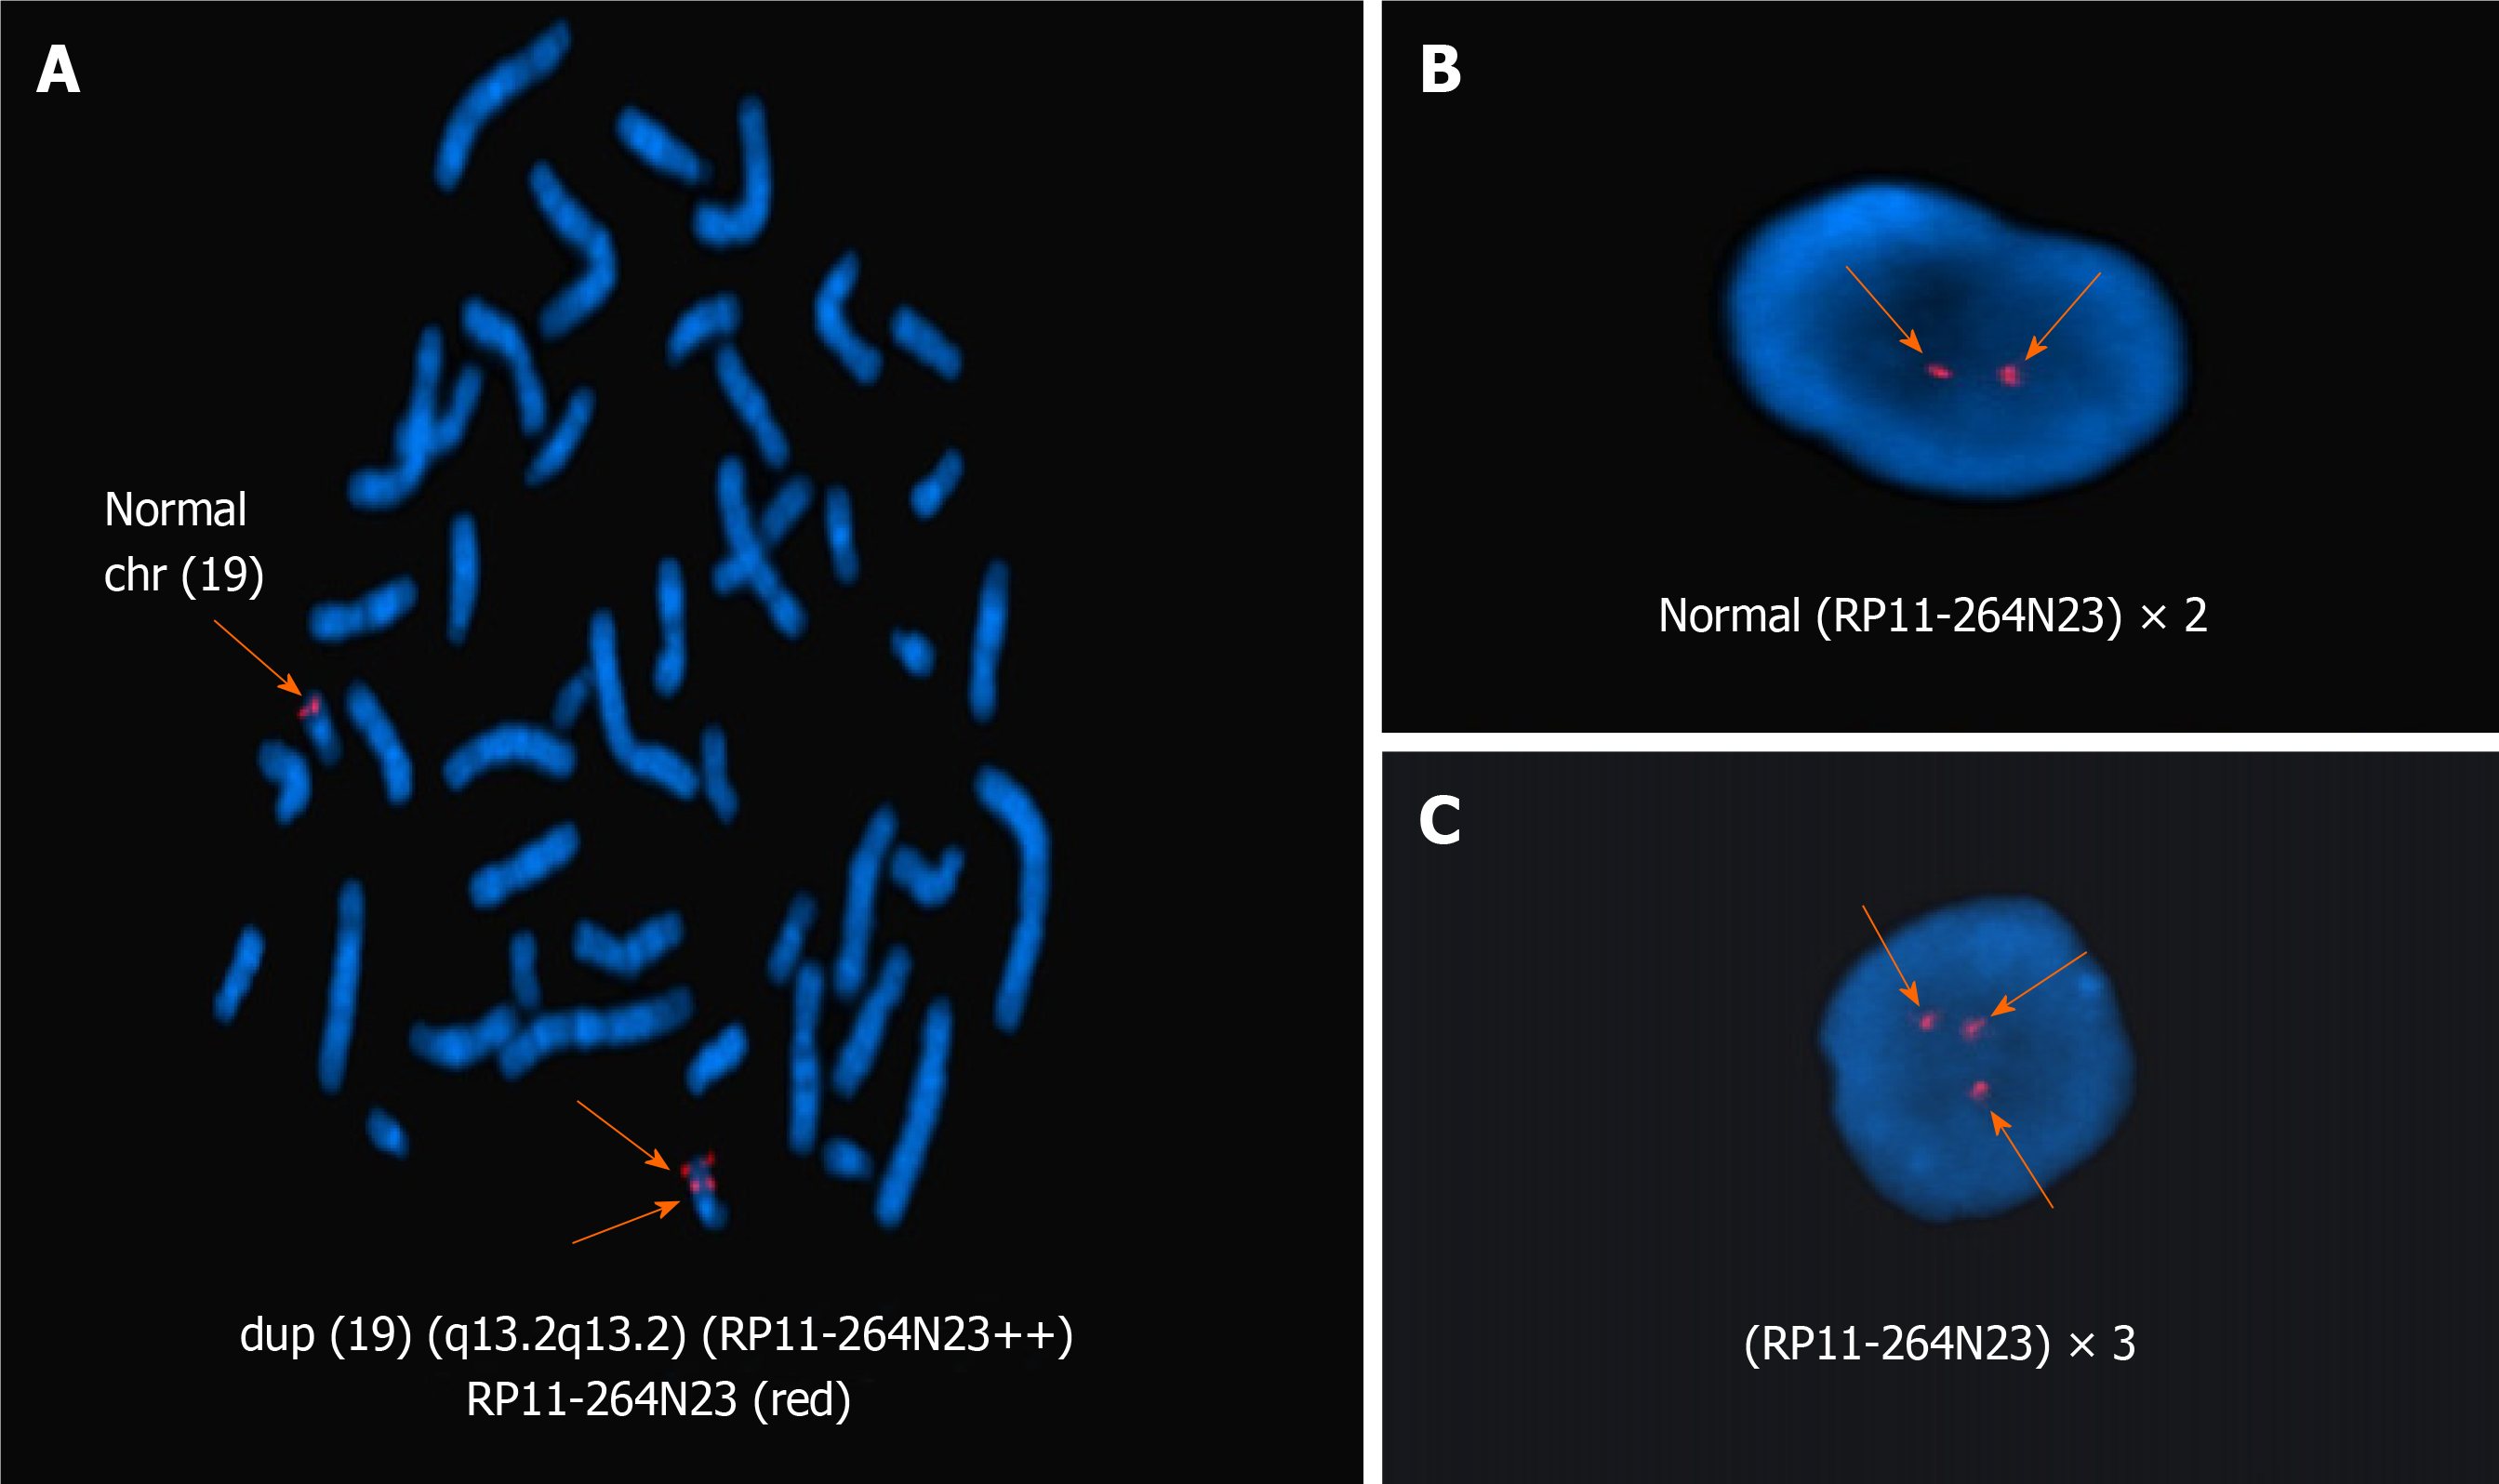
Figure 4 Fluorescence in situ hybridization with the 19q13.
2-specific region probe (red). A: Arrow indicates a dup (19) (q13.2q13.2) chromosome [46,XX.ish dup (19) (q13.2q13.2) (RAI1++)] in metaphase fluorescence in situ hybridization (FISH); B: In interphase FISH, two arrows indicate a normal signal probe (RP11-264N23) × 2; C: In interphase FISH, three arrows indicate a duplication of the probe (RP11-264N23) × 3.
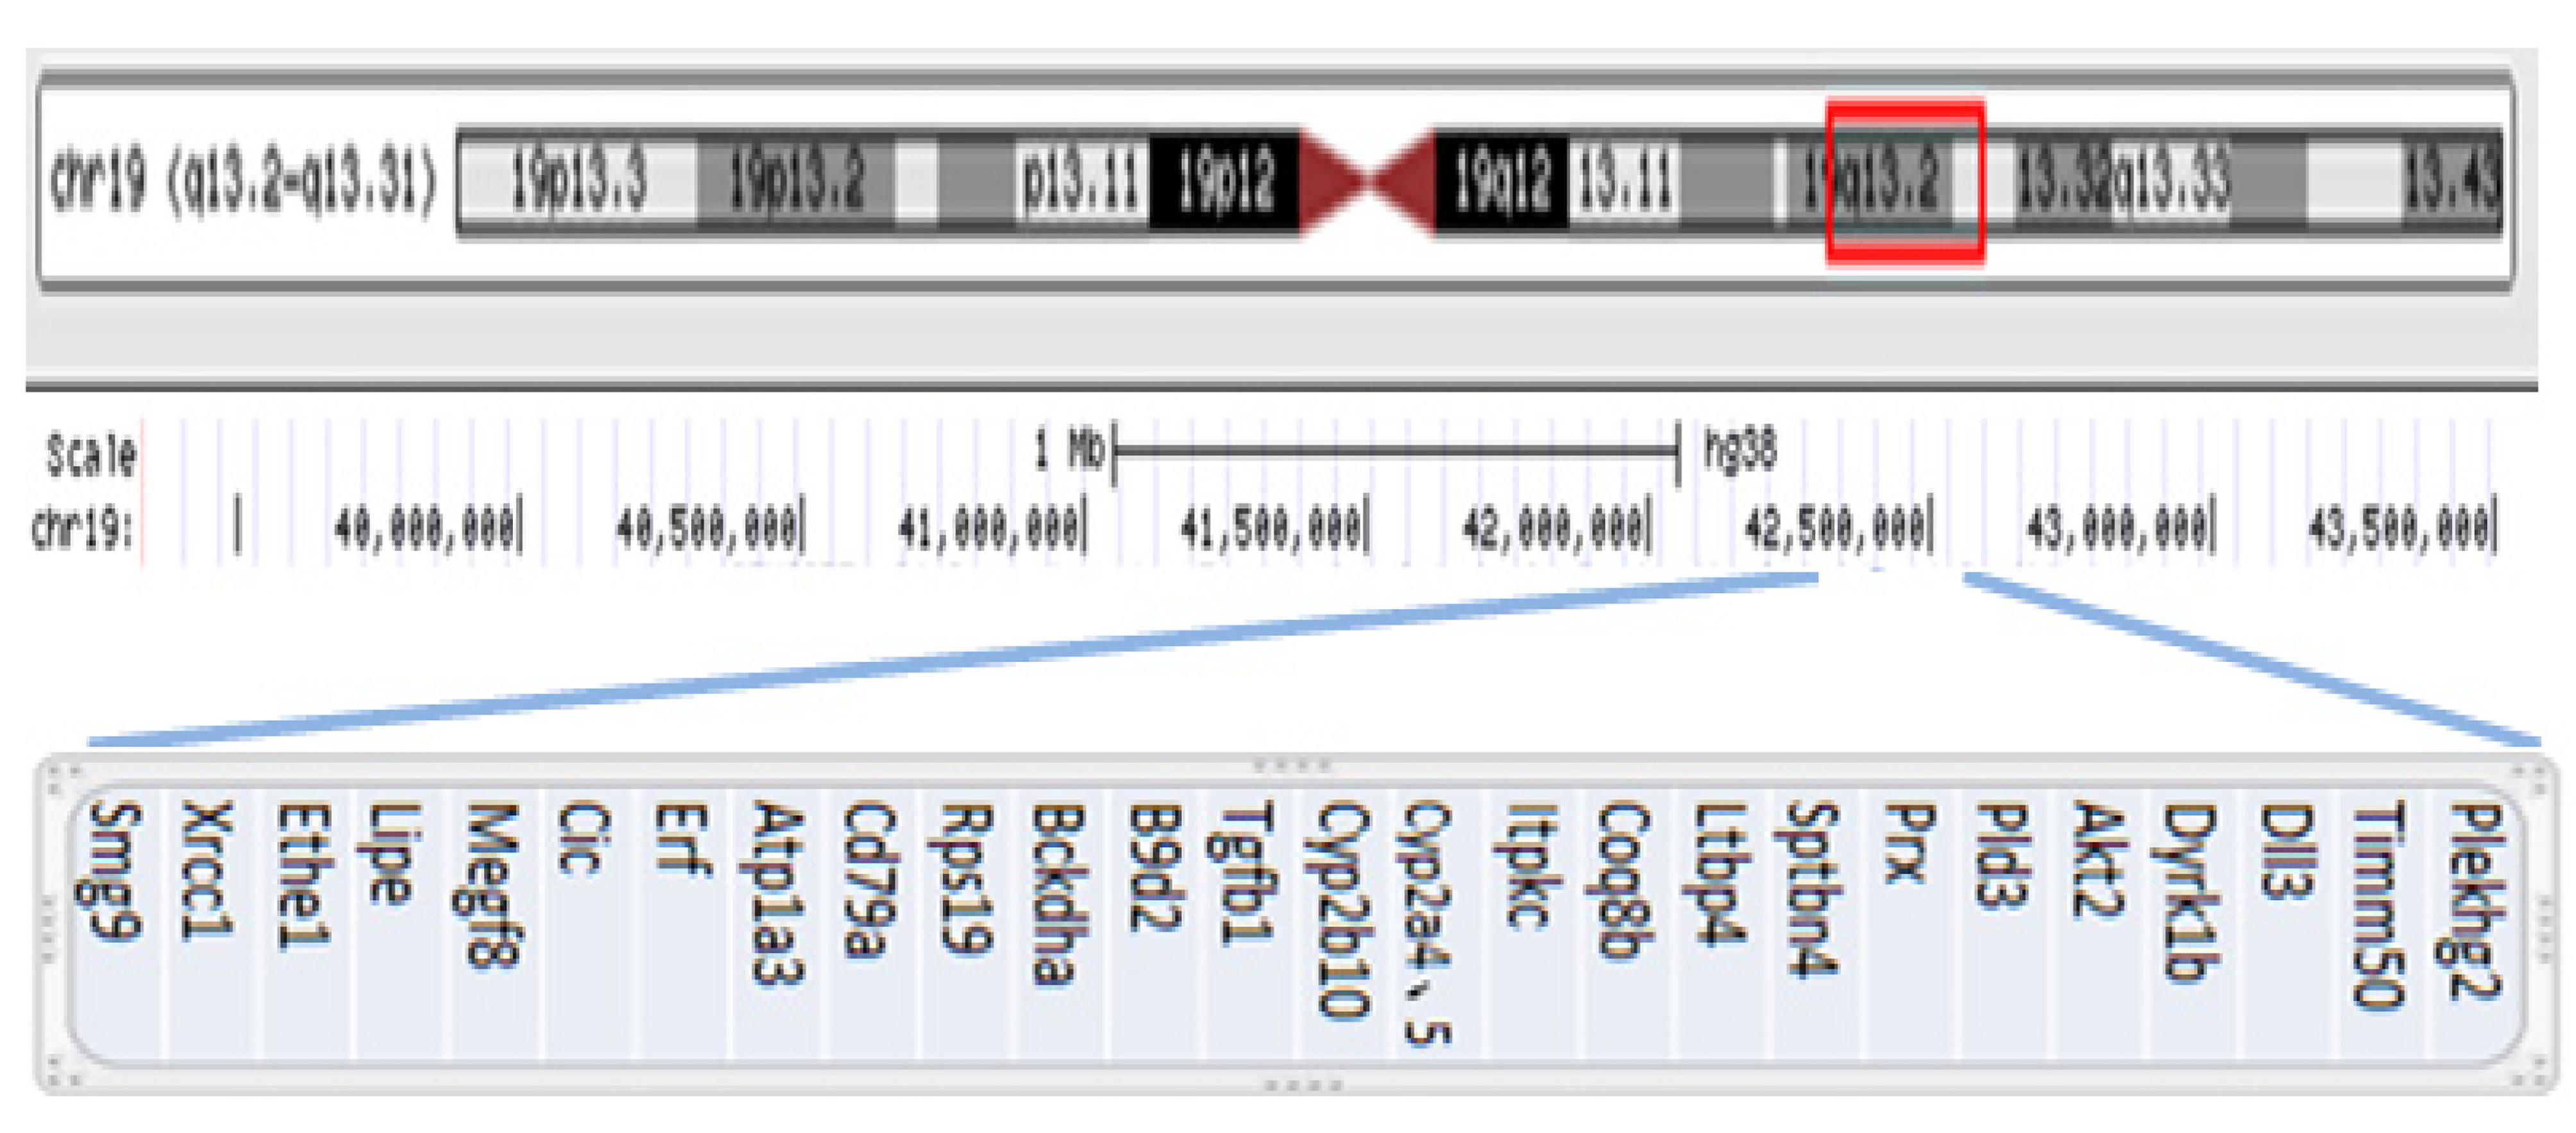
Figure 5 Genomic coordinates for the 19q13.
2-q13.31 gain are chr19:39,343,725-43,762,586 (hg38), estimated to be 4.42 Mb. This duplication includes 27 OMIM Morbid genes: Plekhg2, Timm50, Dll3, Dyrk1b, Akt2, Pld3, Prx, Sptbn4, Ltbp4, Coq8b, Itpkc, Cyp2a4, Cyp2a5, Cyp2b10, Tgfb1, B9d2, Bckdha, Rps19, Cd79a, Atp1a3, Erf, Cic, Megf8, Lipe, Ethe1, Xrcc1, and Smg9 (hg38 database, http://genome.ucsc.edu).
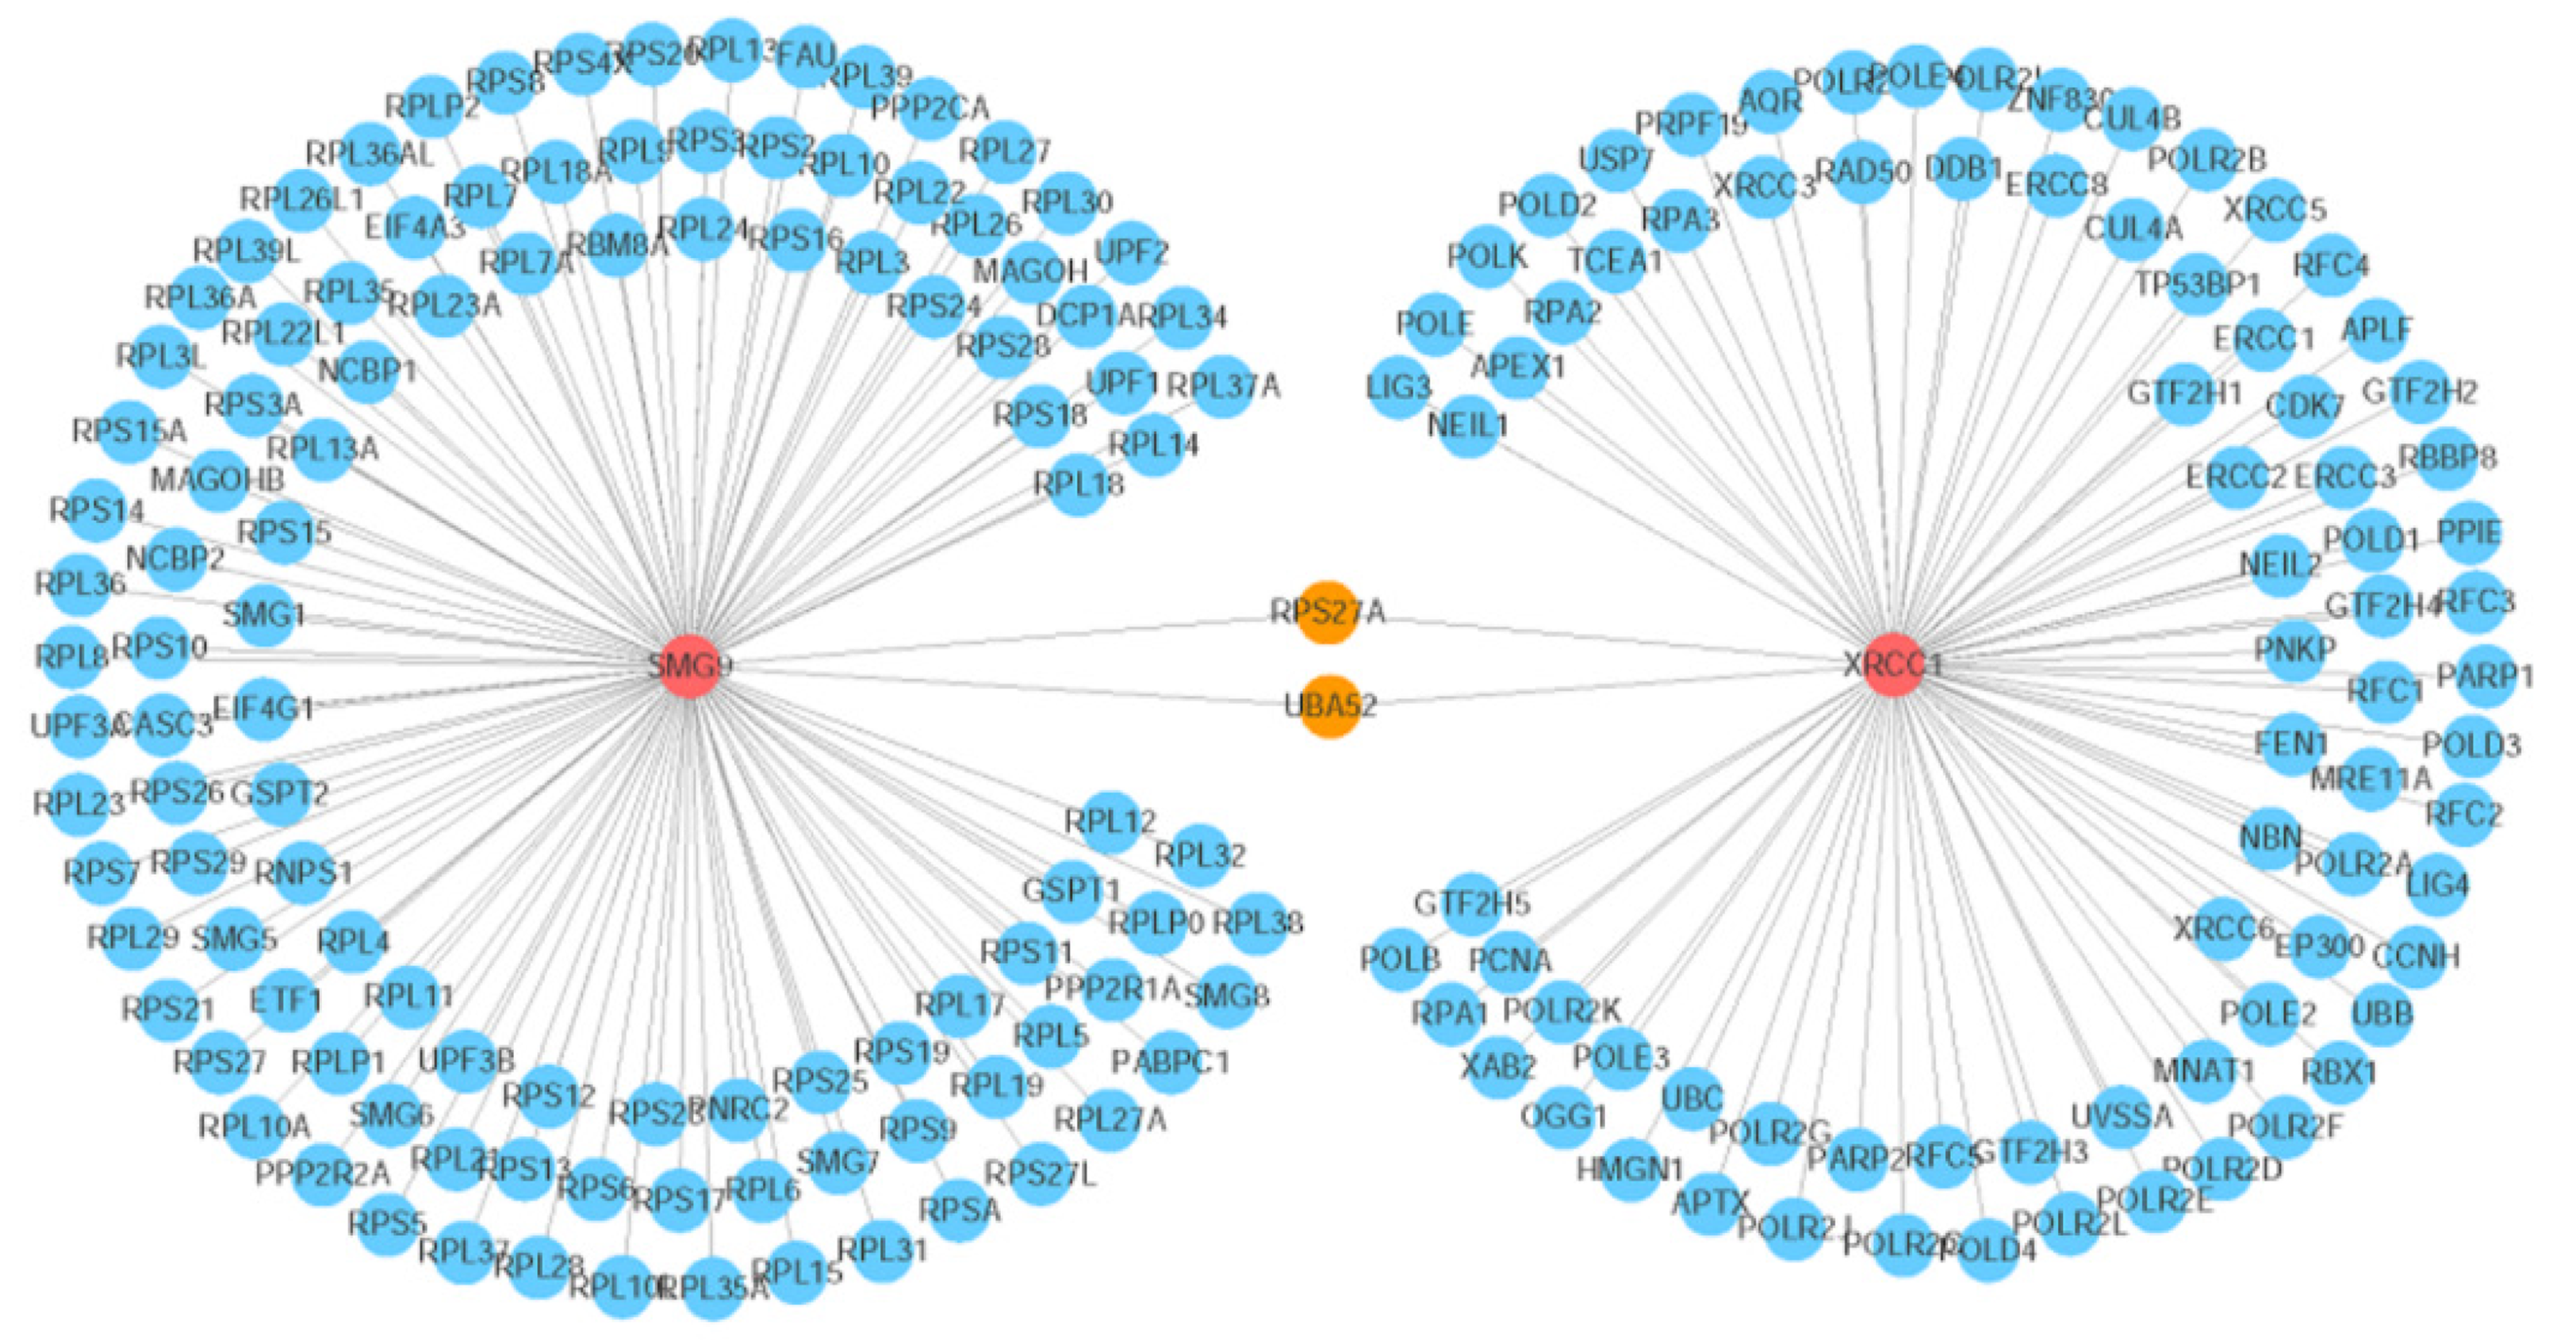
Figure 6 Visualization of the gene network that interacts with the SMG9 and XRCC1 genes.
The red circles indicate the query genes (SMG9 and XRCC1), the orange circles represent the genes that interact with both of the two query genes, and the blue circles denote the other interacting genes. The line thickness indicates the strength of the interaction (interaction score).
- Citation: Feng YL, Li ND. Duplication of 19q (13.2-13.31) associated with comitant esotropia: A case report. World J Clin Cases 2021; 9(20): 5526-5534
- URL: https://www.wjgnet.com/2307-8960/full/v9/i20/5526.htm
- DOI: https://dx.doi.org/10.12998/wjcc.v9.i20.5526


