Copyright
©The Author(s) 2021.
World J Clin Cases. Jun 26, 2021; 9(18): 4837-4843
Published online Jun 26, 2021. doi: 10.12998/wjcc.v9.i18.4837
Published online Jun 26, 2021. doi: 10.12998/wjcc.v9.i18.4837
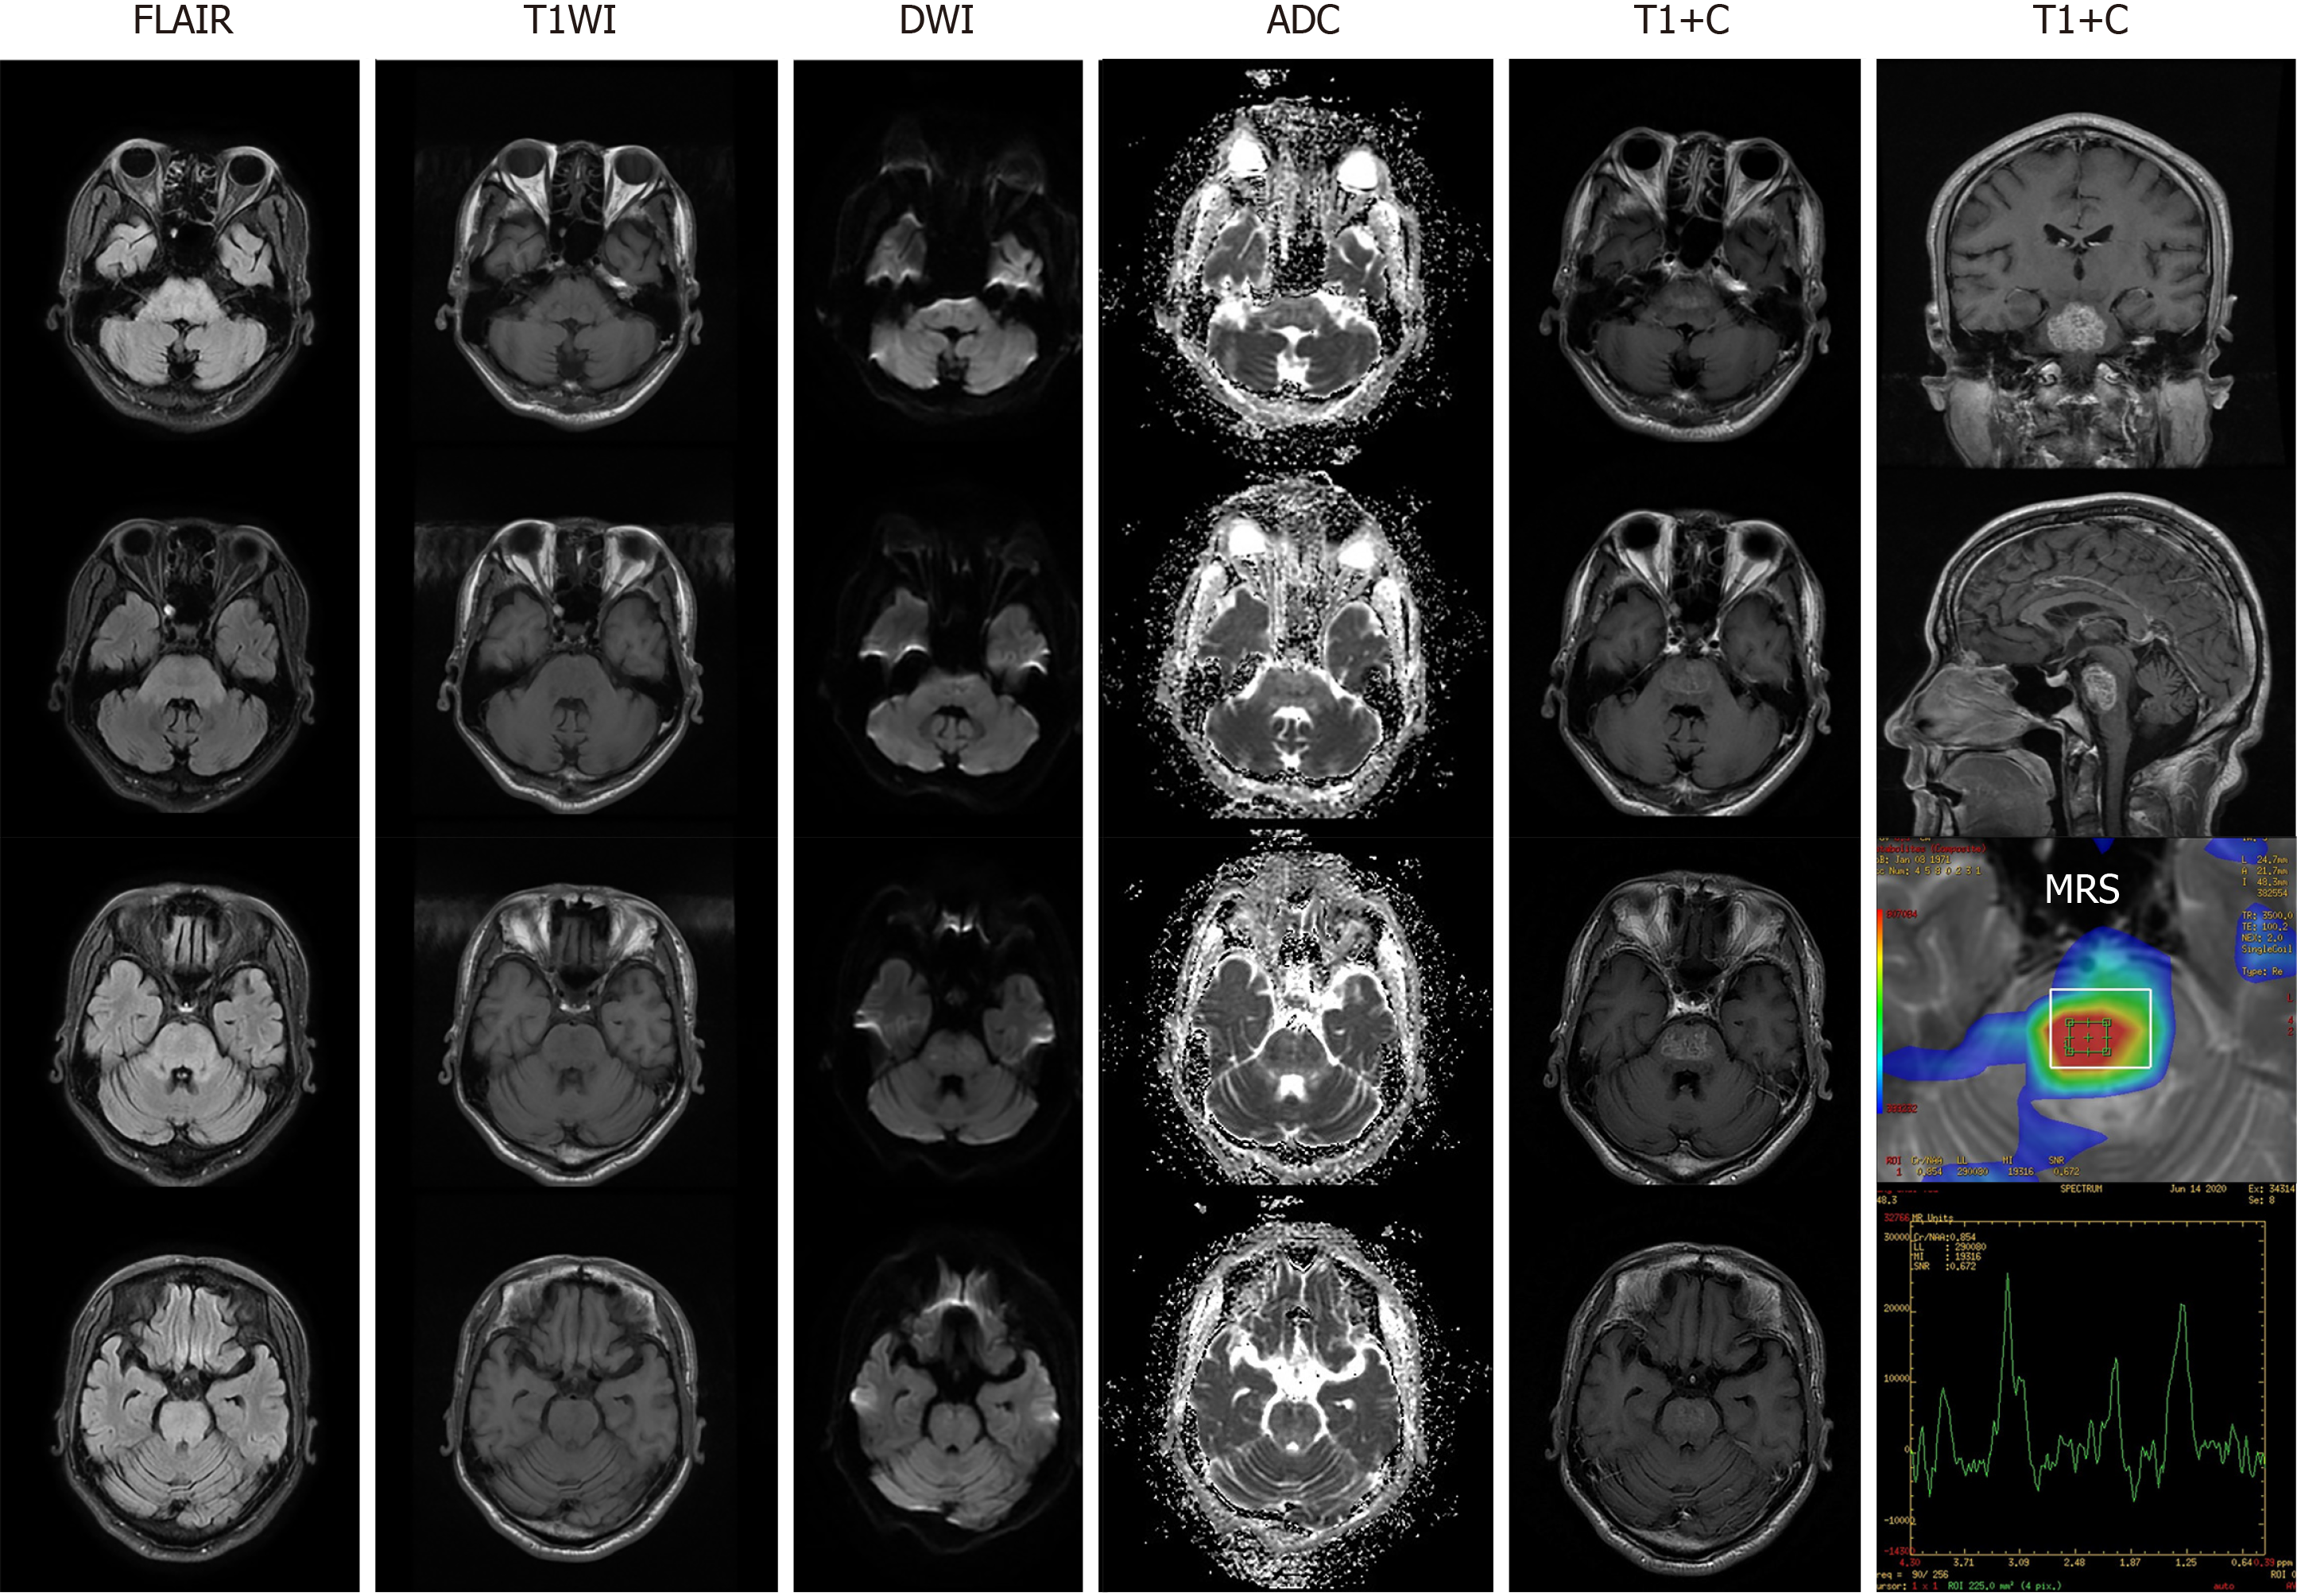
Figure 1 Magnetic resonance imaging manifestations on admission.
Each column shows the imaging features in a different cross-section of the corresponding sequence. The lesions on admission were distributed diffusely in the brainstem, especially in the lower pons. Magnetic resonance imaging on admission showed hyperintensity on fluid-attenuated inversion recovery, relative hypointensity on T1-weighted image, slight hyperintensity on diffusion weighted imaging, heterogeneous intensity on apparent diffusion coefficient, with apparent corresponding hyperintensity on contrast-enhanced T1-weighted image. Magnetic resonance spectroscopy showed the elevated choline peak and lactate/lipid peak. ADC: Apparent diffusion coefficient; DWI: Diffusion weighted imaging; FLAIR: Fluid-attenuated inversion recovery; MRS: Magnetic resonance spectroscopy; T1WI: T1-weighted image; T1+C: Contrast-enhanced T1-weighted image.
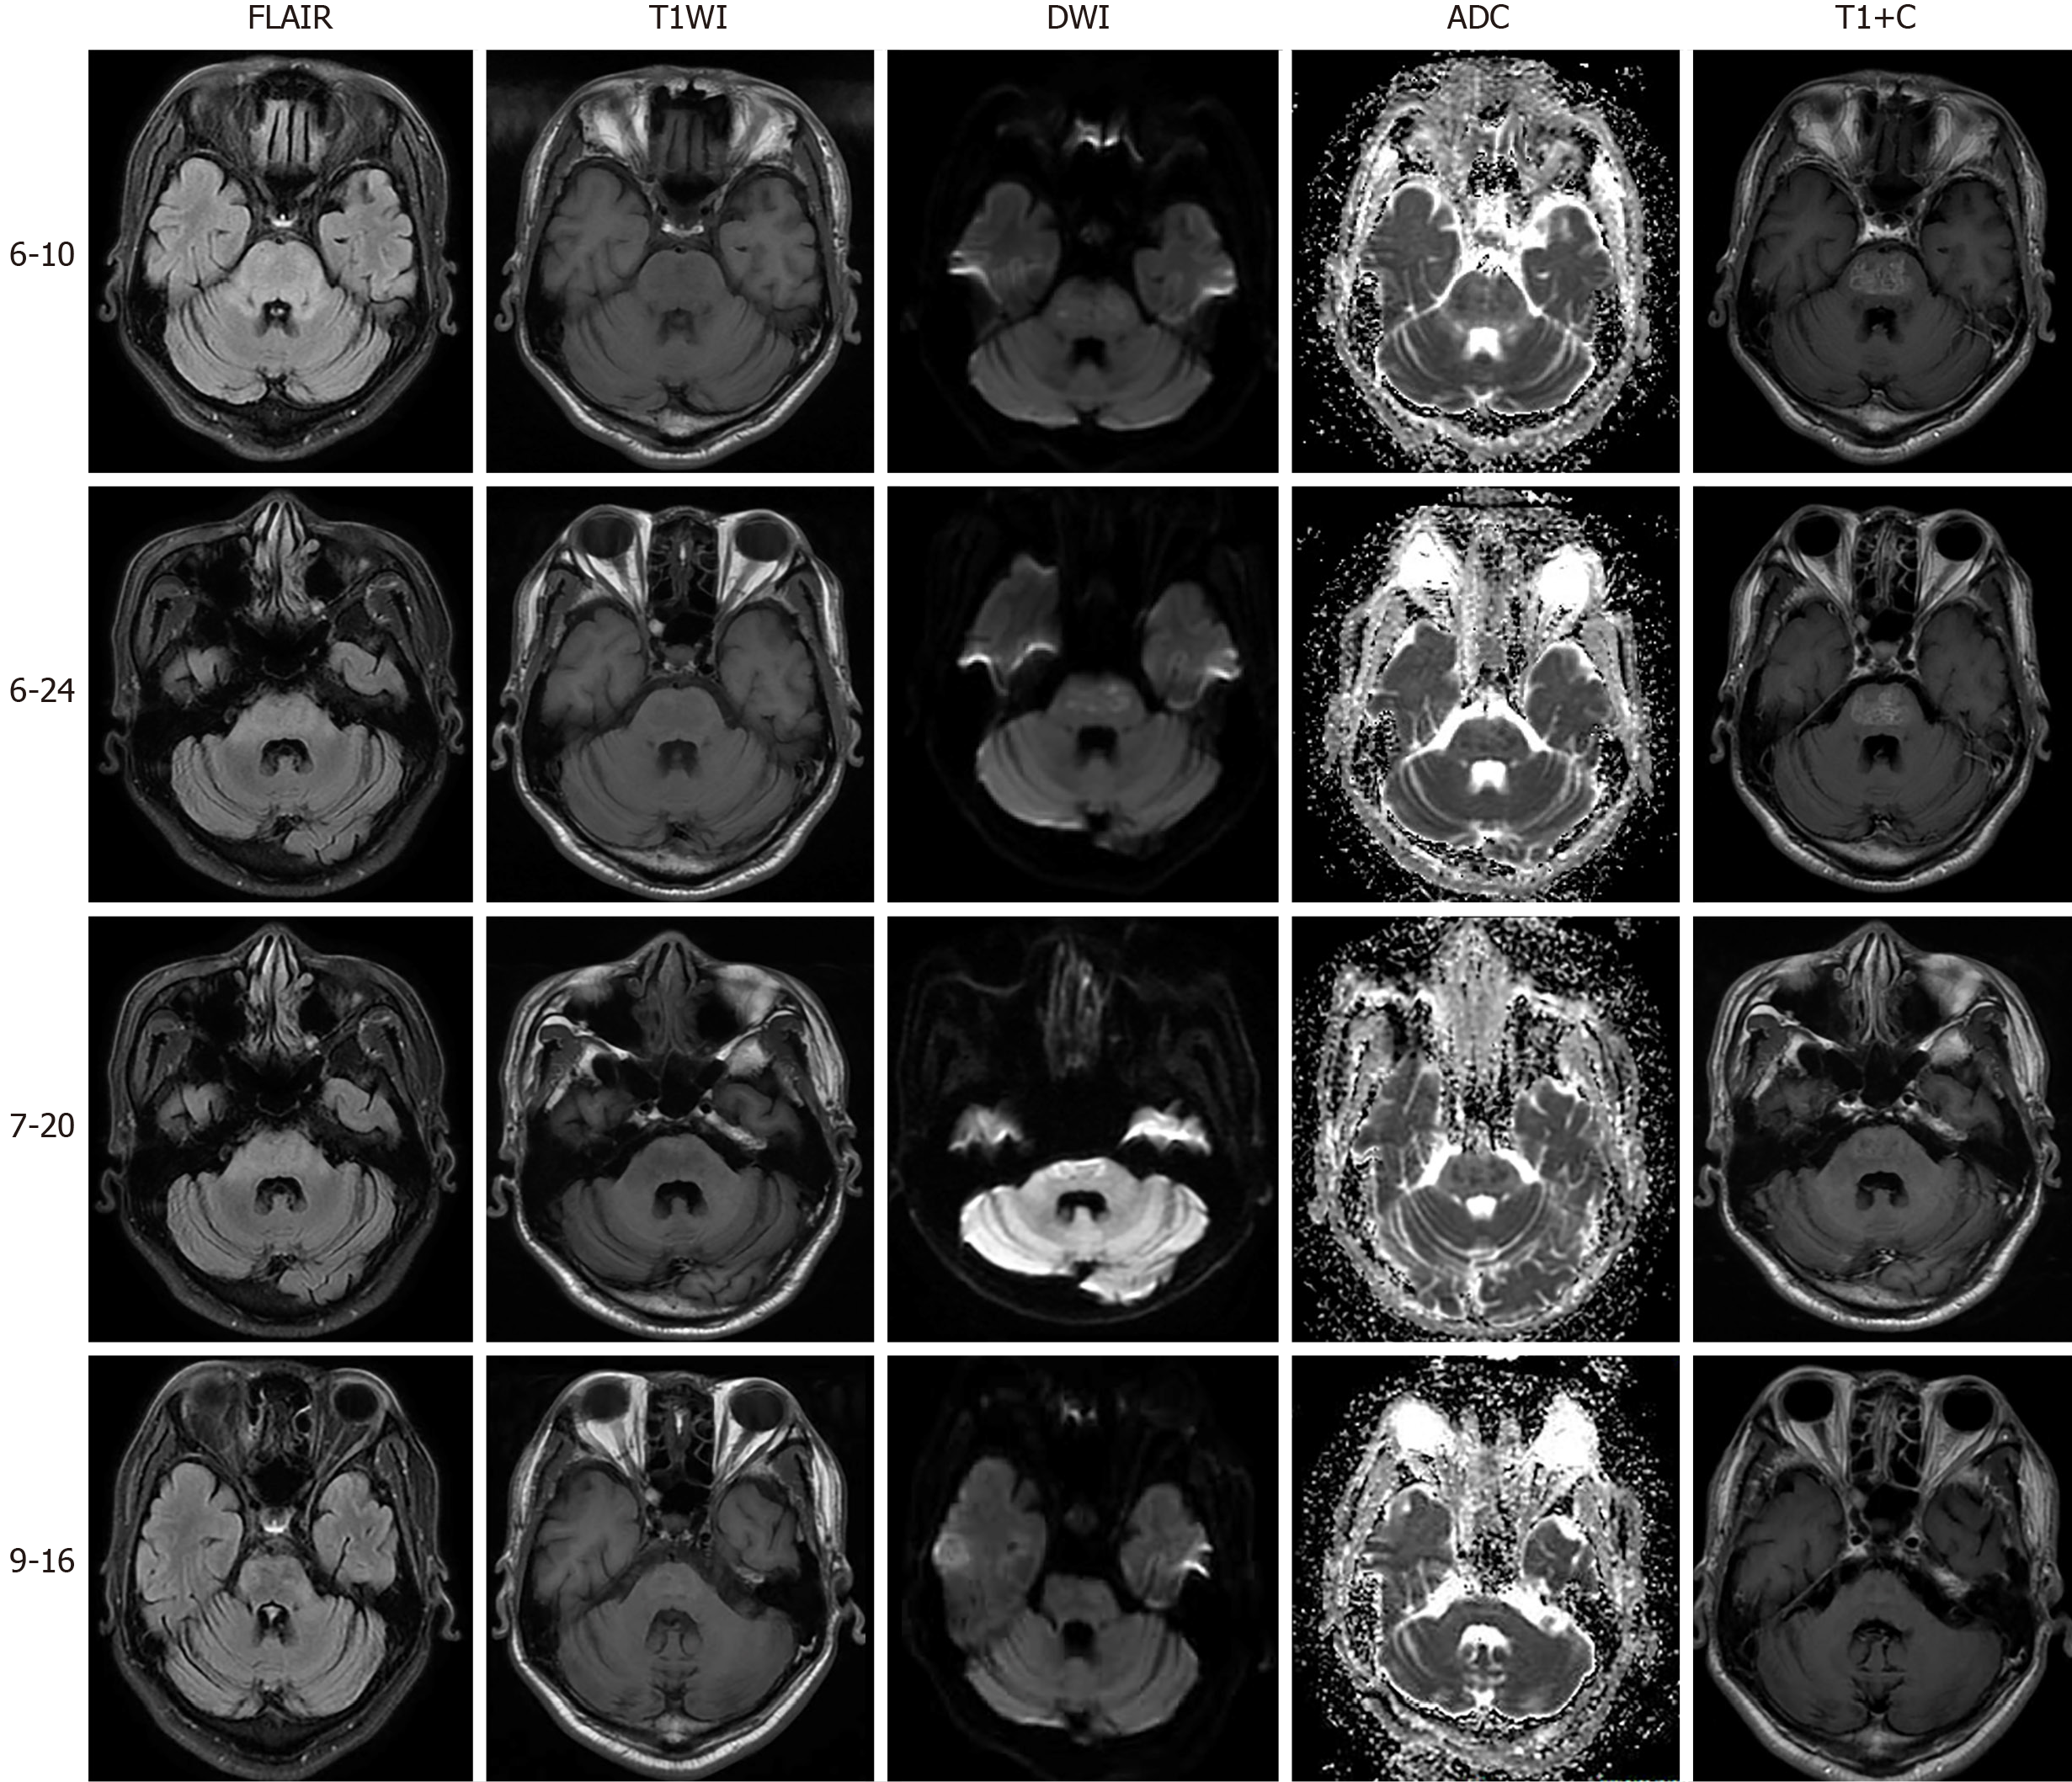
Figure 2 Imaging changes during follow-up.
Each row shows the imaging features in the same cross-section from different sequences at different times. The first row demonstrated the initial appearance of lesions after admission (6-10). After 8-d of treatment with corticosteroids (6-24), his lesions have shrunk with decreasing signal intensity. During follow-up (7-20 and 9-16), imaging showed further improvement, without apparent enhanced signals. ADC: Apparent diffusion coefficient; DWI: Diffusion weighted imaging; FLAIR: Fluid-attenuated inversion recovery; T1WI: T1-weighted image; T1+C: Contrast-enhanced T1-weighted image.
- Citation: Shi XY, Cai MT, Shen H, Zhang JX. Central pontine myelinolysis mimicking glioma in diabetes: A case report. World J Clin Cases 2021; 9(18): 4837-4843
- URL: https://www.wjgnet.com/2307-8960/full/v9/i18/4837.htm
- DOI: https://dx.doi.org/10.12998/wjcc.v9.i18.4837


