Copyright
©The Author(s) 2021.
World J Clin Cases. Jun 16, 2021; 9(17): 4285-4293
Published online Jun 16, 2021. doi: 10.12998/wjcc.v9.i17.4285
Published online Jun 16, 2021. doi: 10.12998/wjcc.v9.i17.4285
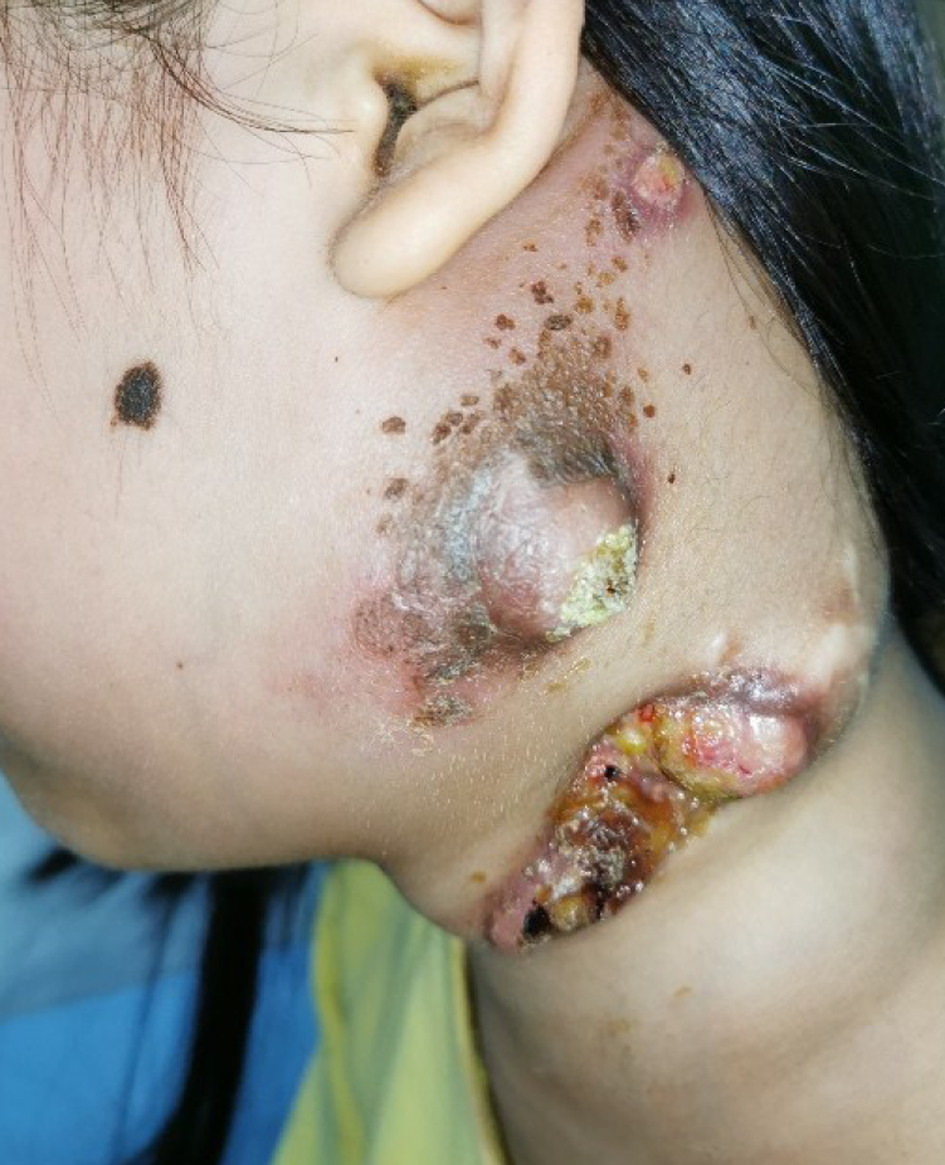
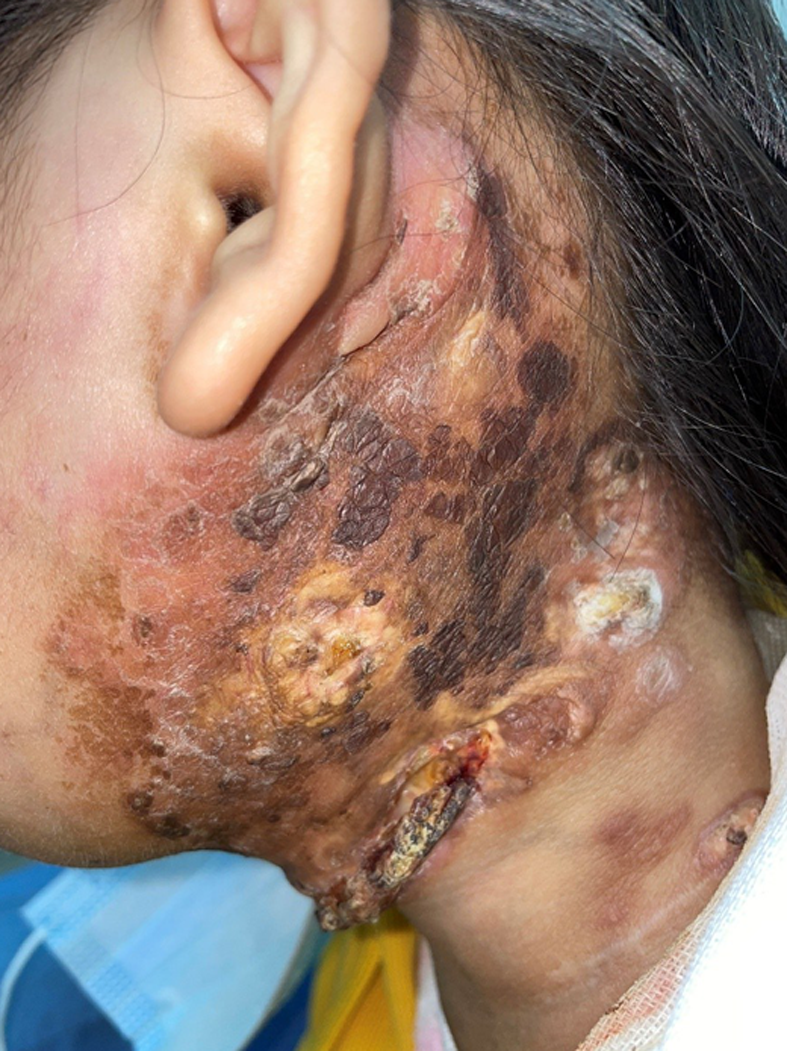
Figure 1 There were multiple lesions in the left neck of the patient.
The diseased lymph nodes have broken through the skin with ulceration and pus.
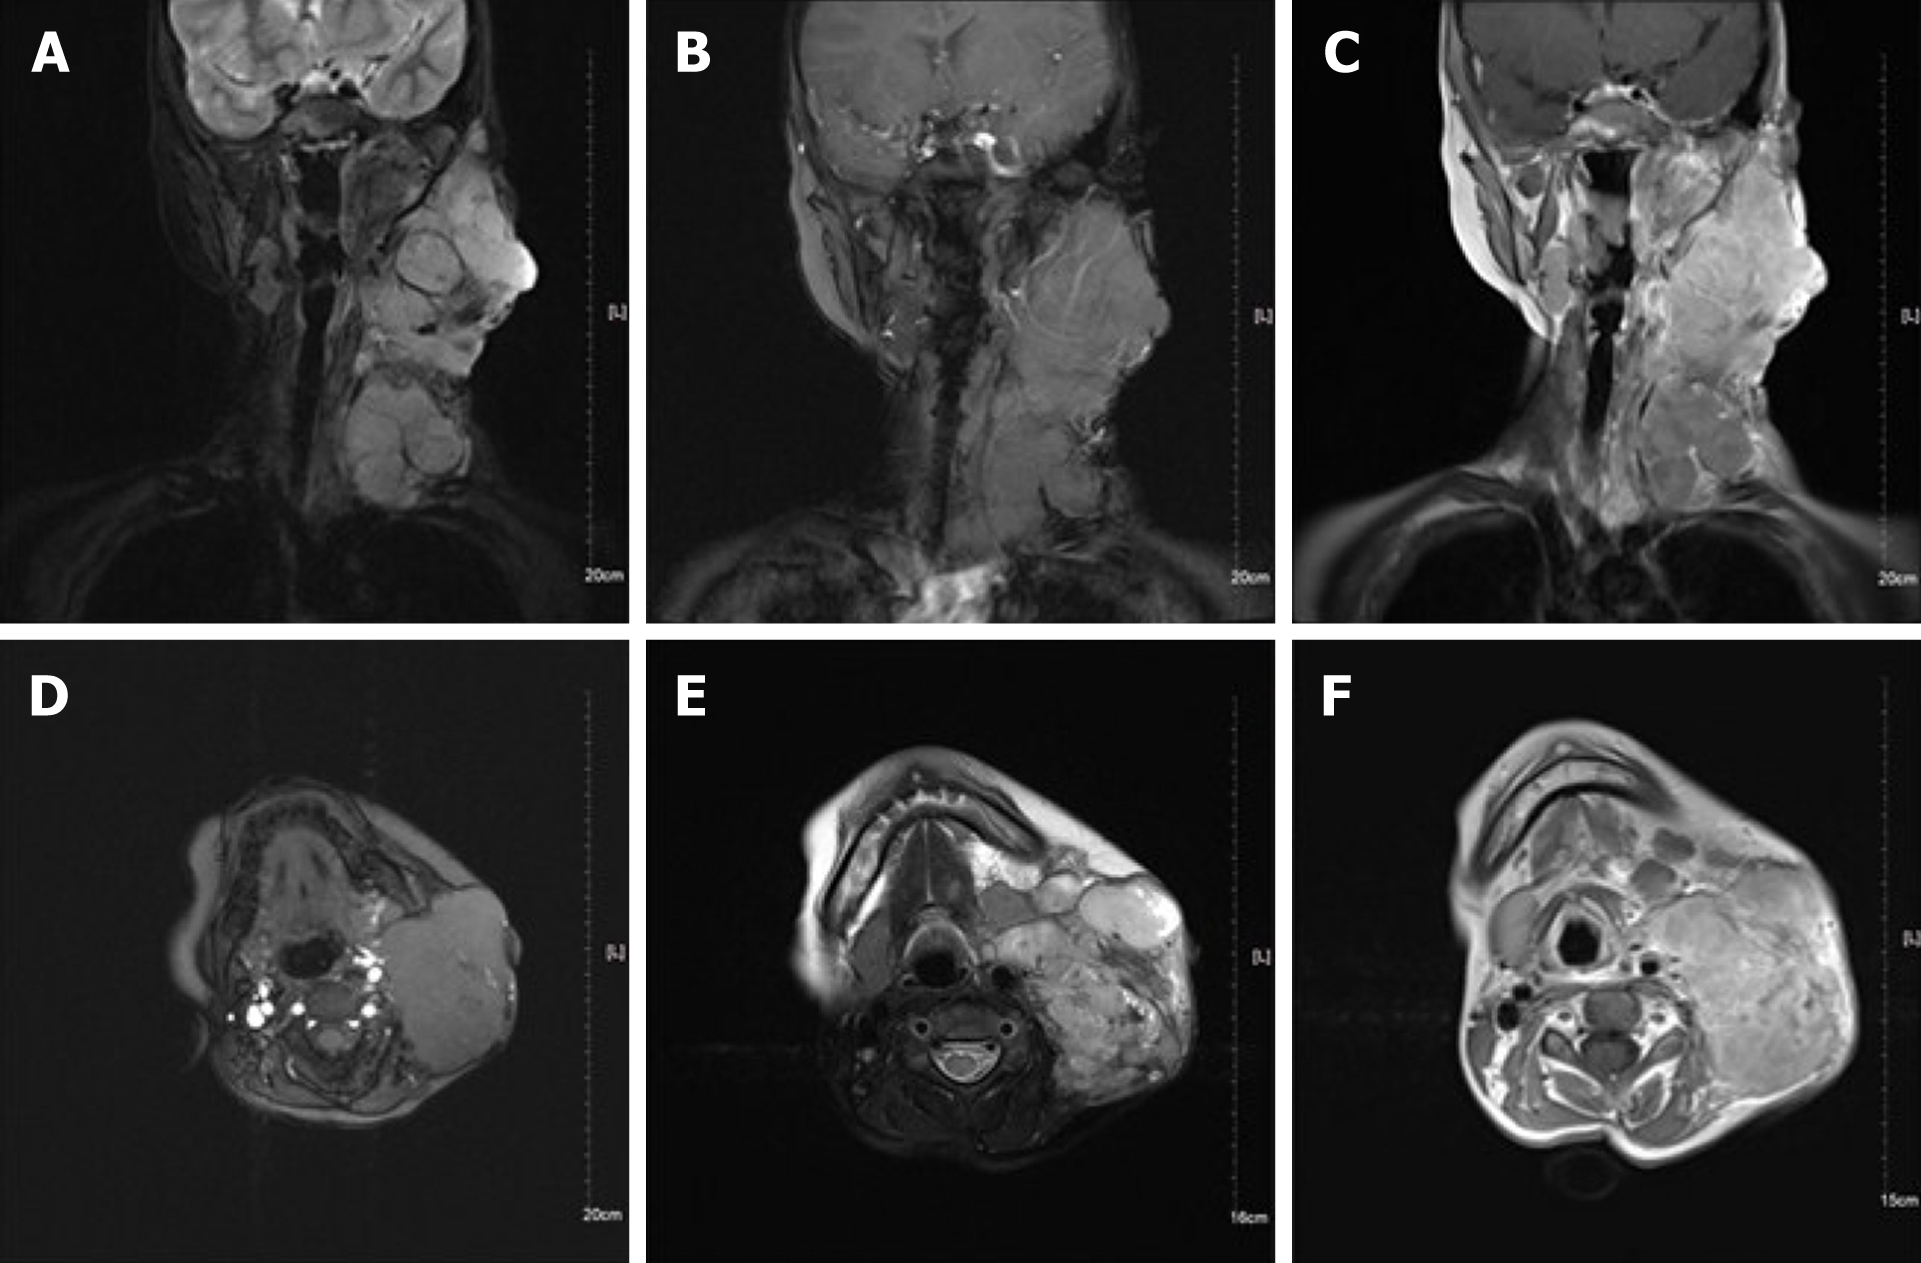
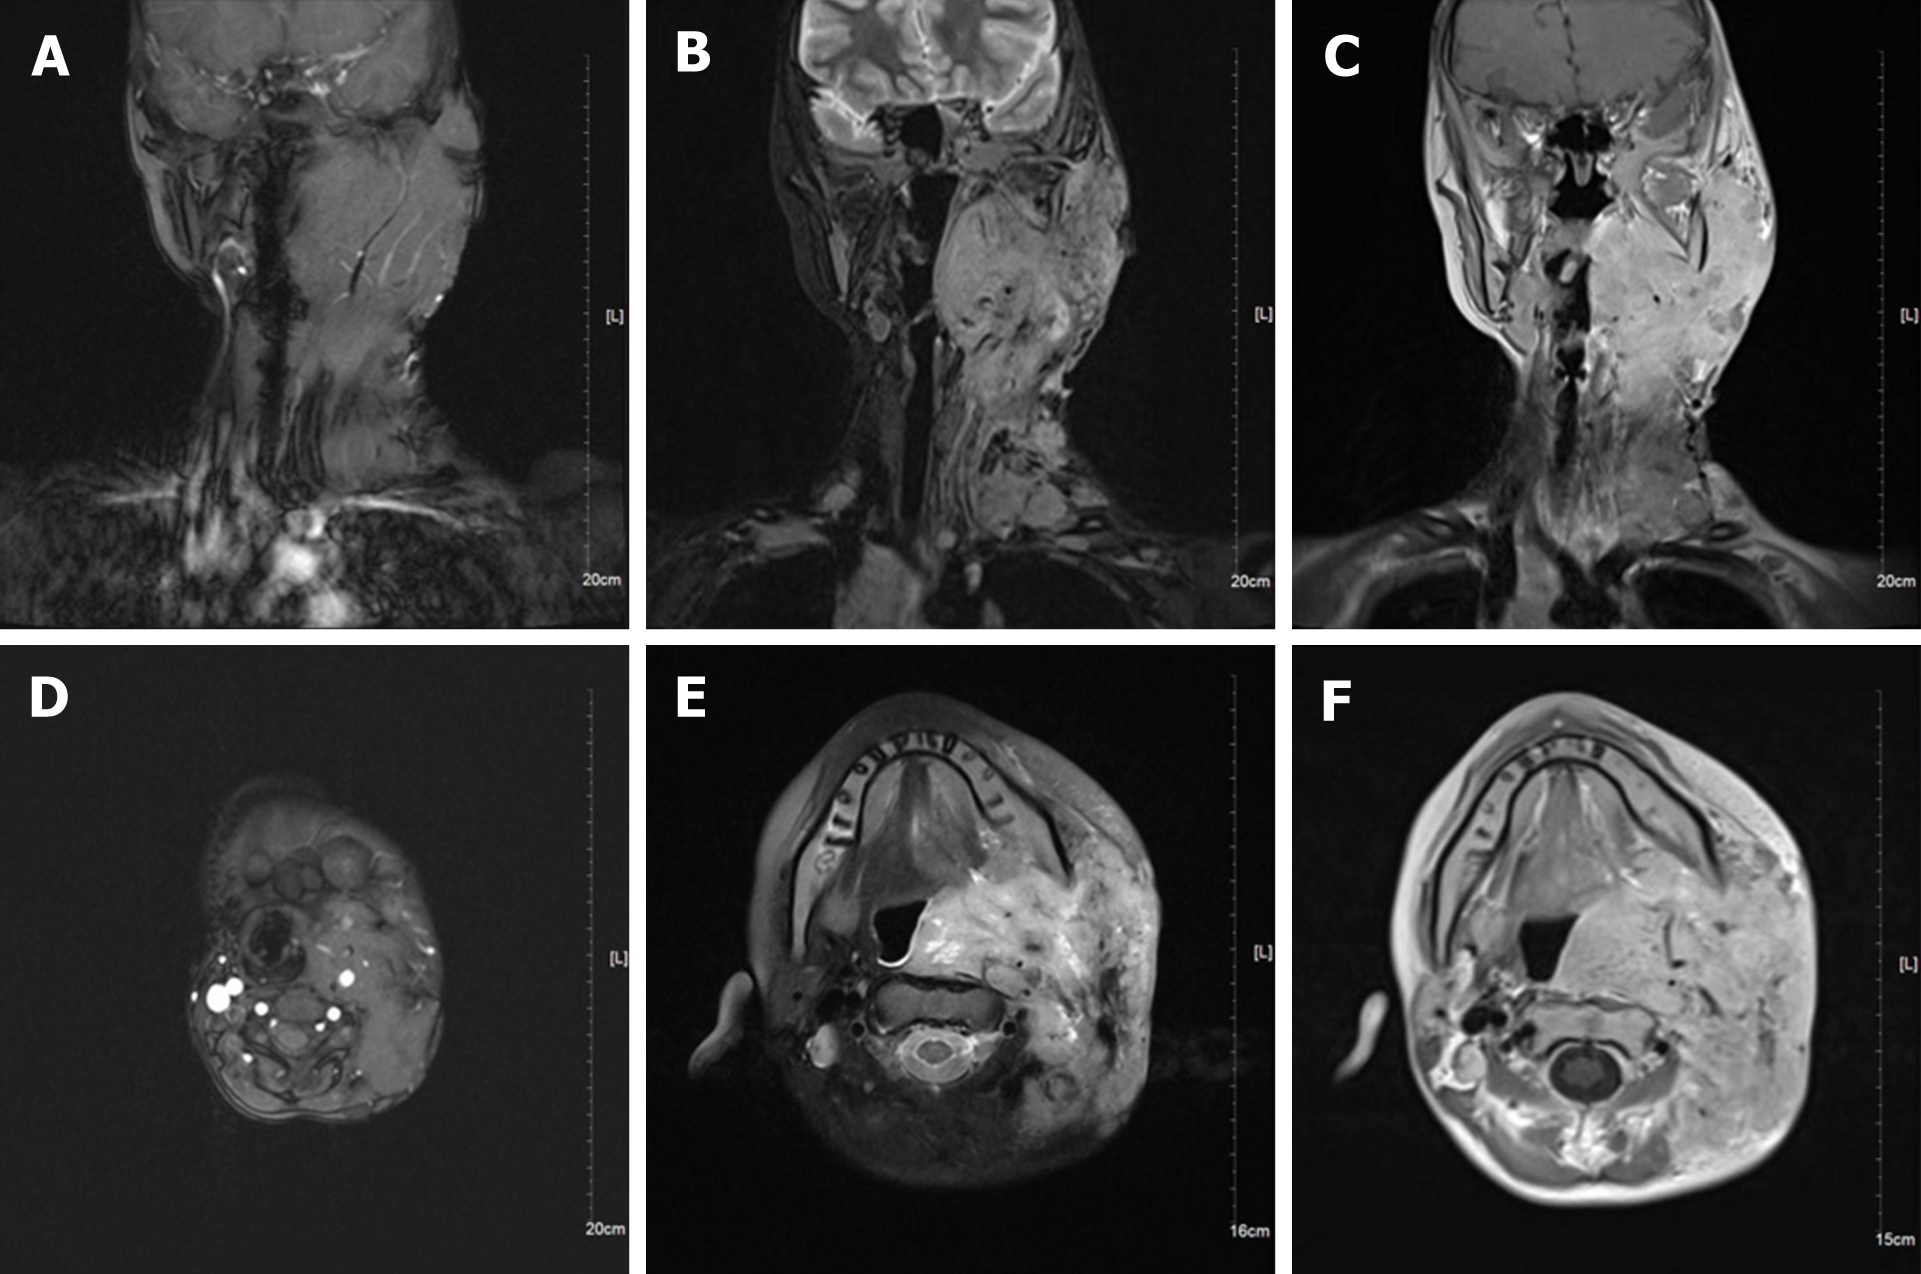
Figure 2 Neck magnetic resonance imaging.
A and D: Magnetic resonance imaging showed many round-like soft tissue masses of different sizes, with the largest measuring 6.5 cm × 5.9 cm × 8.1 cm, in the left parapharyngeal space, carotid sheath area, submandibular region, cervical root, supraclavicular fossa, and supraclavicular region. Some of the lesions fused into masses and the boundary was unclear, with low signal intensity on T1 weighted imaging; B and E: Round-like soft tissue masses showed high signal intensity on fat-suppressed T2 weighted imaging; C and F: The soft tissue mass showed high signal intensity on T2 weighted imaging.
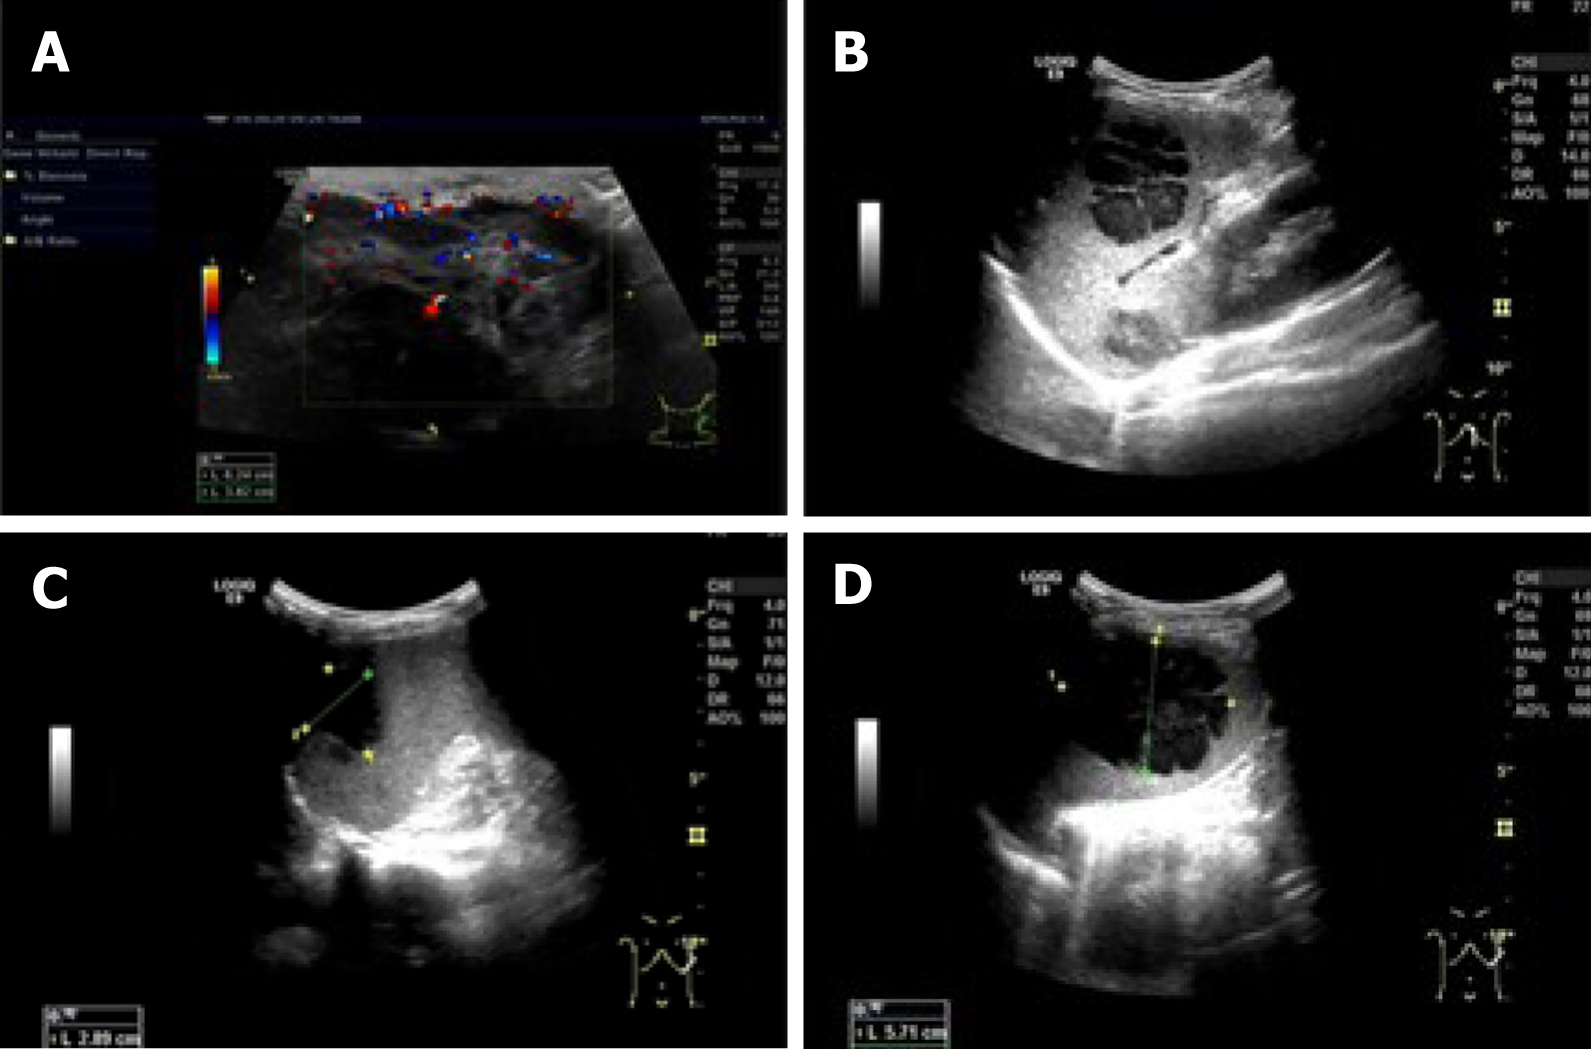
Figure 3 Ultrasonography.
A: Color Doppler ultrasonography of cervical lymph nodes showed multiple hypoechoic masses in the left neck, with unclear boundaries, irregular shape, and uneven internal echoes. CDFI showed abundant strip blood flow signals; B-D: Abdominal ultrasound showed that there were several hypoechoic masses in the spleen, the boundary was clear, the shape was irregular, the internal echo was uneven, and several separated echoes could be seen.
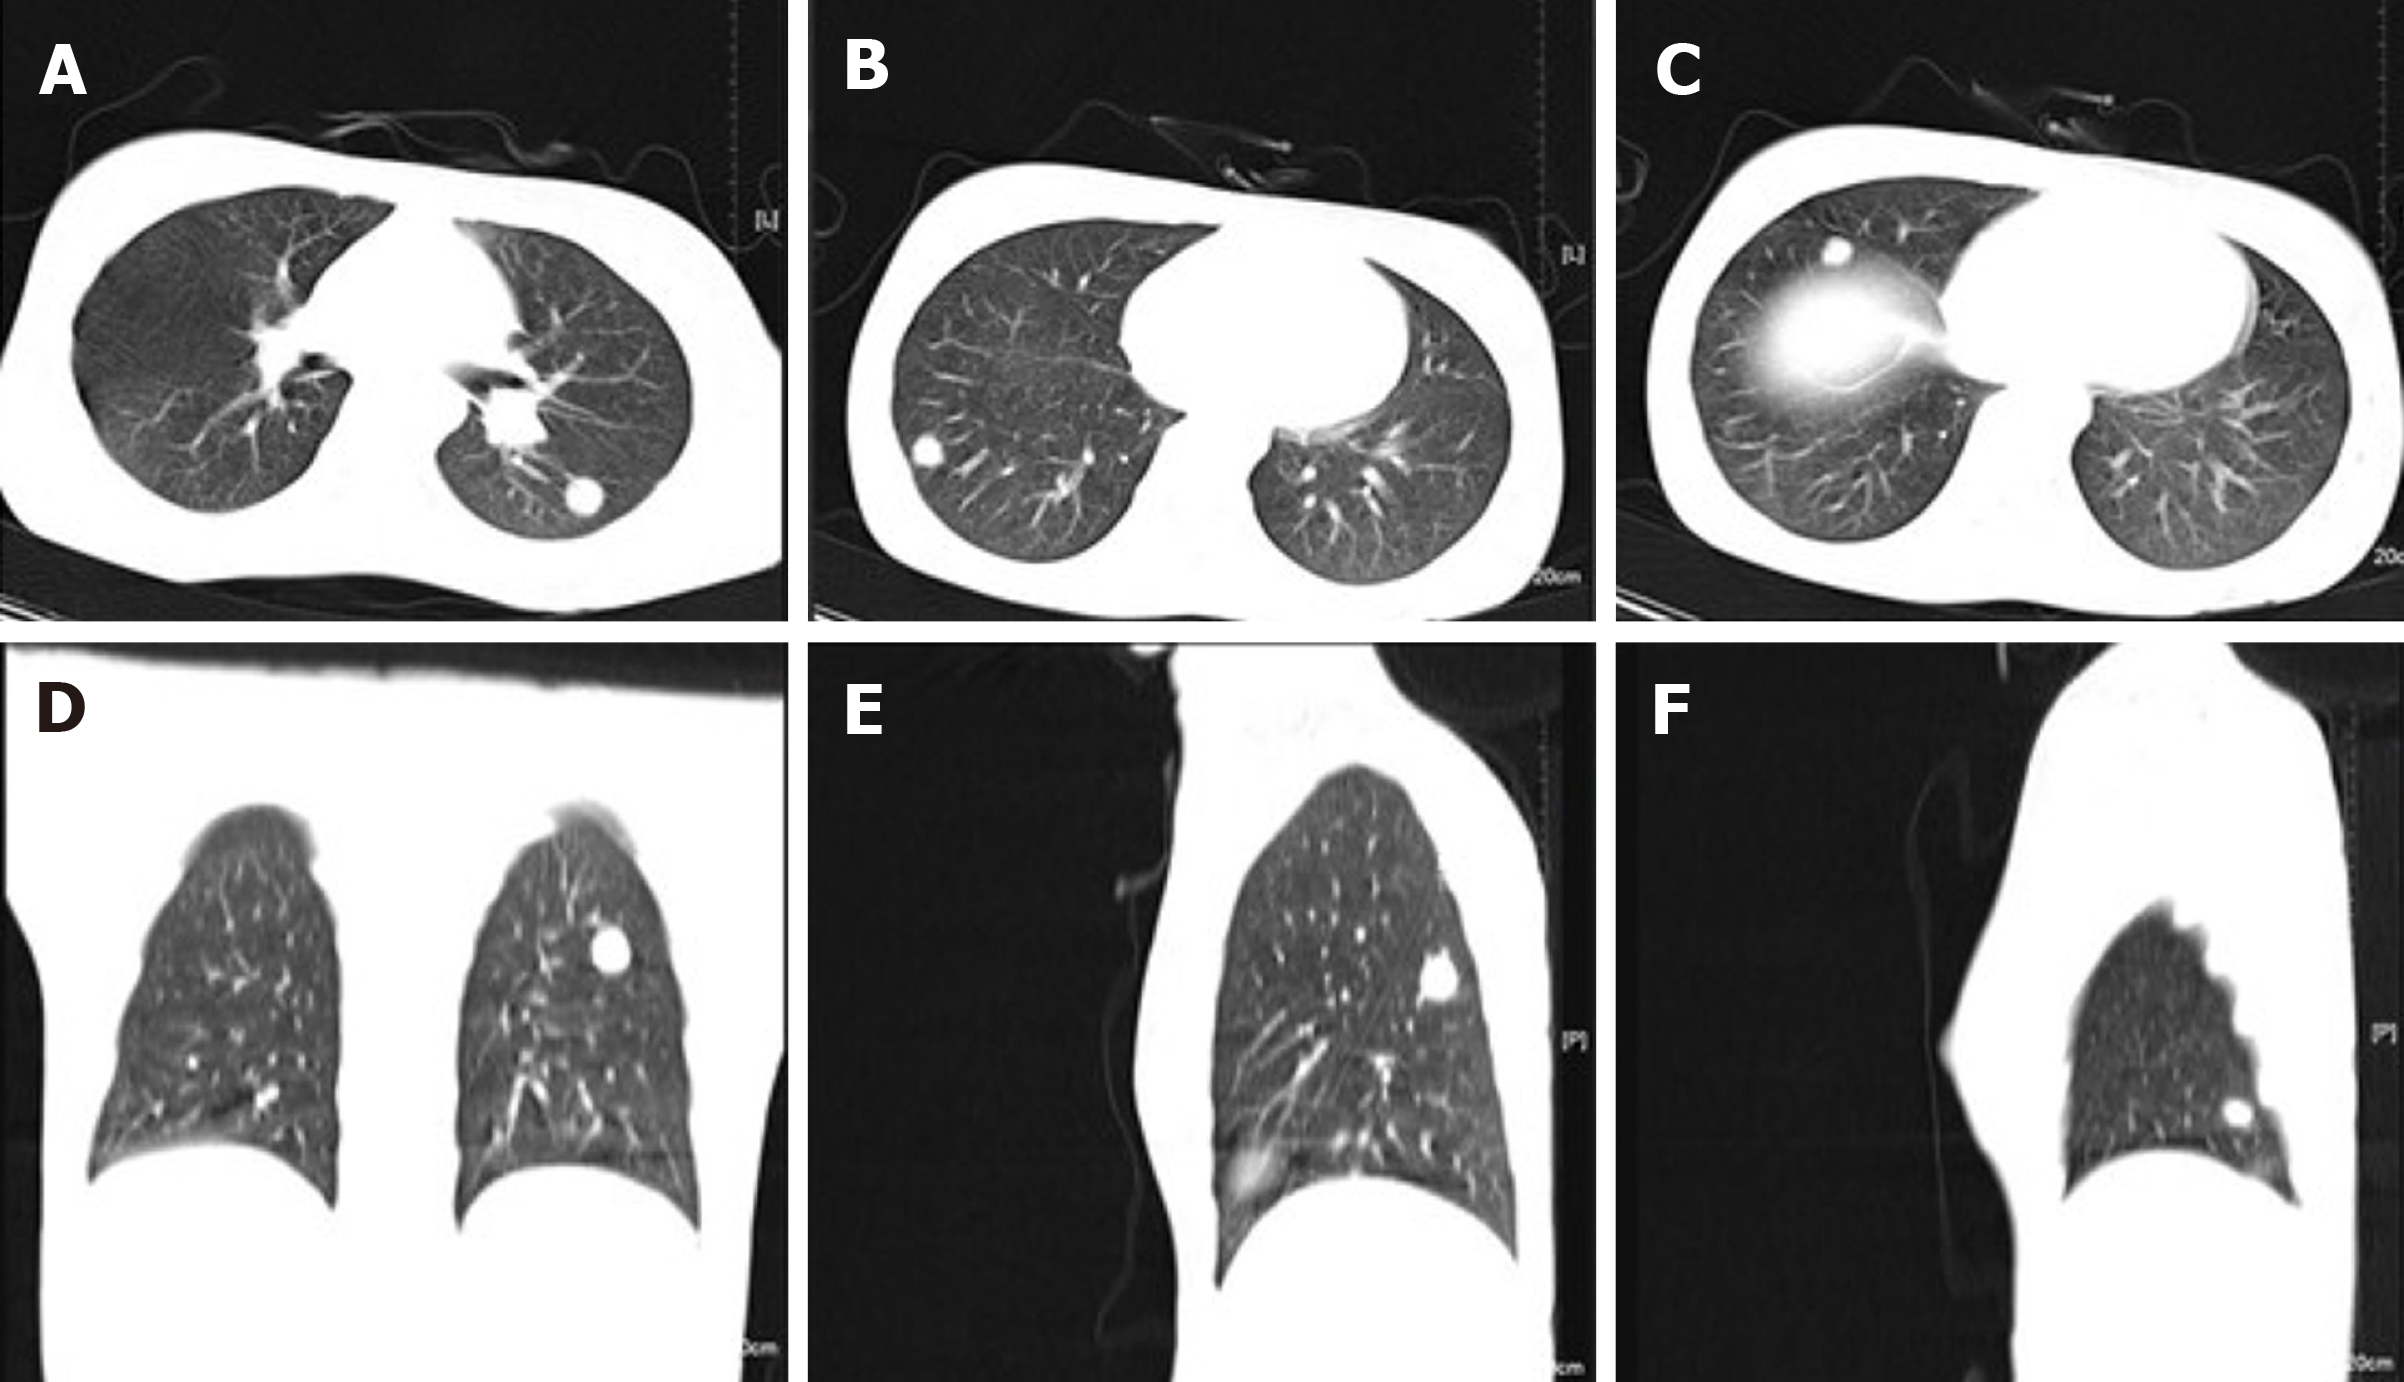
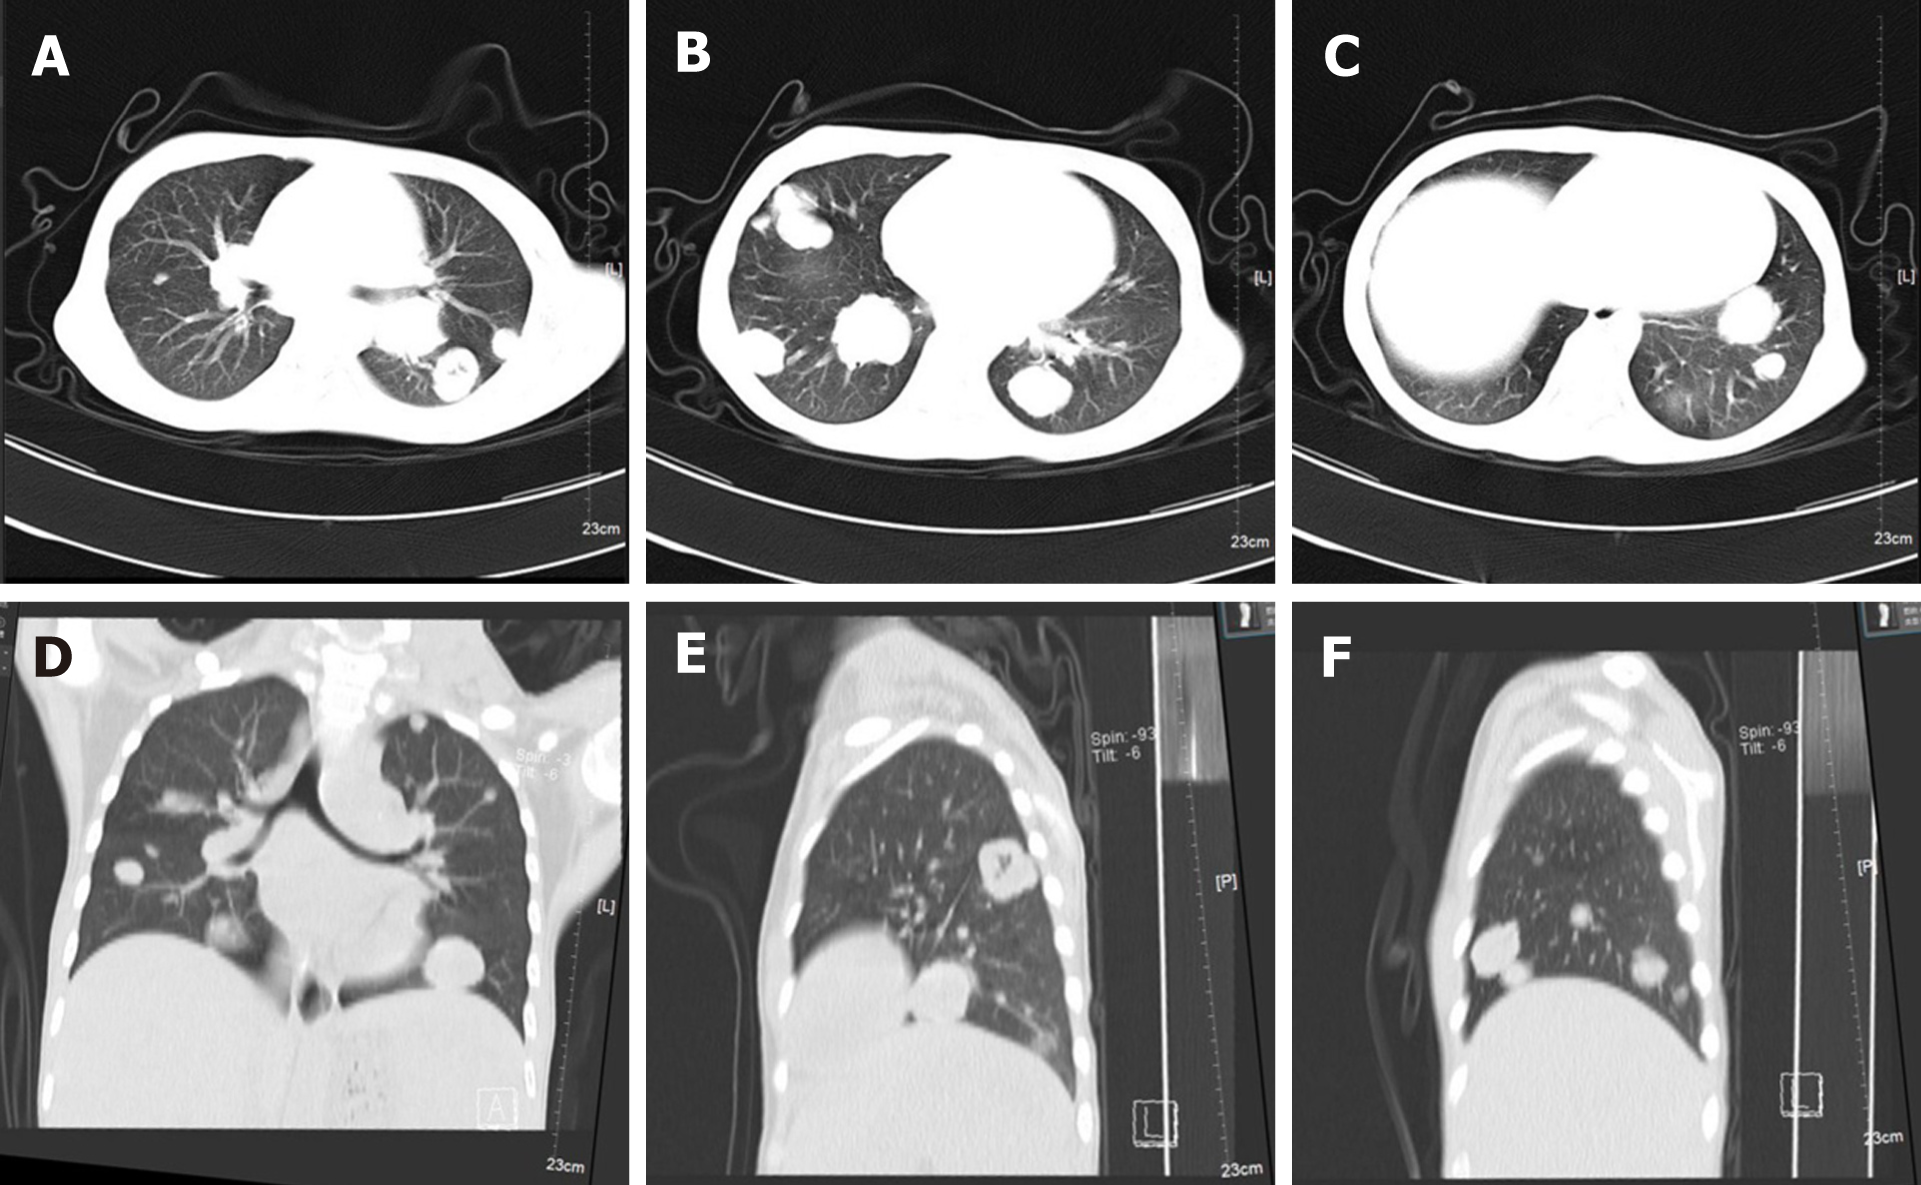
Figure 4 Computed tomography of the lungs.
A: The largest nodule was located in the upper segment of the left lower lung with a diameter of approximately 1.2 cm; A, D, and E: There were different size of nodules in the left lung; B, C, and F: There were multiple nodules of different sizes scattered in the right lung; A-F: All nodules had clear boundaries and uniform internal density, with an average computed tomography value of about 60 HU.
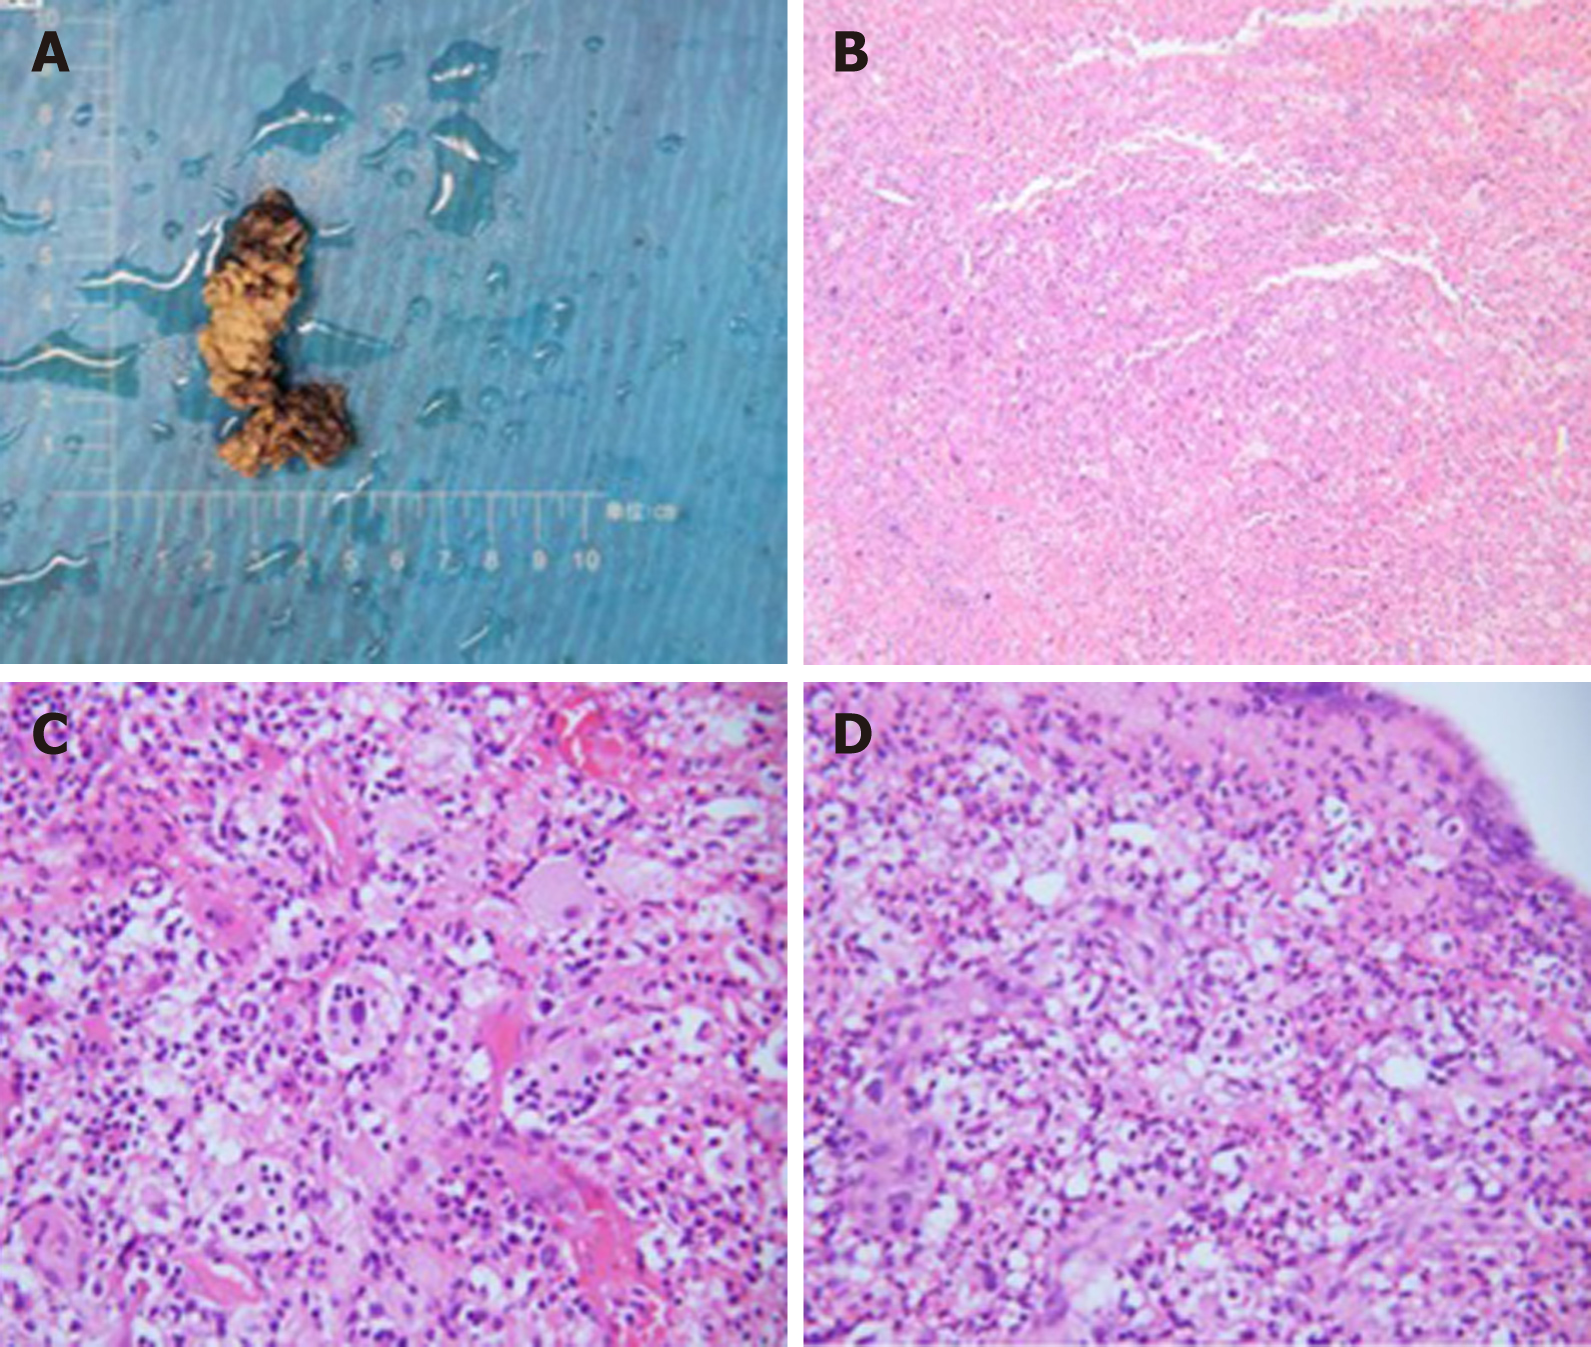
Figure 5 Pathological images.
A: The specimen taken from the operation was about 6 cm long and about 2 cm wide; B: The pathological image at low magnification (40 ×); C and D: Pathological images at high magnification (C: 400 ×; D: 200 ×). Phagocytosis of intact neutrophils, lymphocytes, and plasma cells could be seen in some cells.
Figure 6 After 9 mo (February 2021), the ulcer in the left neck was better than before, and no purulent secretion was found.
Figure 7 Computed tomography of the lung after 9 mo.
A, E, and F: Compared with the same site 9 mo ago, the nodules were significantly larger and the number of nodules increased; B: The largest nodule was located in the right lower lung with a diameter of about 3.3 cm; D: The bilateral pulmonary nodules were significantly increased and enlarged; A-F: The boundaries of all nodules were clear, and the internal density of some nodules was uneven. The average computed tomography value was about 21-45 HU.
Figure 8 Neck magnetic resonance imaging after 9 mo.
A and D: Magnetic resonance imaging (MRI) showed multiple round-like soft tissue masses of different sizes in the left parapharyngeal space, carotid sheath area, submandibular region, cervical root, supraclavicular fossa, and supraclavicular region. Most of the lesions were fused into masses (the largest was 6.9 cm × 9.0 cm × 12 cm), with low signal intensity on T1-weighted images; B and E: The manifestation of the tumor on fat-suppressed T2 weighted imaging; C and F: The soft tissue mass showed high signal intensity on T2 weighted imaging. A-F: The boundary of the tumor was not clear, and the scope of the tumor was significantly larger than that of the cervical MRI 9 mo ago.
- Citation: Wu GJ, Li BB, Zhu RL, Yang CJ, Chen WY. Rosai-Dorfman disease with lung involvement in a 10-year-old patient: A case report. World J Clin Cases 2021; 9(17): 4285-4293
- URL: https://www.wjgnet.com/2307-8960/full/v9/i17/4285.htm
- DOI: https://dx.doi.org/10.12998/wjcc.v9.i17.4285


