Copyright
©The Author(s) 2020.
World J Clin Cases. Mar 6, 2020; 8(5): 854-863
Published online Mar 6, 2020. doi: 10.12998/wjcc.v8.i5.854
Published online Mar 6, 2020. doi: 10.12998/wjcc.v8.i5.854
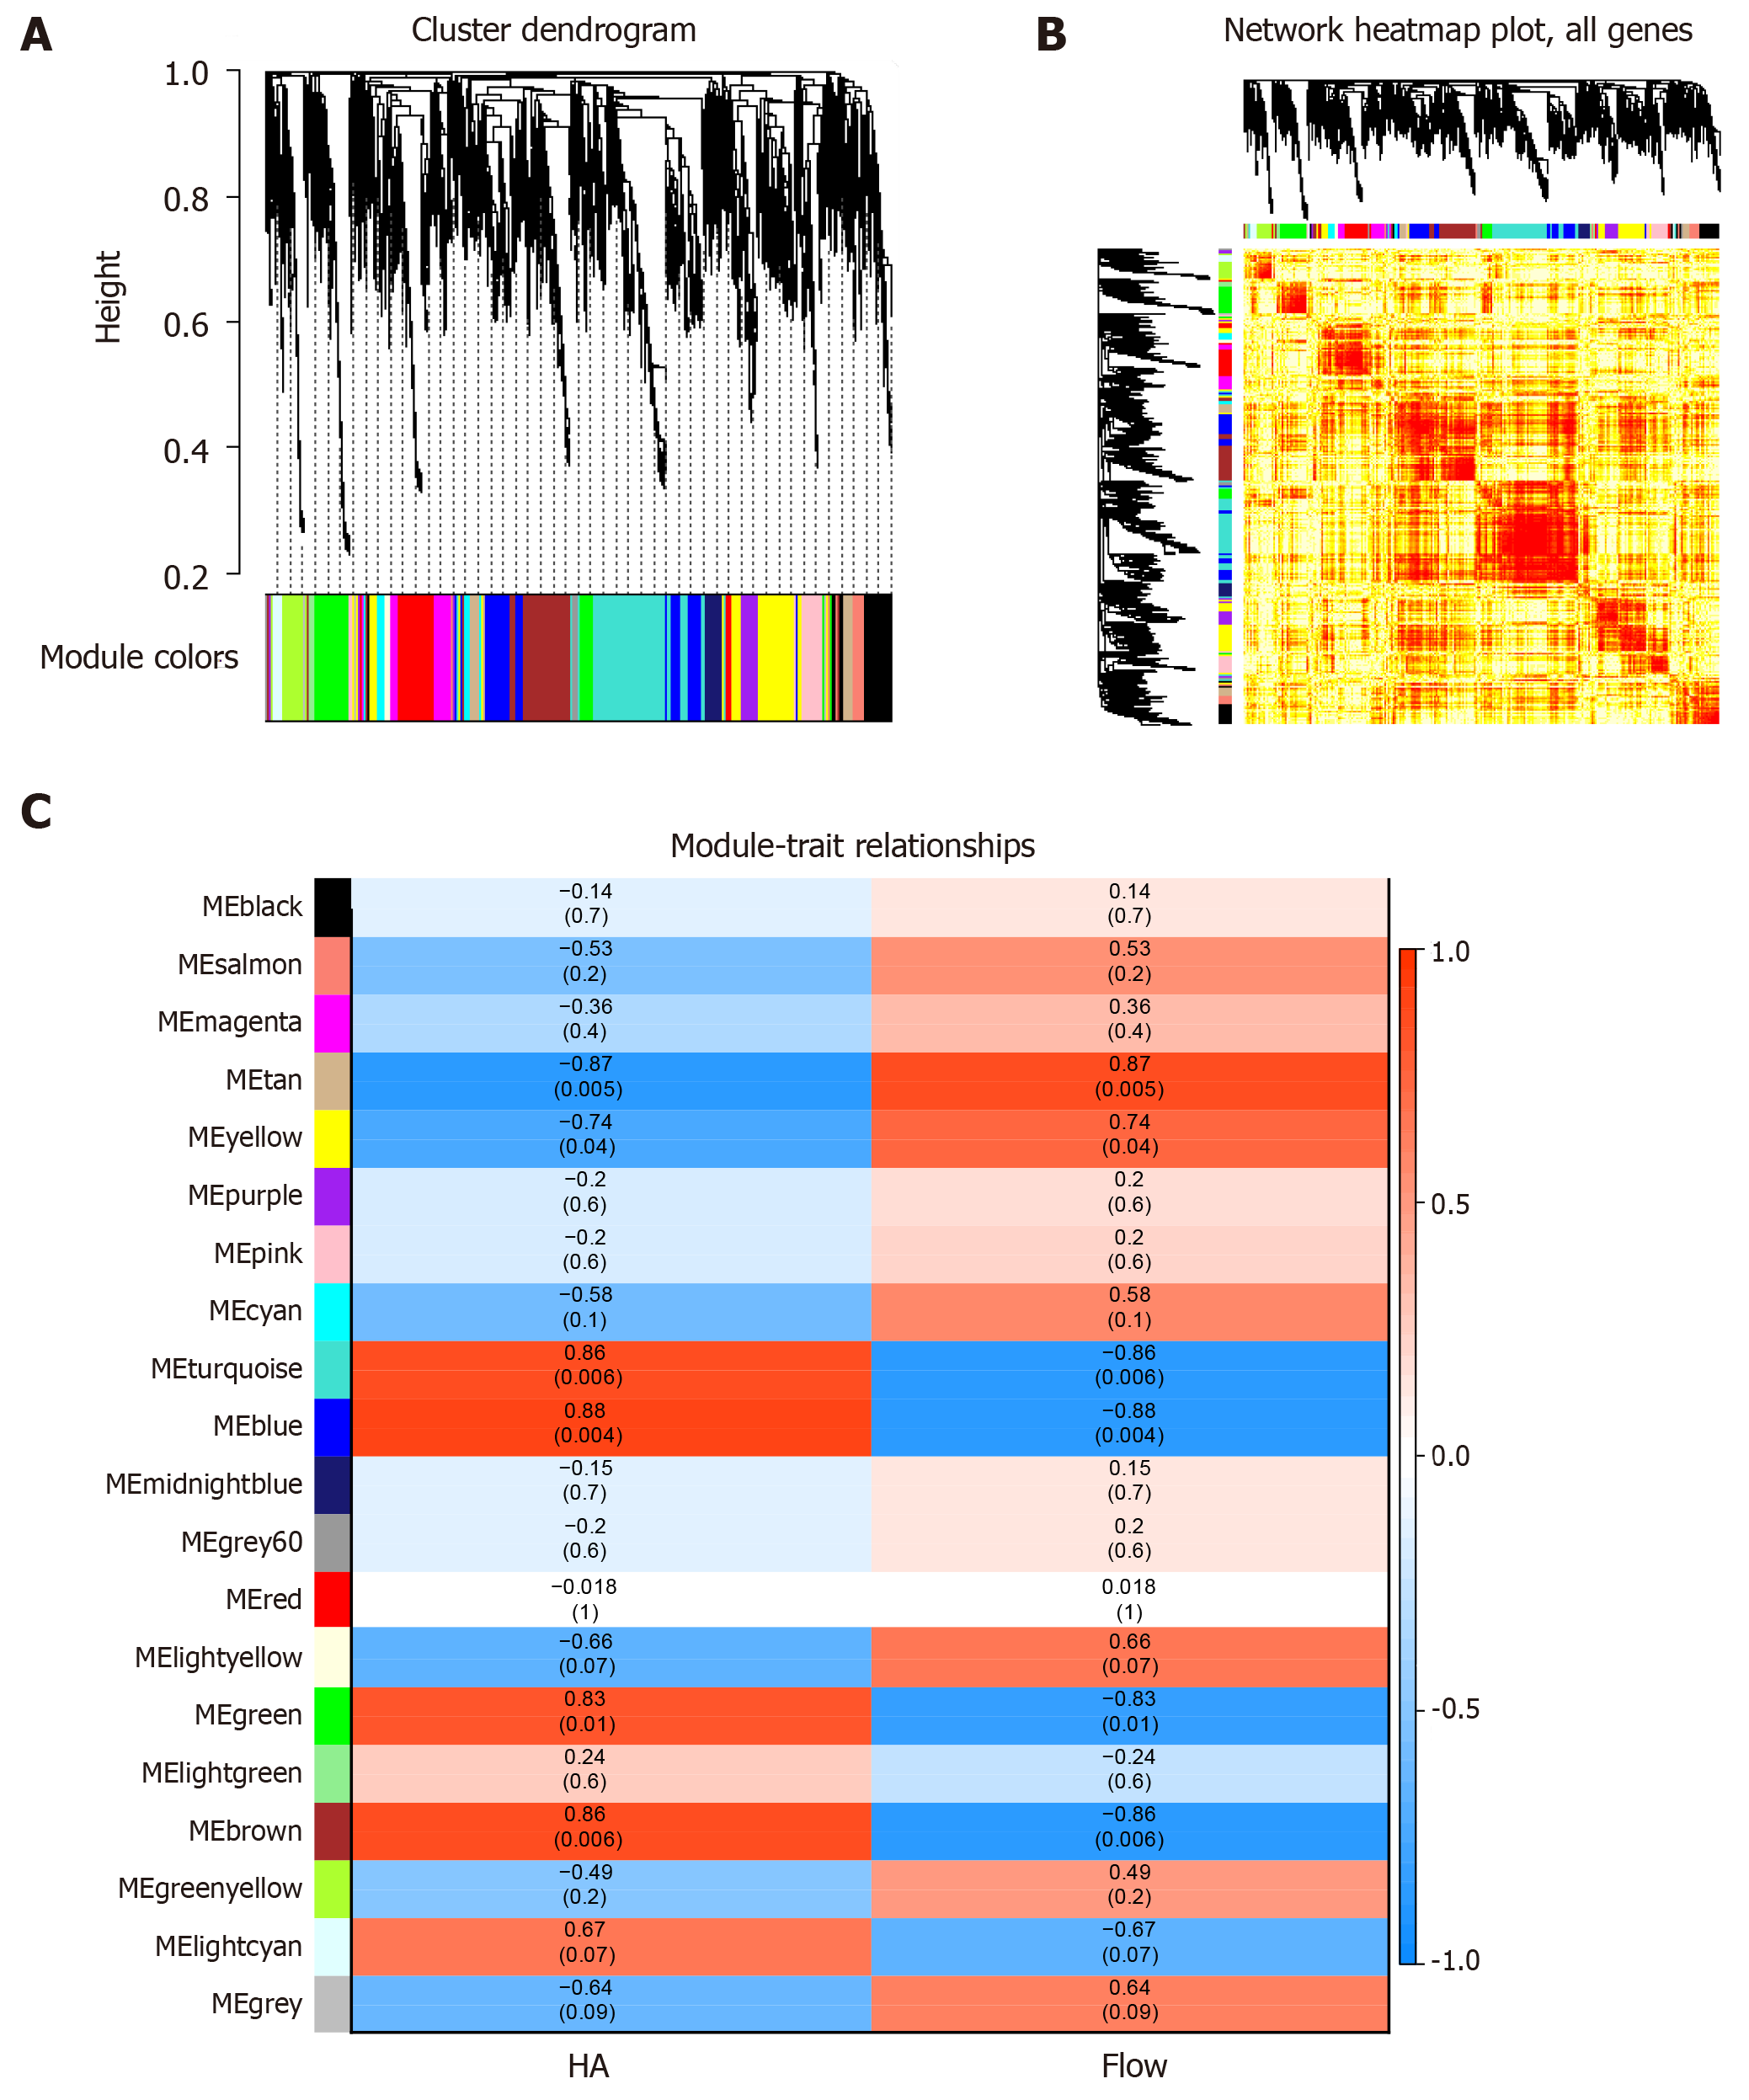
Figure 1 Synergistic expression of differentially expressed genes in patients with spinal cord injury.
A: Nineteen expression groups were identified as modules, and nineteen colors represented nineteen expression modules; B: The expression thermograms of all genes in the samples were clustered into 19 expression modules; C: Each row represents a module, and each column represents a phenotype. The color of each cell is mapped by the corresponding correlation coefficient. The values range from - 1 to 1, and the color changes from blue to white, then to red. The deeper the color, the stronger the correlation.
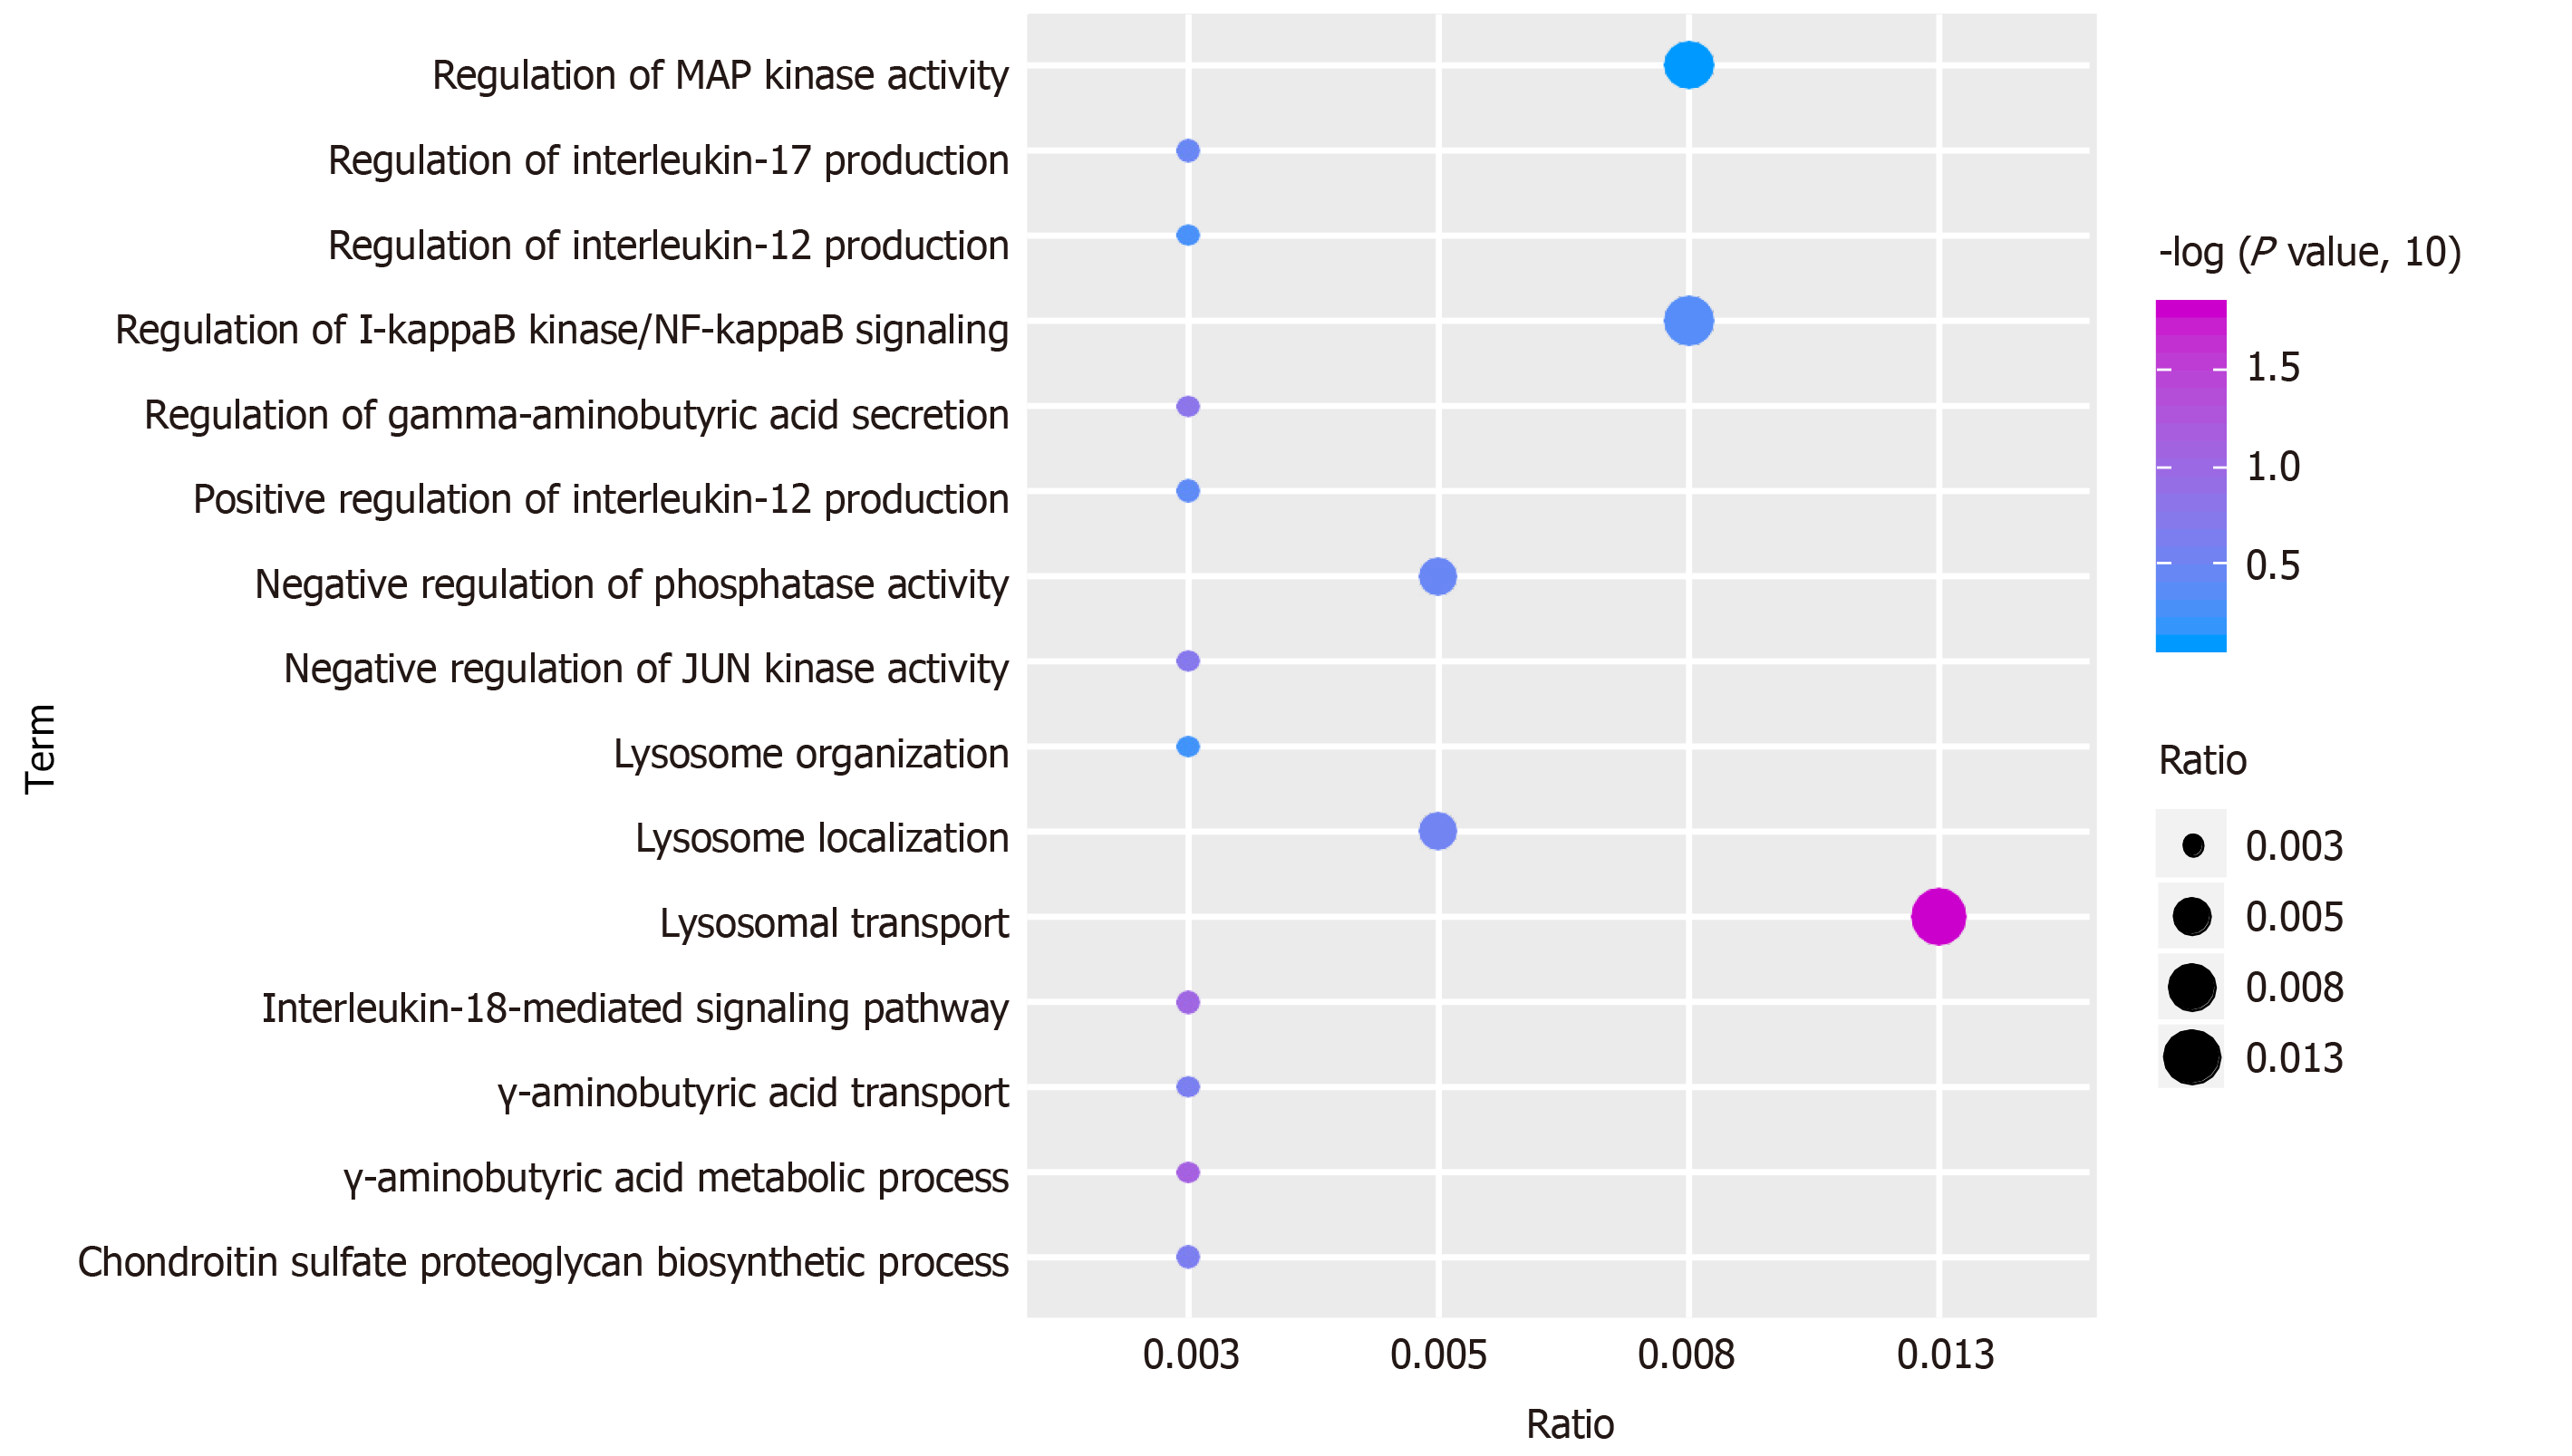
Figure 2 Functional and pathway enrichment analysis of modular genes.
GO functional enrichment analysis of module genes (excerpts). From blue to purple, the enrichment increased significantly. The larger the circle, the larger the proportion of module genes in GO functional entry genes.
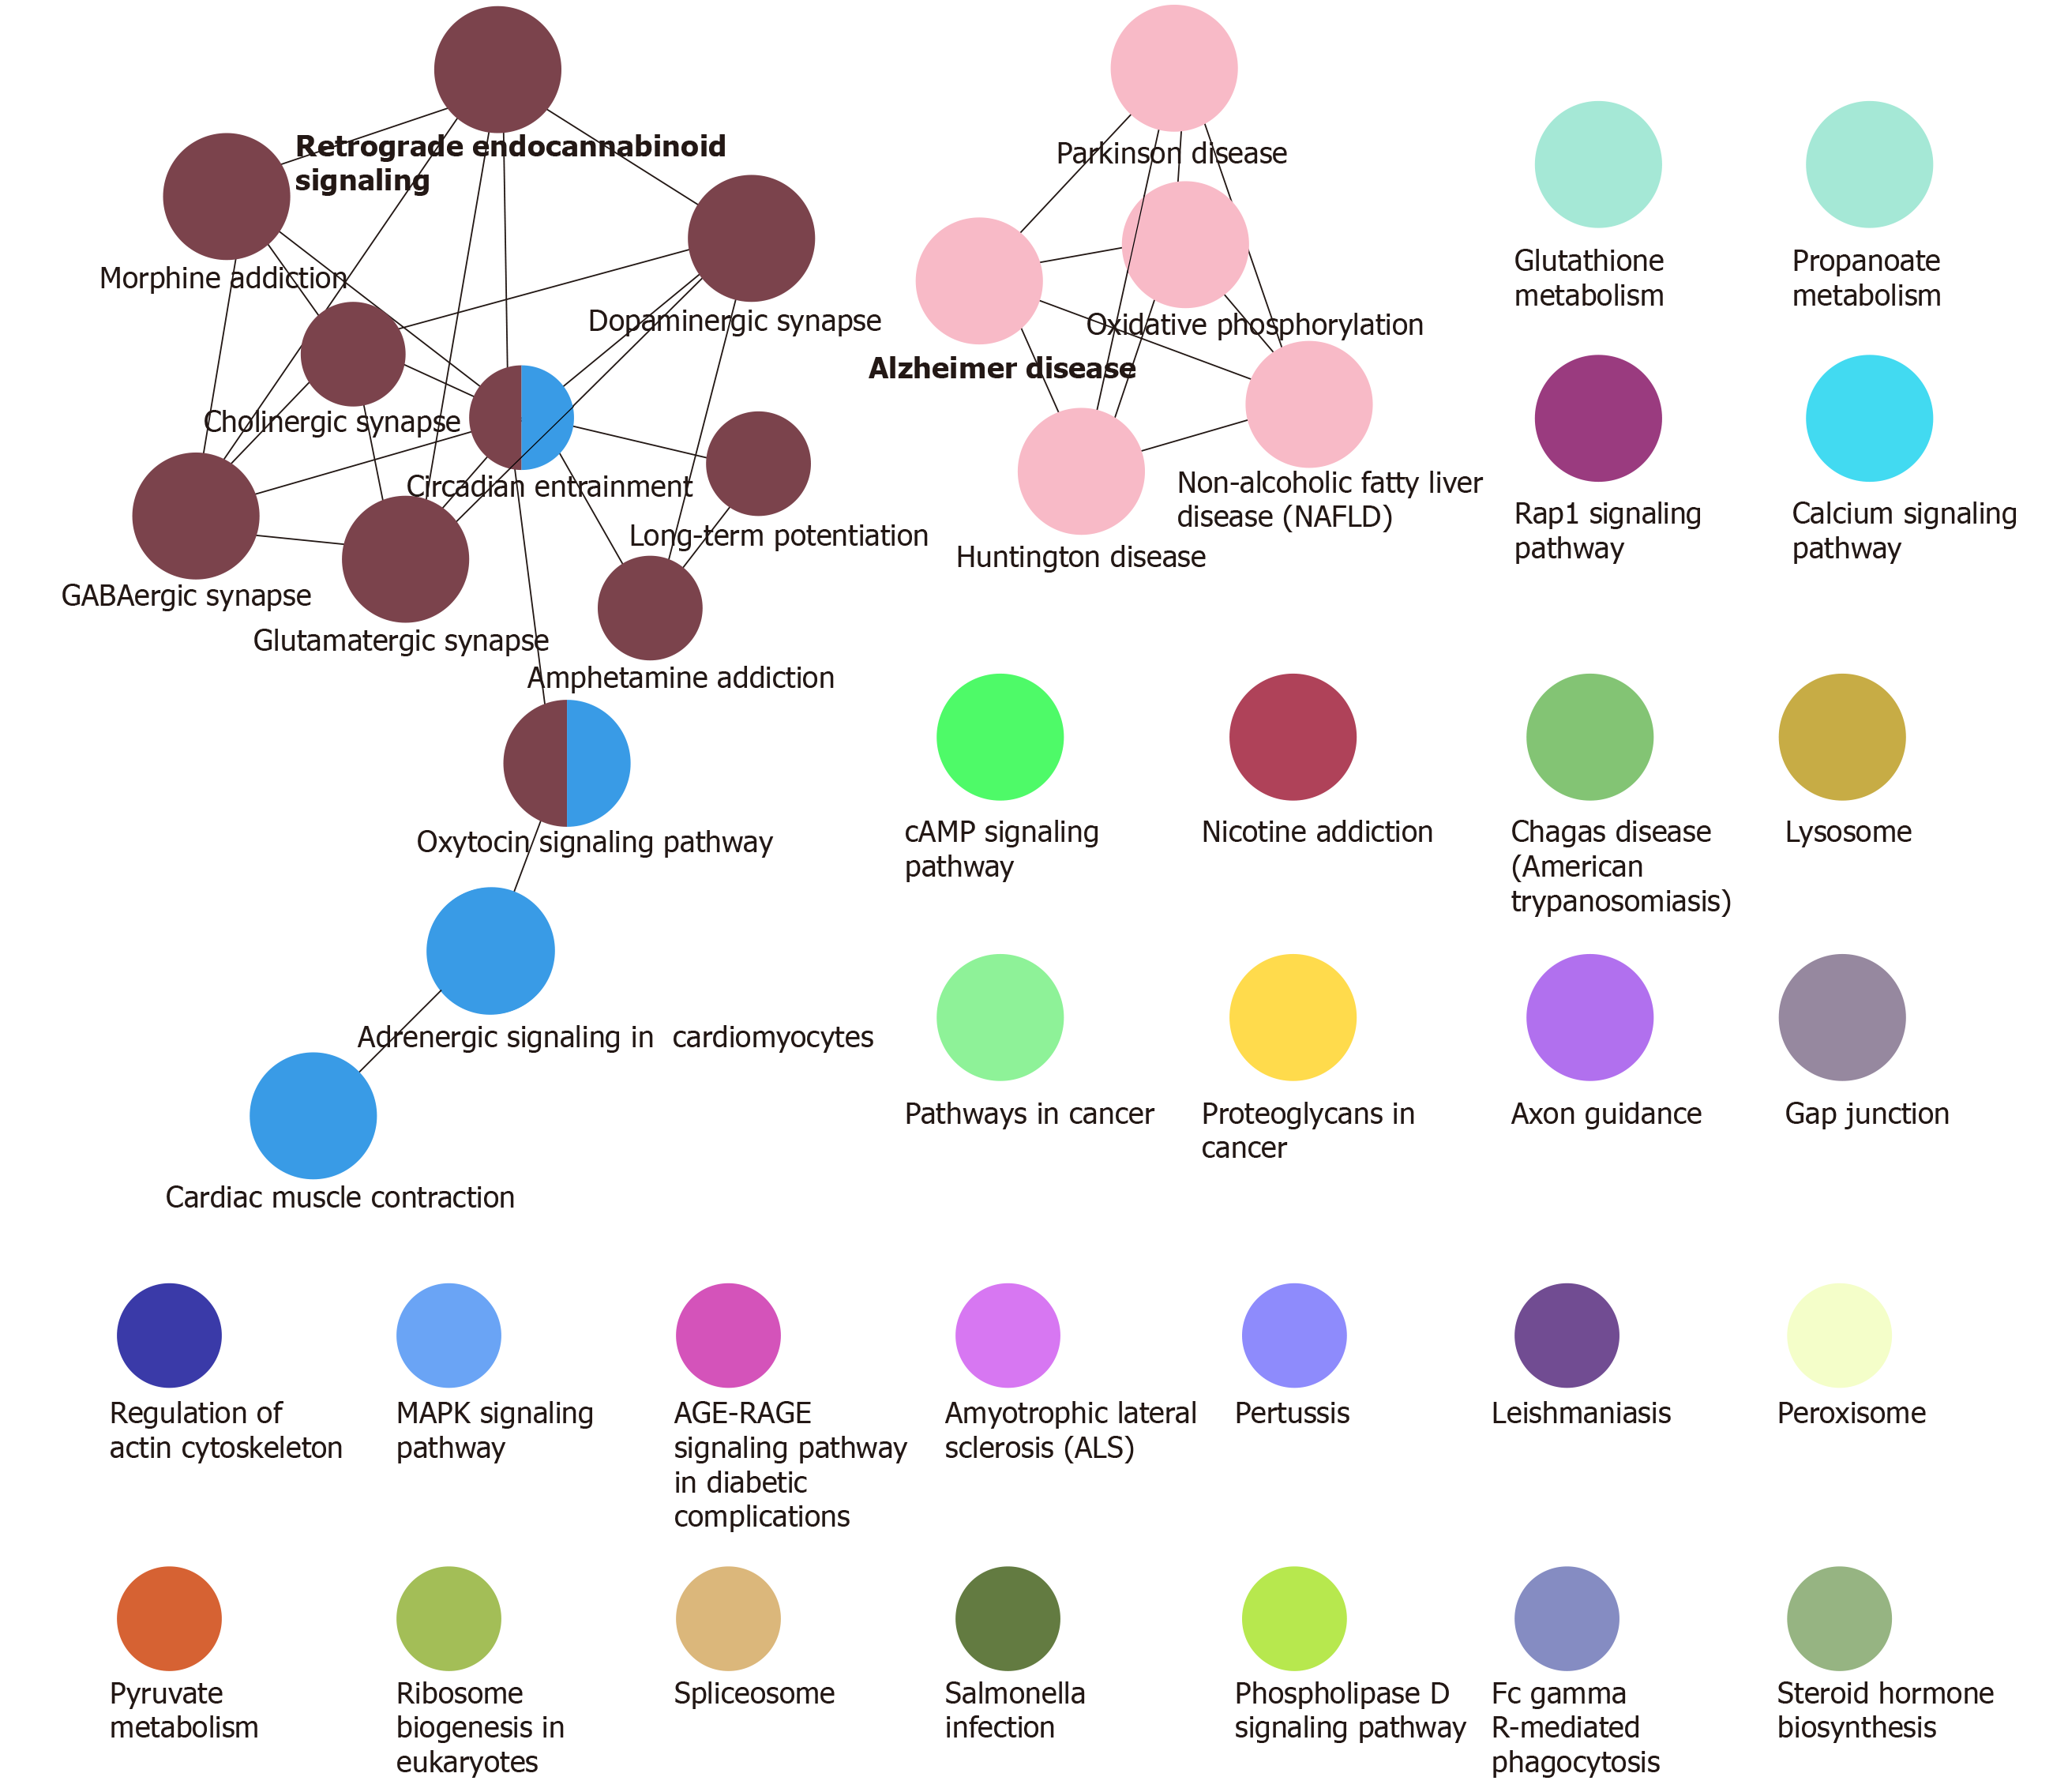
Figure 3 Path analysis of the integrated module network.
- Citation: Liu XY, Guo JW, Kou JQ, Sun YL, Zheng XJ. Repair mechanism of astrocytes and non-astrocytes in spinal cord injury. World J Clin Cases 2020; 8(5): 854-863
- URL: https://www.wjgnet.com/2307-8960/full/v8/i5/854.htm
- DOI: https://dx.doi.org/10.12998/wjcc.v8.i5.854


