Copyright
©The Author(s) 2020.
World J Clin Cases. Dec 6, 2020; 8(23): 6122-6129
Published online Dec 6, 2020. doi: 10.12998/wjcc.v8.i23.6122
Published online Dec 6, 2020. doi: 10.12998/wjcc.v8.i23.6122
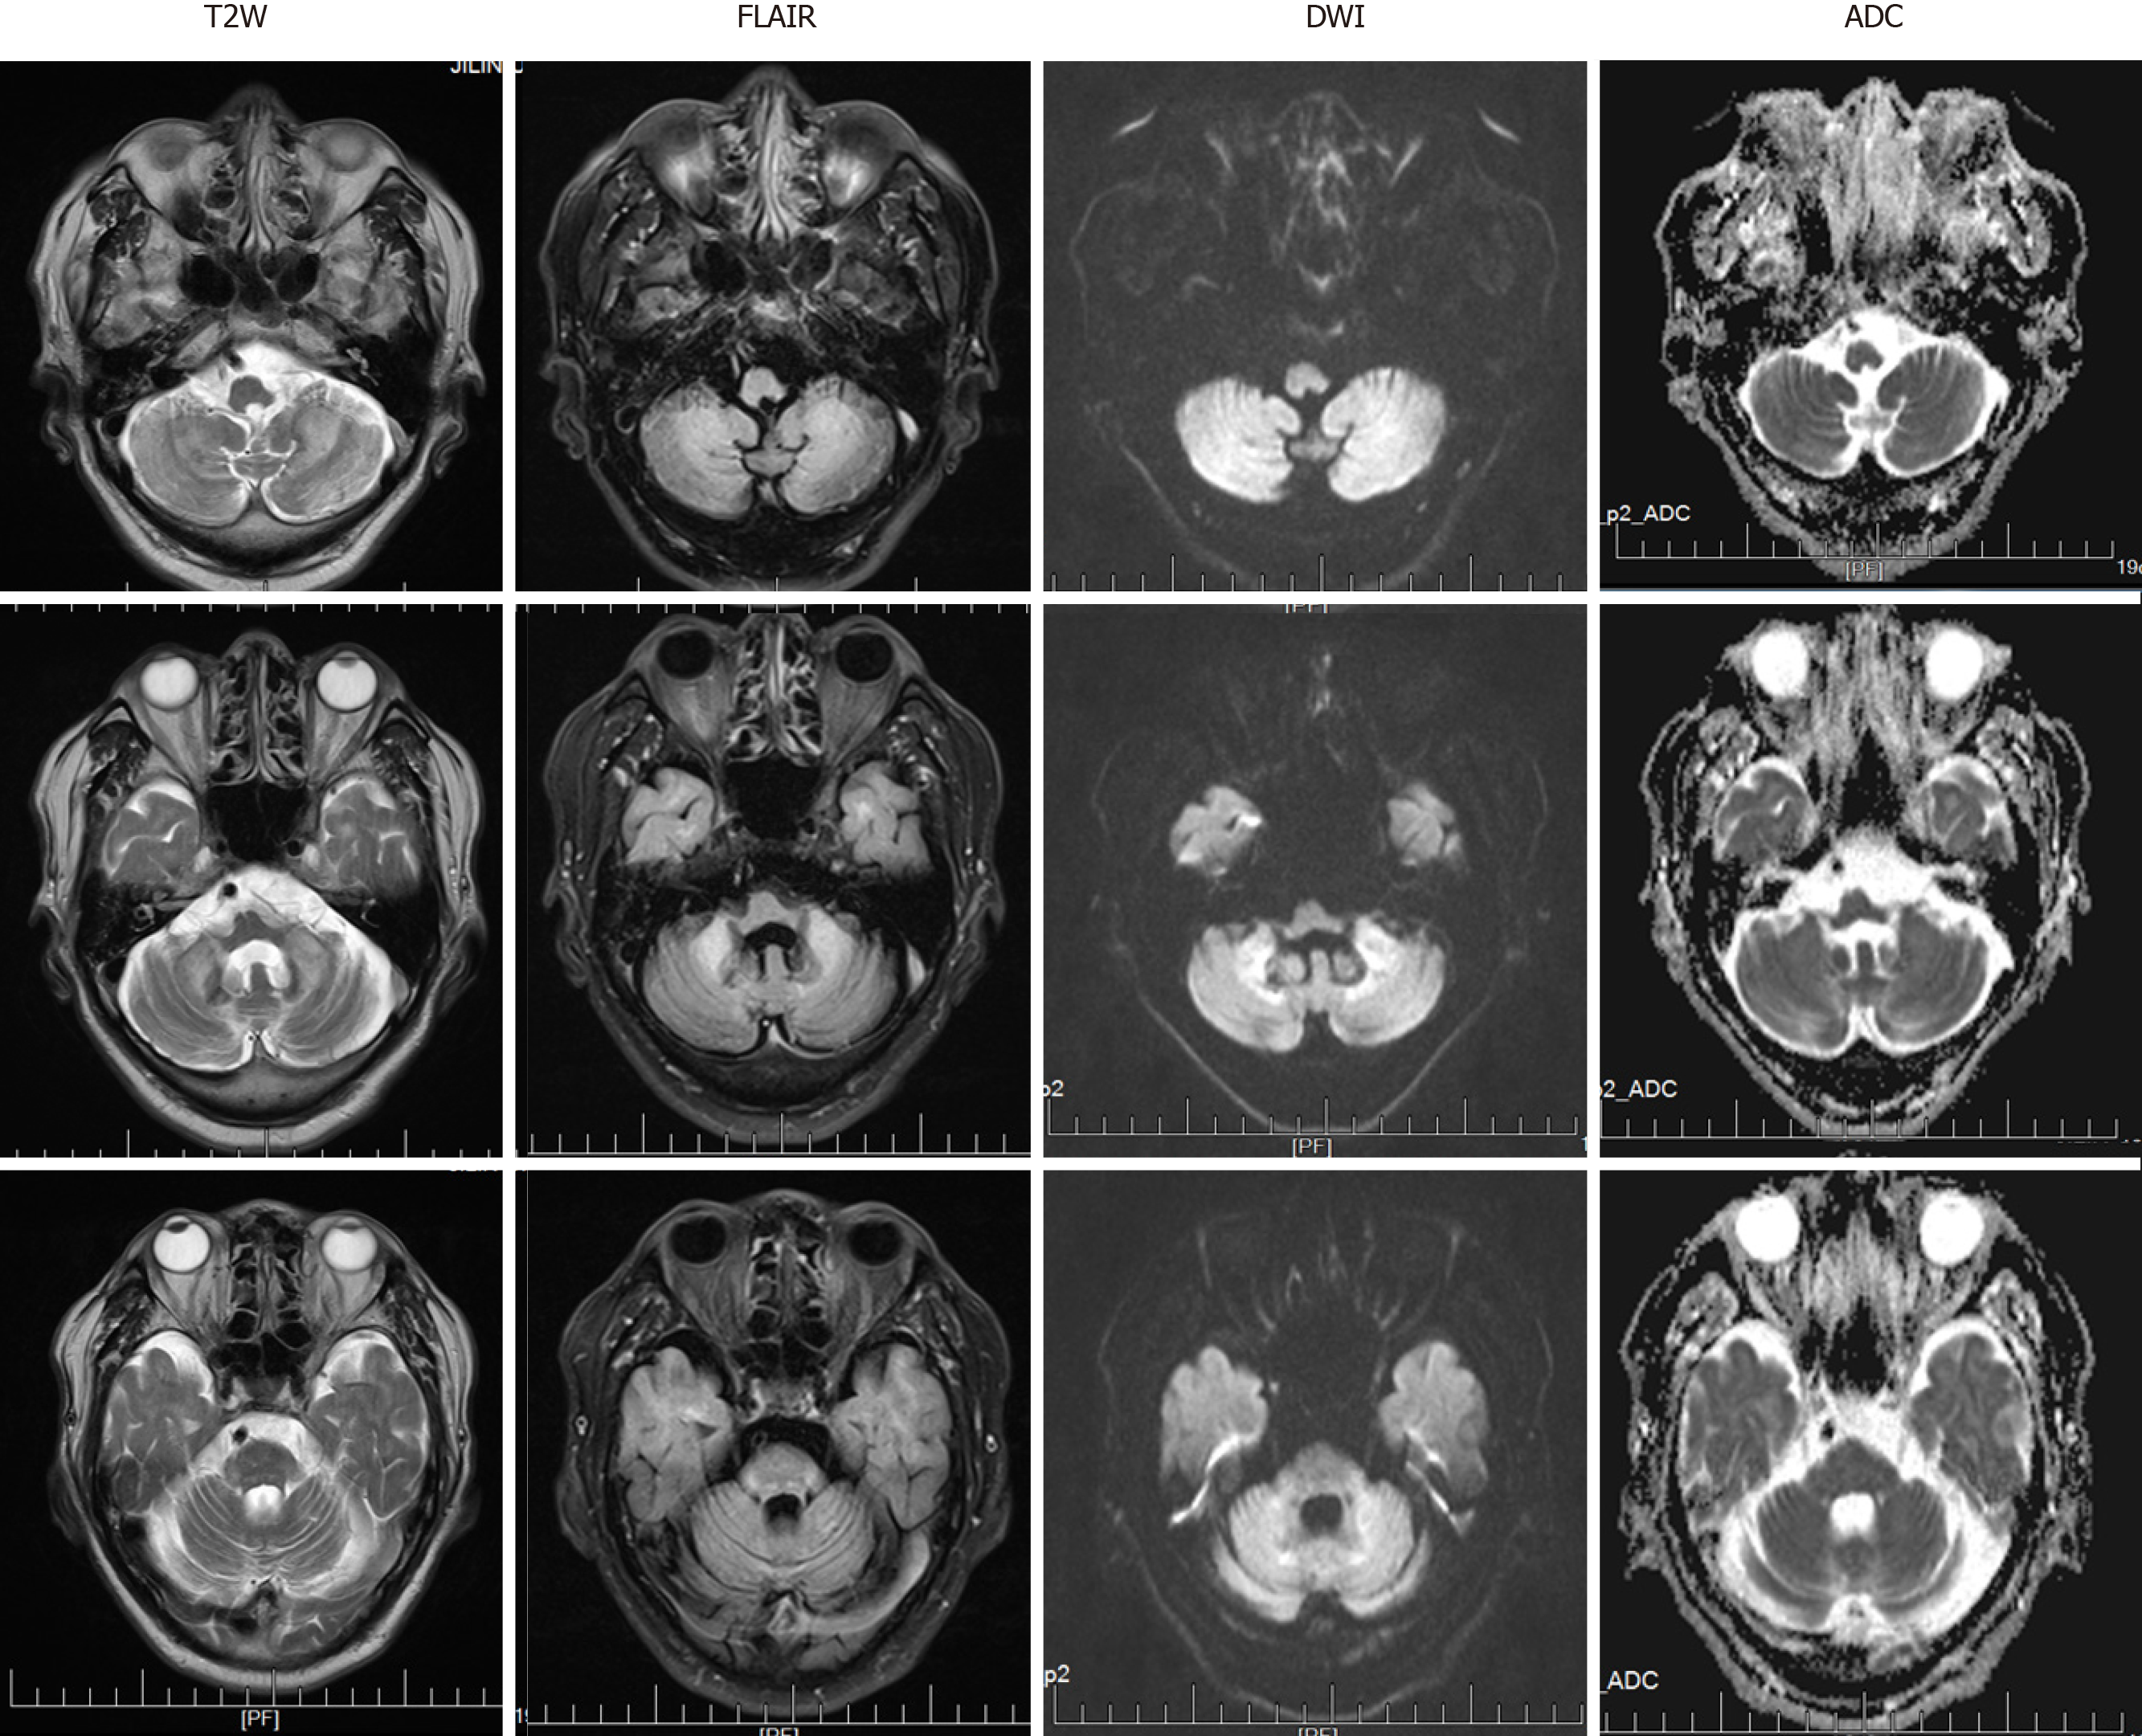
Figure 1 Magnetic resonance imaging obtained at the level of the cerebellum.
Bilateral high signal intensities in the cerebral hemispheres and middle cerebellar peduncle are visible. Cerebellum atrophy is evident. T2W: T2-weighted; FLAIR: Fluid attenuation inversion recovery; DWI: Diffusion-weighted imaging; ADC: Apparent diffusion coefficient.
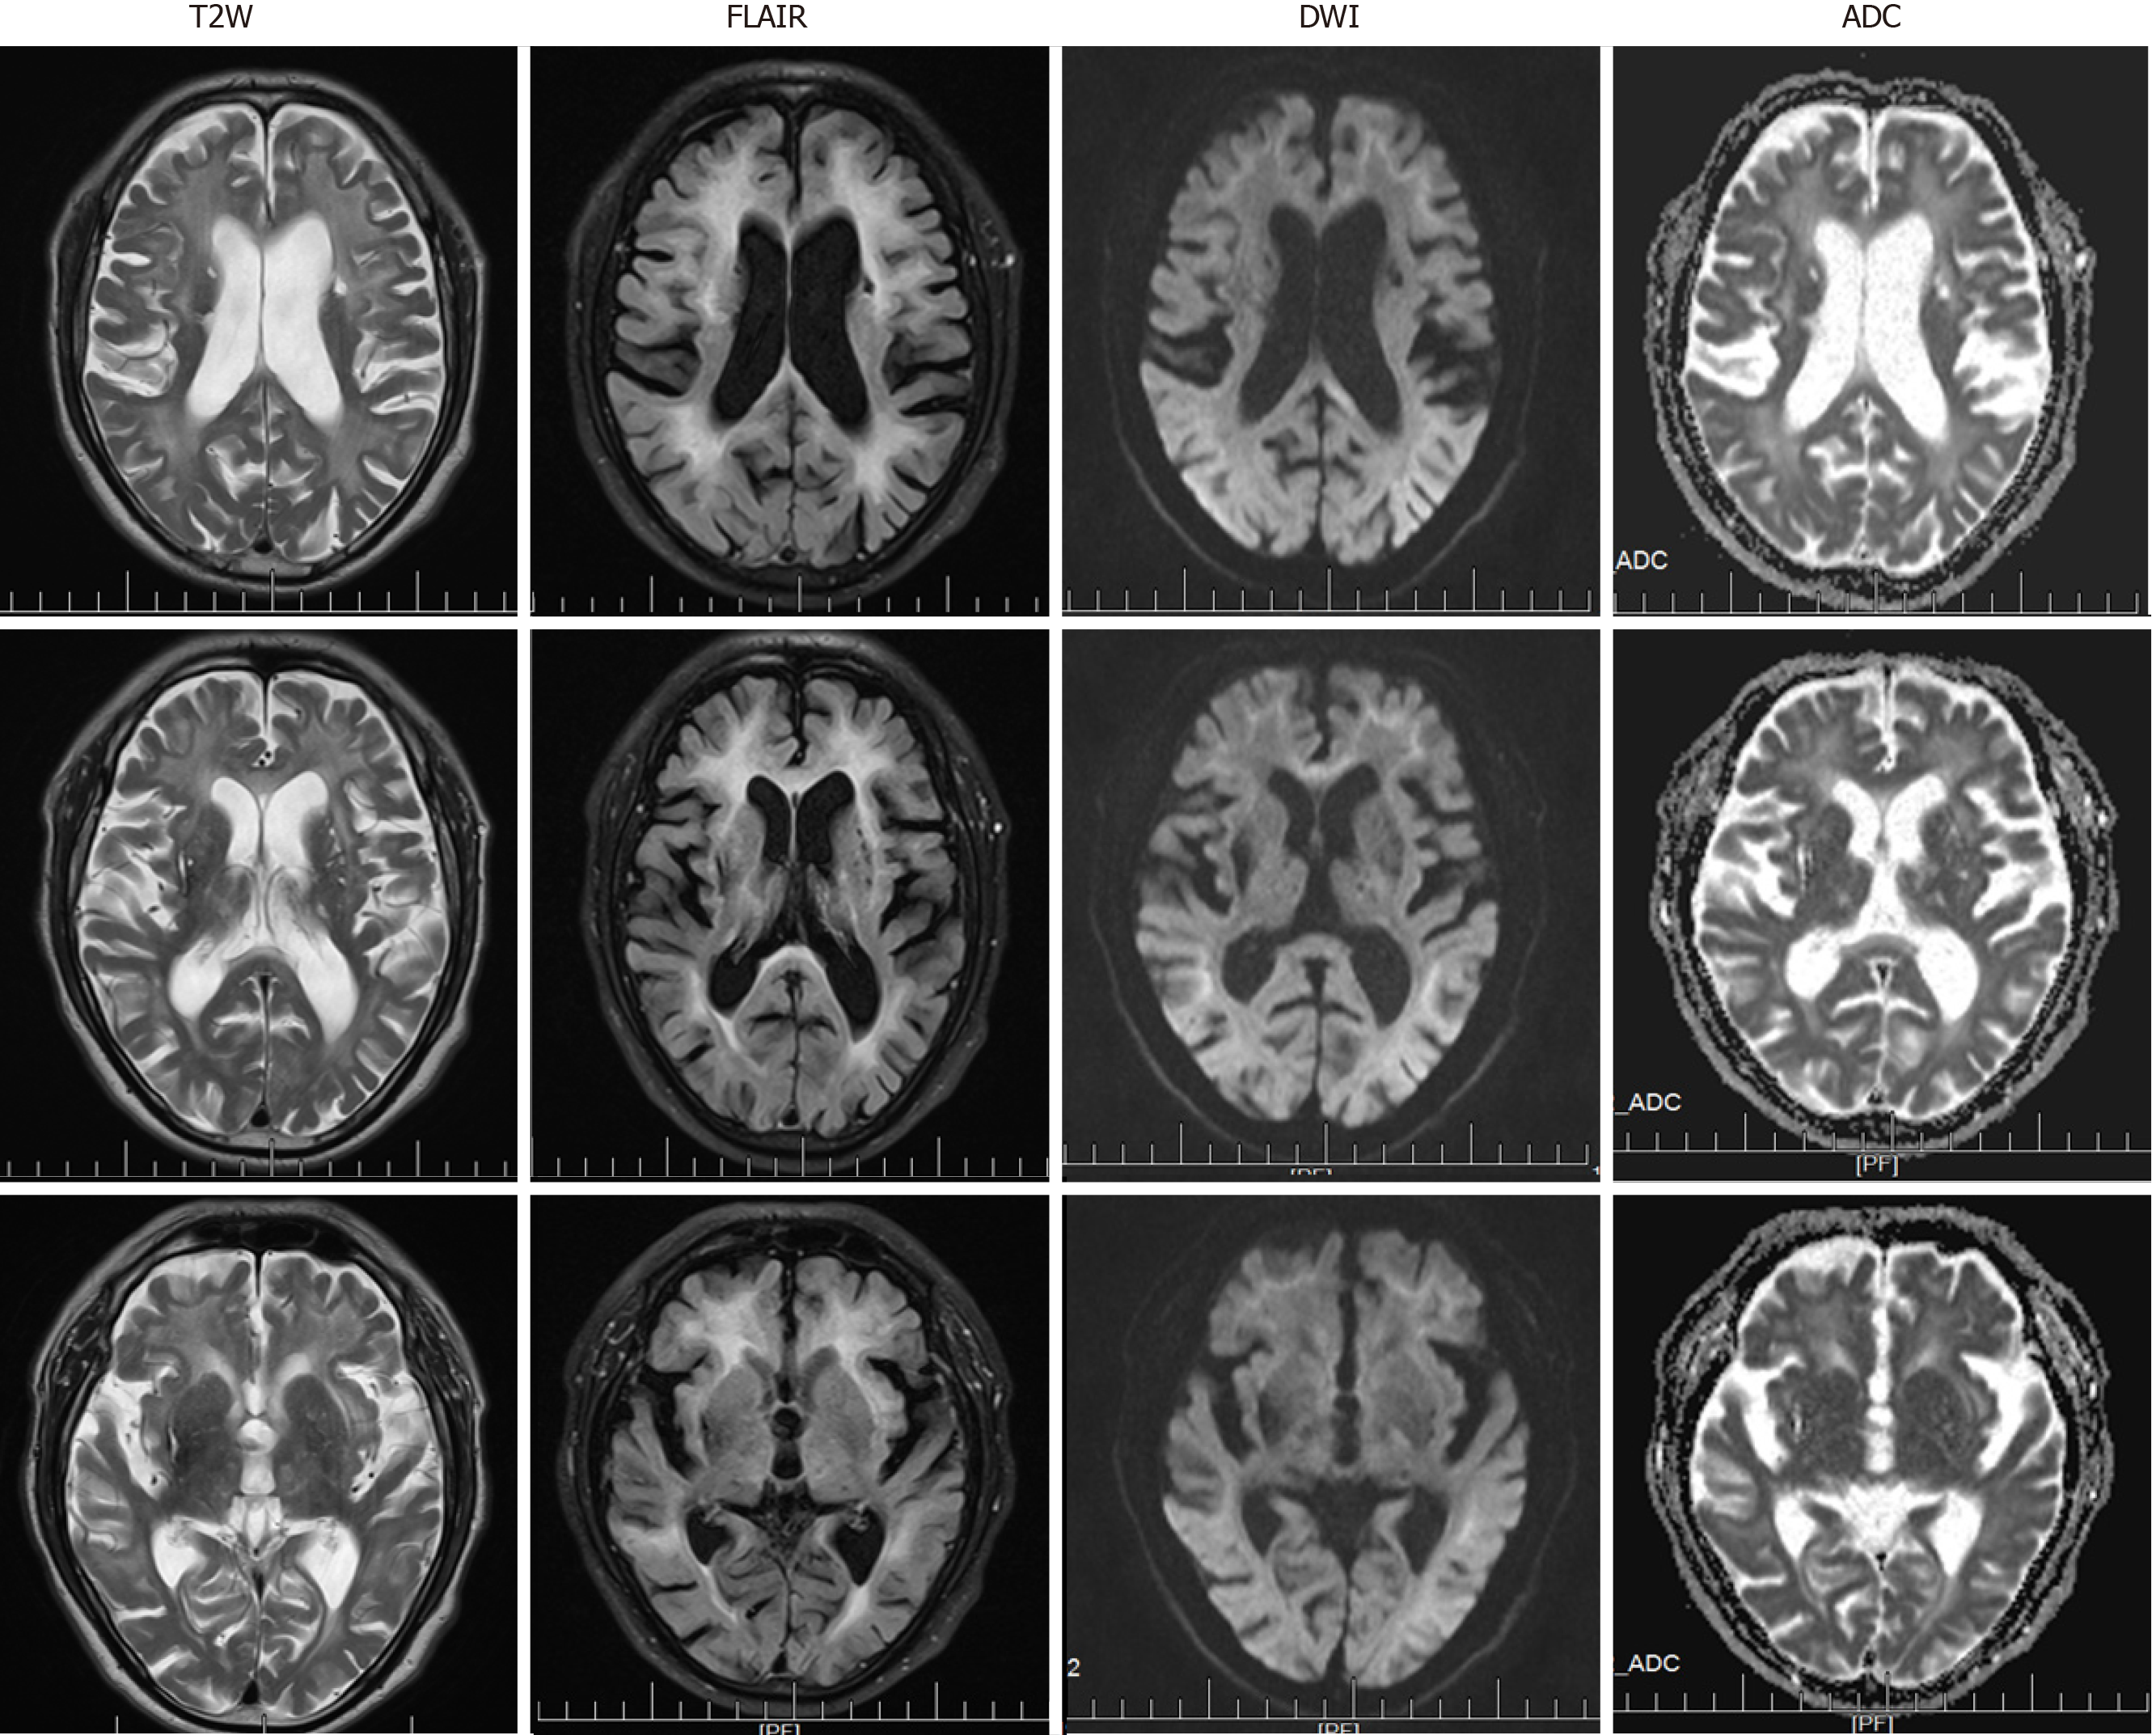
Figure 2 Magnetic resonance imaging obtained at the level of the cerebrum.
Diffusion-weighted imaging showed high-intensity signals along the corticomedullary junction. Both T2-weighted and fluid attenuation inversion recovery sequences showed marked cerebral atrophy, white matter degeneration, and old cerebral infarctions. T2W: T2-weighted; FLAIR: Fluid attenuation inversion recovery; DWI: Diffusion-weighted imaging; ADC: Apparent diffusion coefficient.
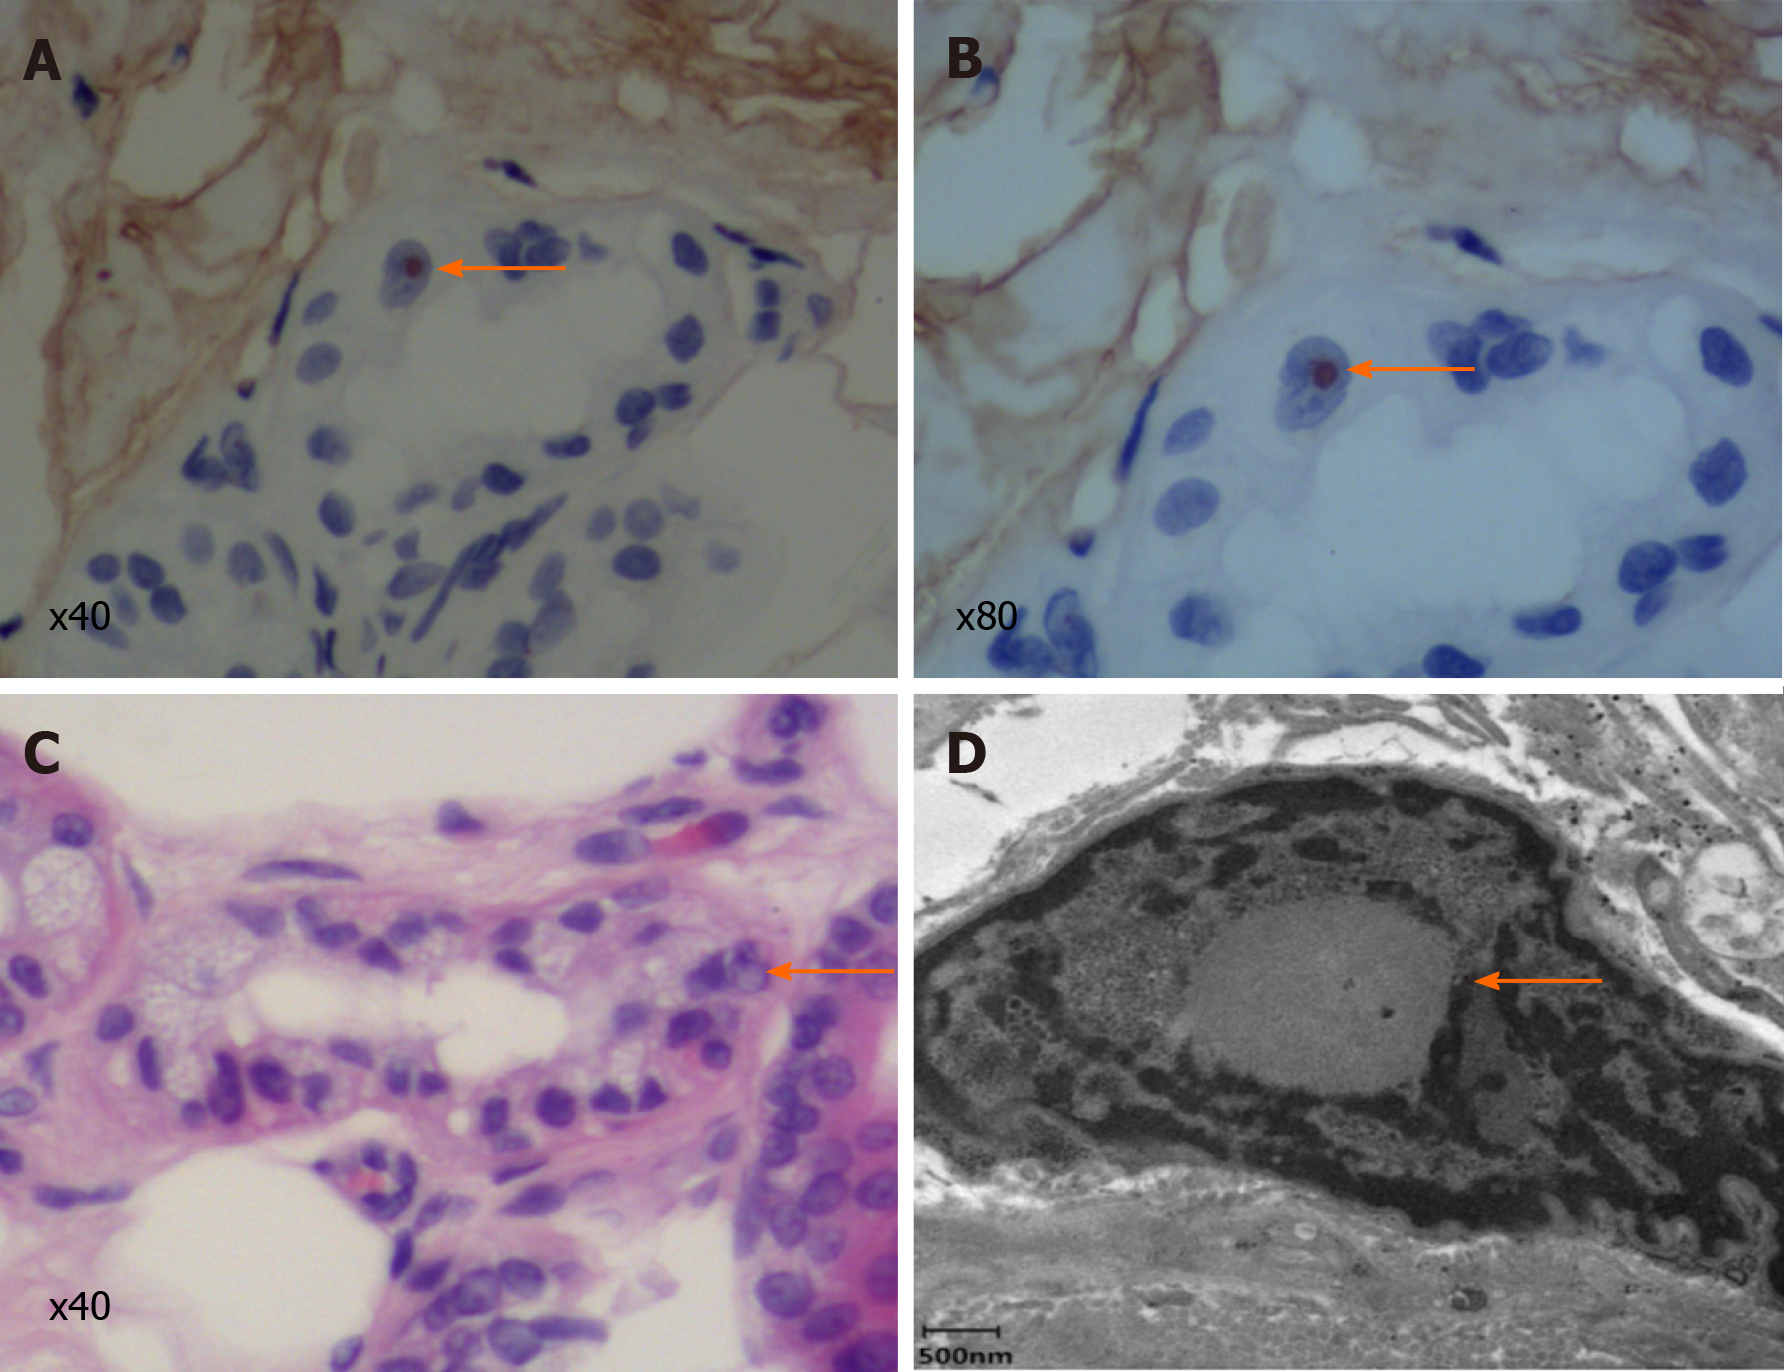
Figure 3 Skin biopsy specimen.
A and B: Immunohistochemical staining showed that the inclusion bodies were positive for p62 (arrows; A: × 40; B: × 80); C: Hematein eosin staining reveals eosinophilic inclusion bodies (arrow; × 40); D: Electron microscopy. The red arrow indicates a spherical inclusion body composed of fibrous substances without membranes.
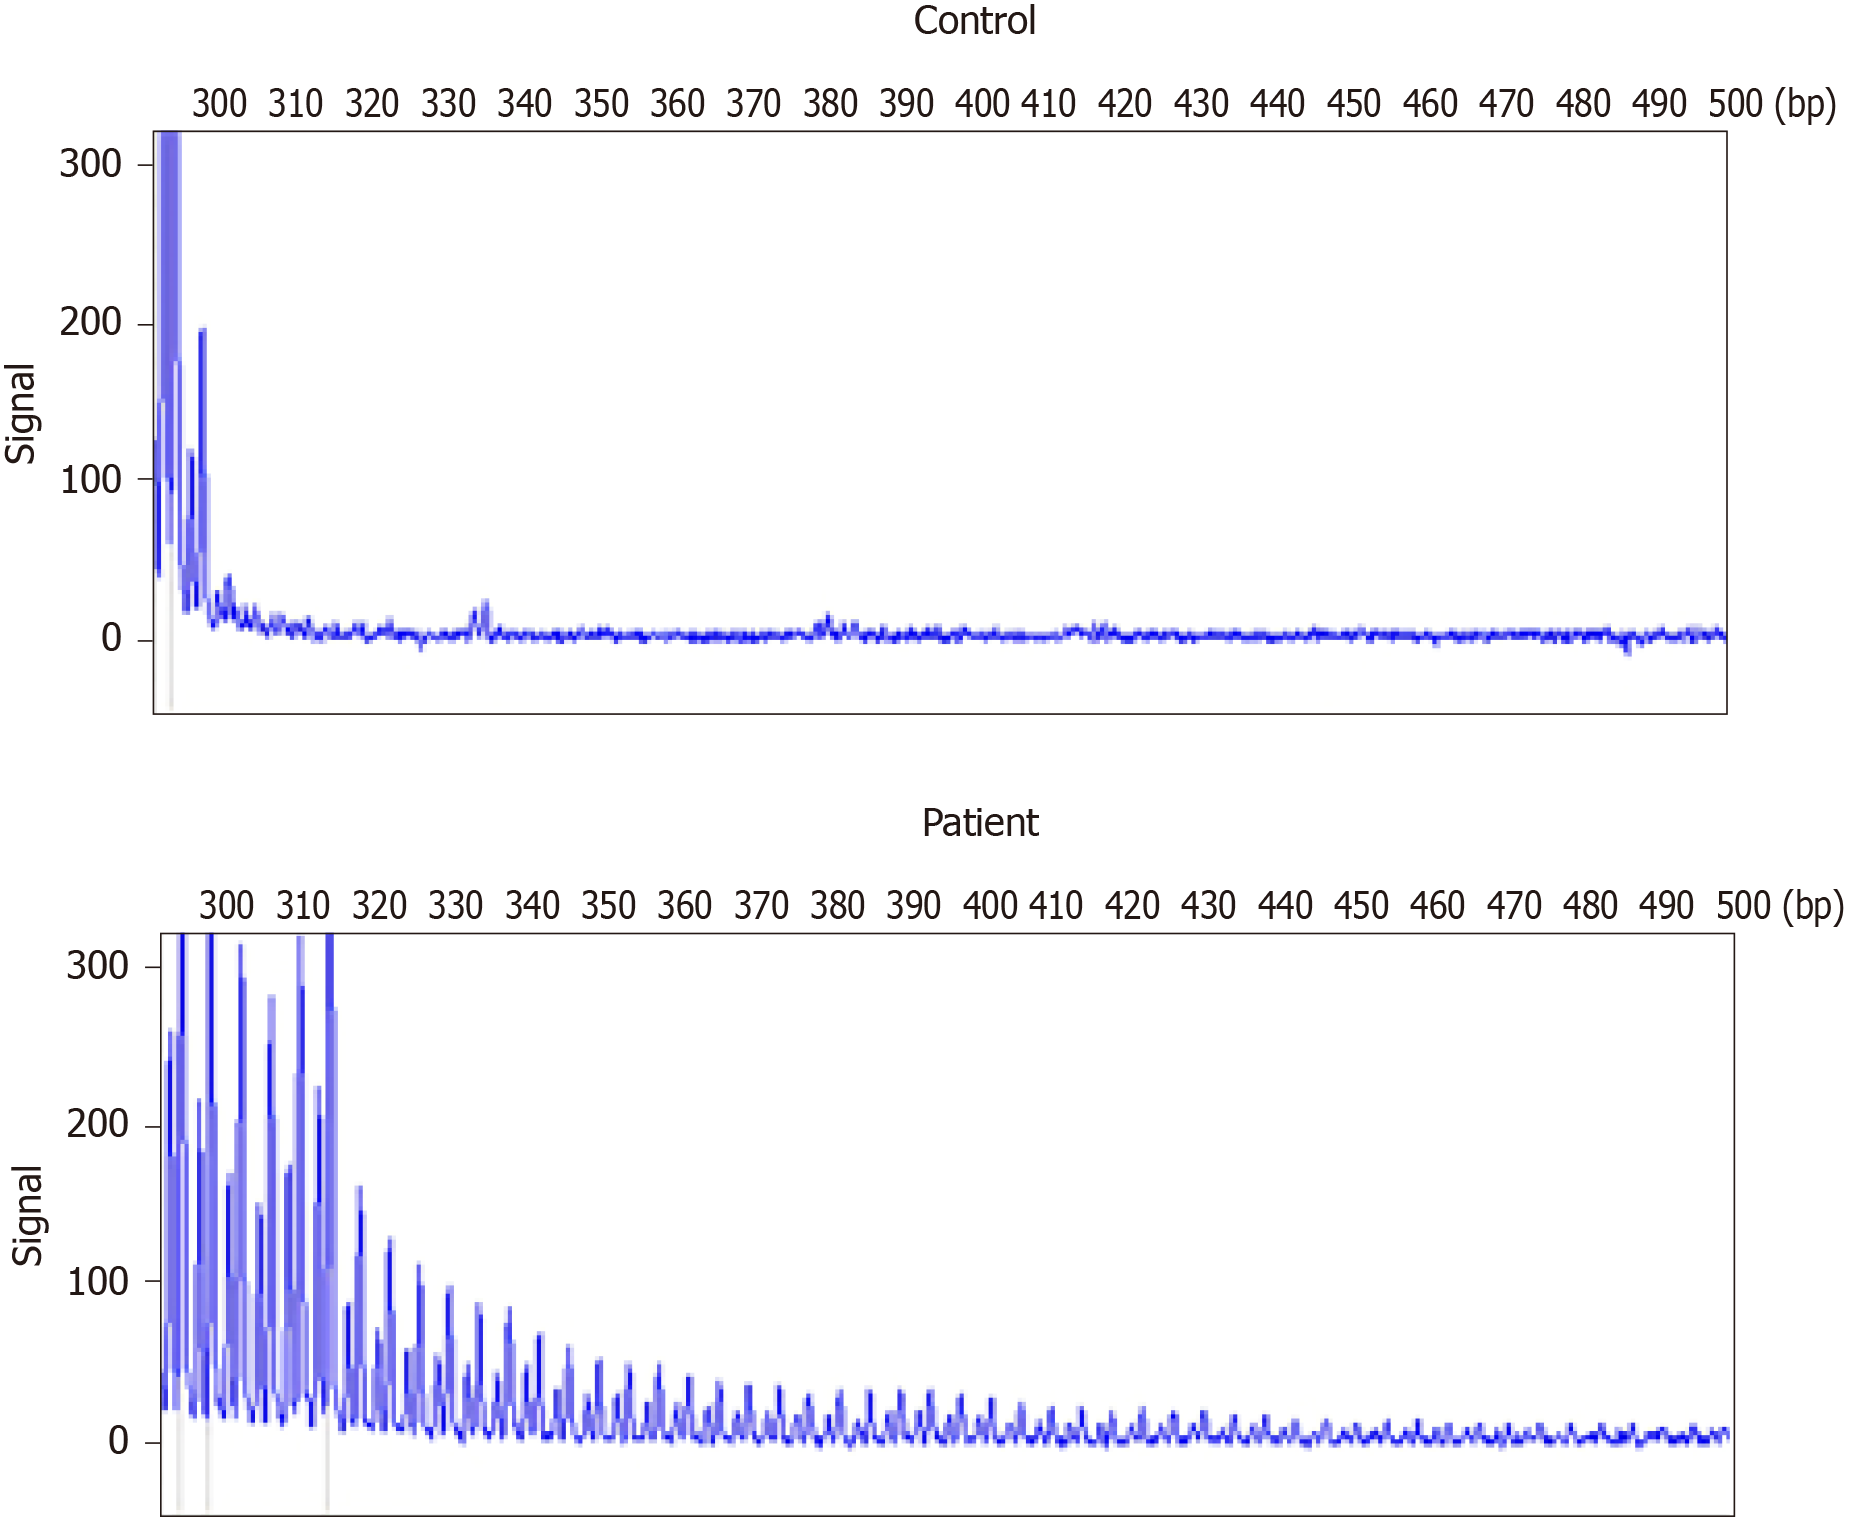
Figure 4 Repeat-primed polymerase chain reaction analysis.
A: Normal control panel shows no repeat expansion; B: Panel of the patient shows the stripe-shaped pattern of expanded repeats of GCC located in the Notch 2 N-terminal like C.
- Citation: Guo JJ, Wang ZY, Wang M, Jiang ZZ, Yu XF. Neuronal intranuclear inclusion disease mimicking acute cerebellitis: A case report. World J Clin Cases 2020; 8(23): 6122-6129
- URL: https://www.wjgnet.com/2307-8960/full/v8/i23/6122.htm
- DOI: https://dx.doi.org/10.12998/wjcc.v8.i23.6122


