Copyright
©The Author(s) 2020.
World J Clin Cases. Dec 6, 2020; 8(23): 5866-5875
Published online Dec 6, 2020. doi: 10.12998/wjcc.v8.i23.5866
Published online Dec 6, 2020. doi: 10.12998/wjcc.v8.i23.5866
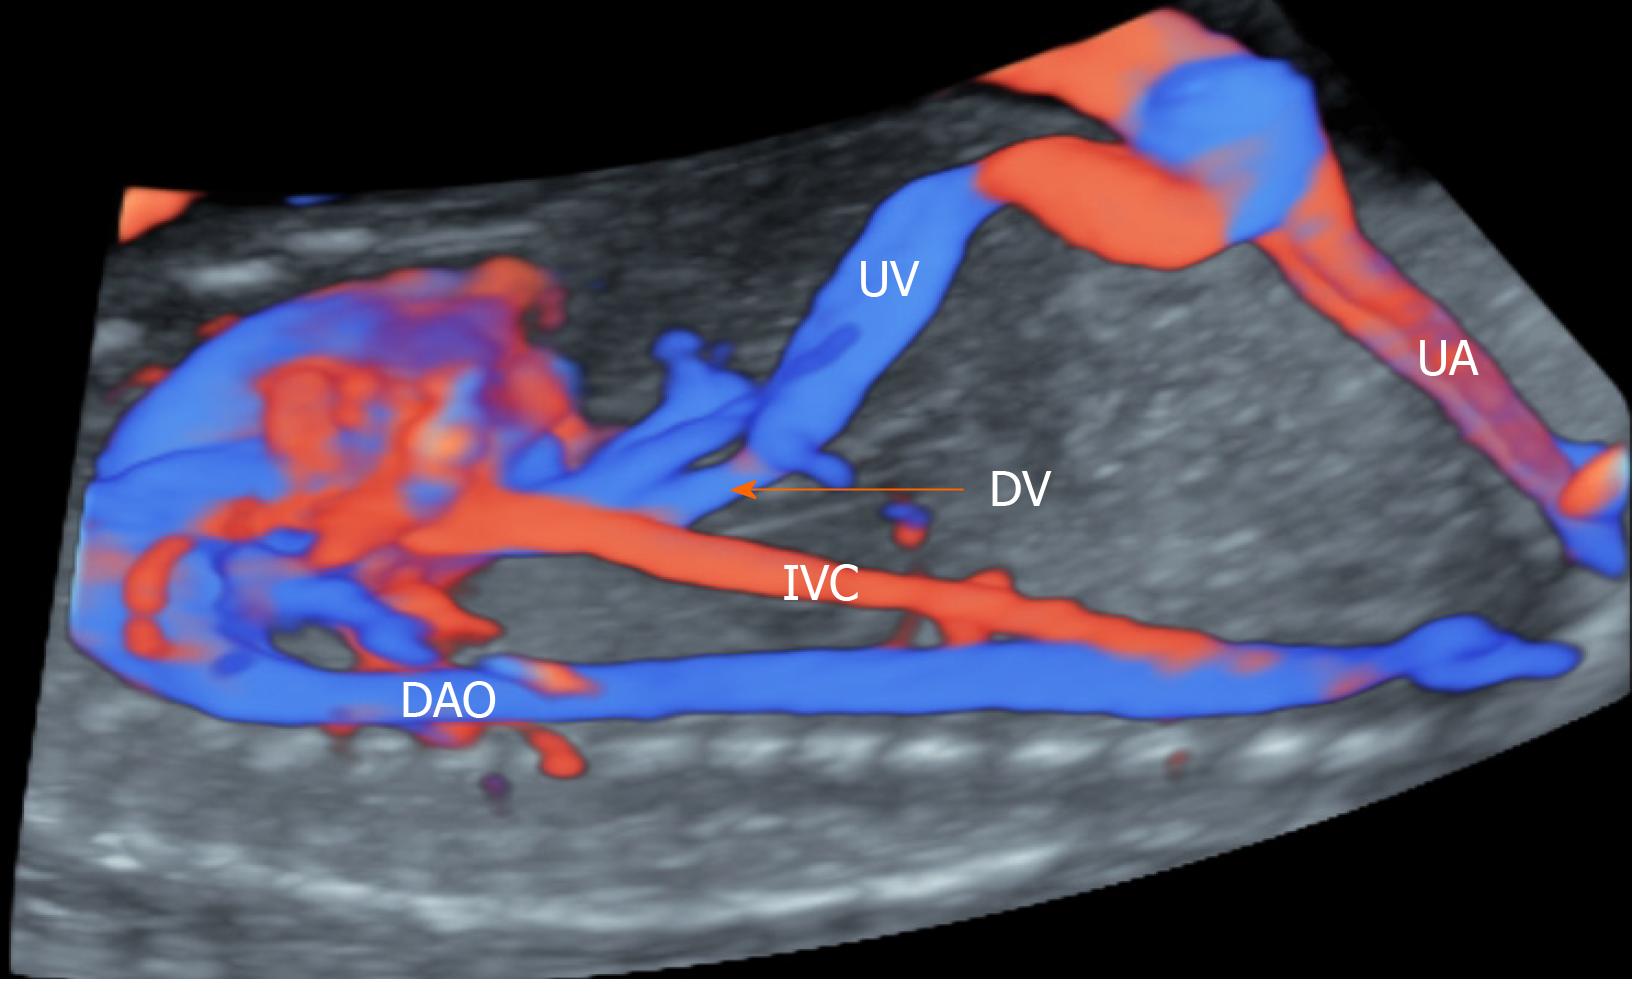
Figure 1 Sagittal view of the foetal chest and abdomen of a 28-wk-old healthy foetus in colour Doppler.
The ductus venosus (DV) is directly connected to the umbilical vein (UV) and the inferior vena cava (IVC). UA: Umbilical artery; DAO: Descending aorta.
Figure 2 The ductus venosus flow velocities, velocity ratios and the early passive /late active ratio at the tricuspid orifice were measured.
A: Typical flow velocity waveform of the ductus venosus. The peak velocities during ventricular systolic peak flow velocity (S), ventricular late diastolic velocity (v), ventricular diastolic peak flow velocity (D) and atrial systolic peak velocity (a) were measured to calculate the velocity ratios; B: From these waveforms, peak systolic velocities during early passive (E) and late active (A) ventricular filling were measured to calculate the E/A ratio for the tricuspid valve; C: Ductus venosus velocimetry of isolated single umbilical artery foetuses with small-for-gestational-age. The ductus venosus spectrum ‘a’-waves were backward.
Figure 3 Schematic diagram and tissue Doppler Tei index of the foetal right ventricular measurement.
A: Tissue Doppler Tei index measurement model of foetal right ventricular, isovolumic contraction time (ICT), ejection time (ET) and isovolumic relaxation time (IRT); B: Doppler Tei index measurement of foetal right heart tissue: Tei index = (isovolumic contraction time + isovolumic relaxation time)/ejection time. LV: Left ventricular.
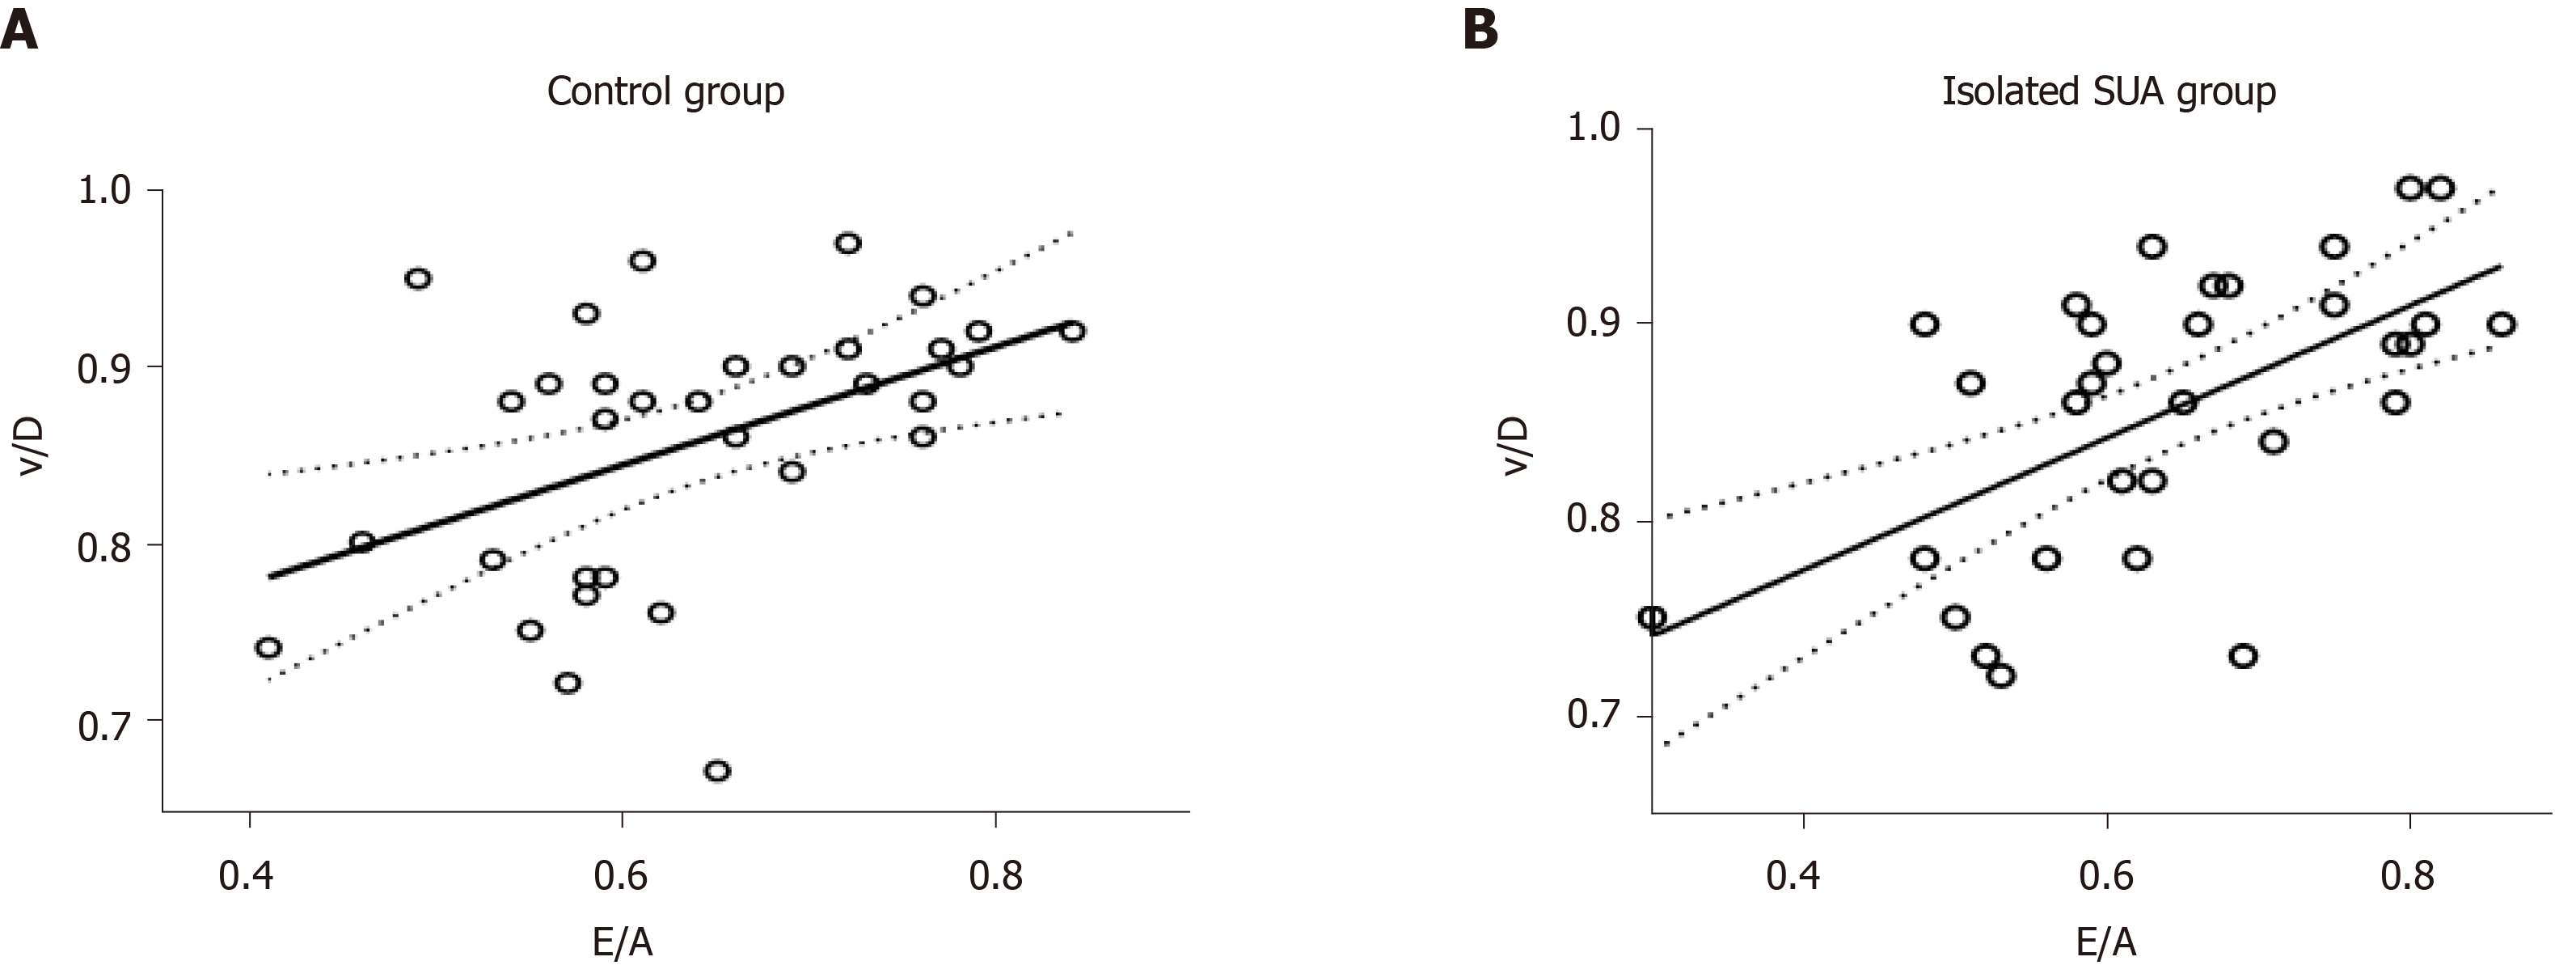
Figure 4 Scatterplots of the correlations between the ventricular late diastolic velocity/ventricular diastolic peak flow velocity and early passive/late active ratio of the isolated single umbilical artery (R2 = 0.
520) and control (R2 = 0.358). A: Control group; B: Isolated single umbilical artery (SUA) group. v/D: Ventricular late diastolic velocity/ventricular diastolic peak flow velocity; E/A: Early passive/late active.
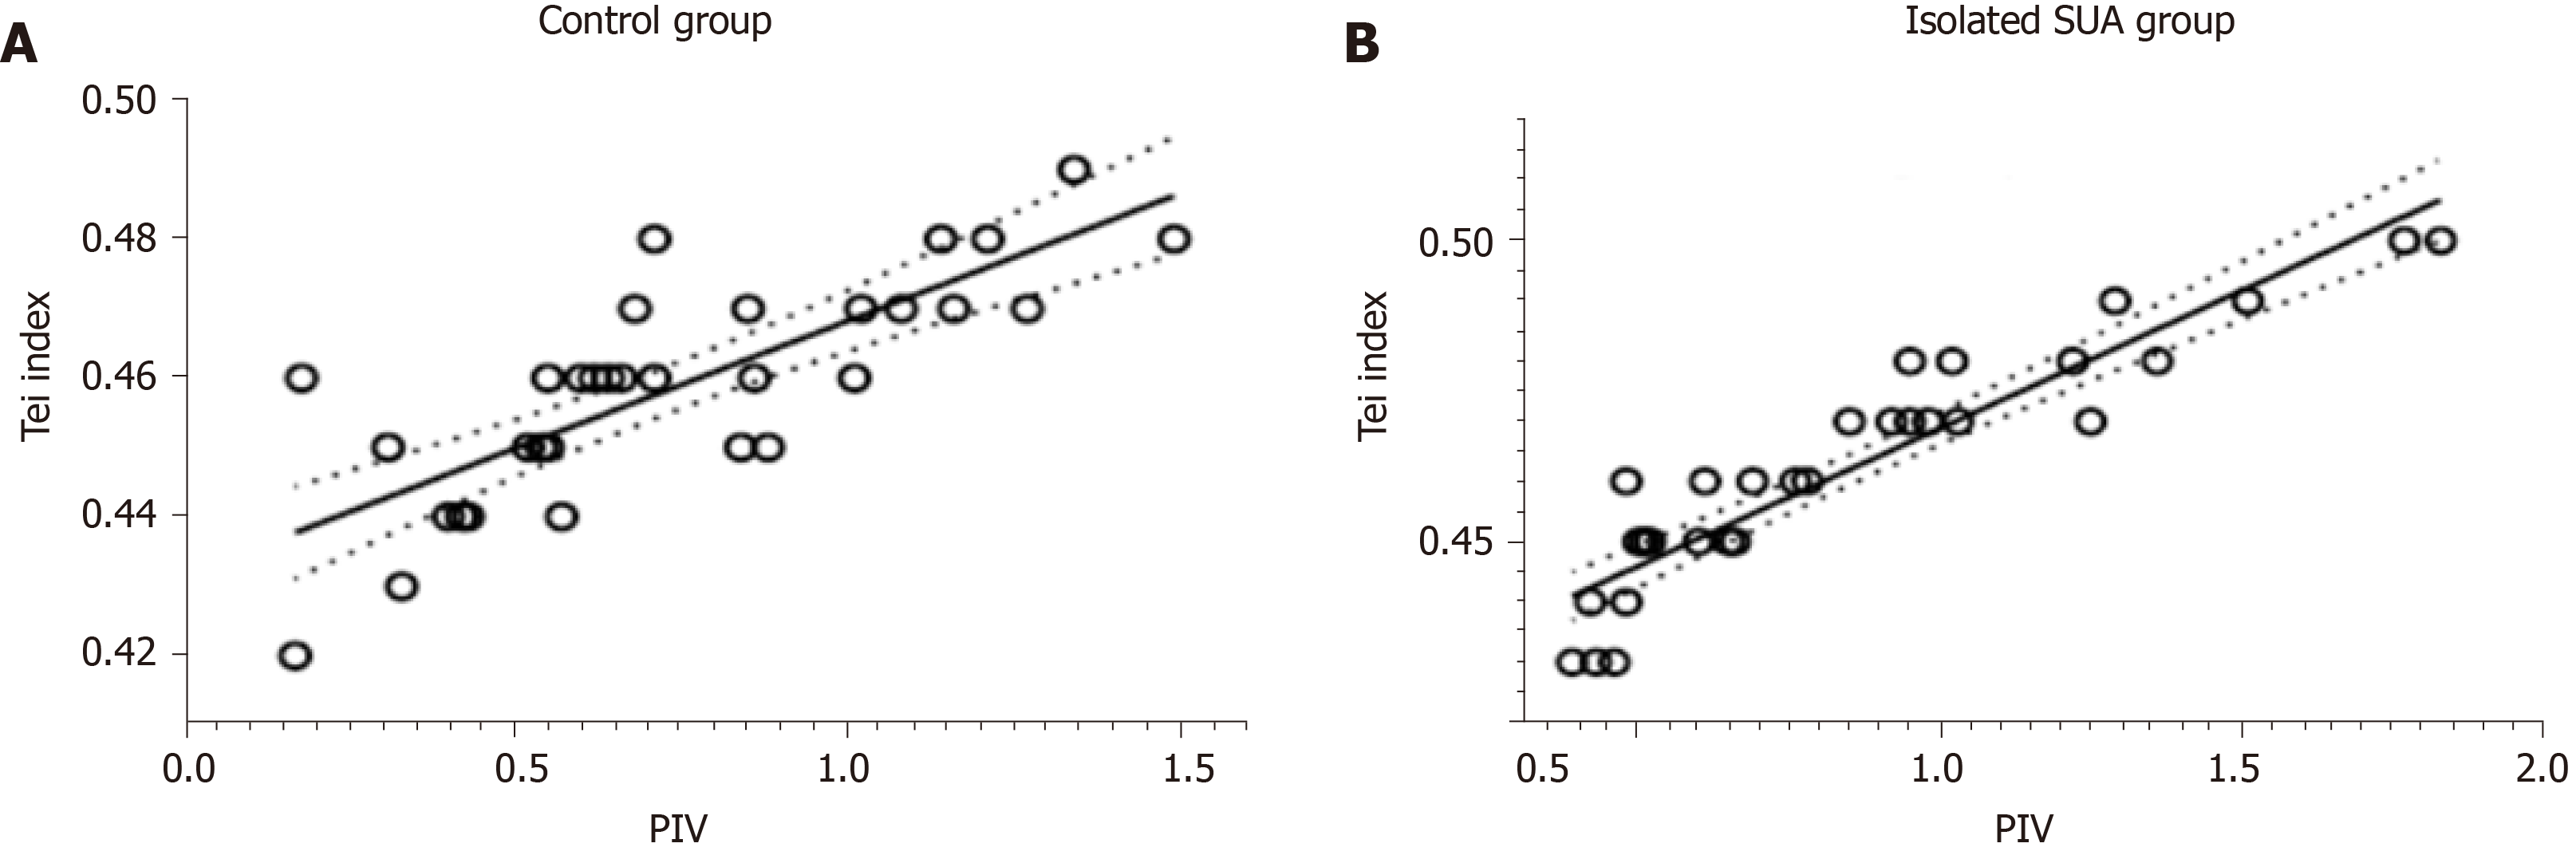
Figure 5 Scatterplots of the correlations between the pulsatility index for veins and Tei index of the isolated single umbilical artery (R2 = 0.
865) and control (R2 = 0.627) groups. A: Control group; B: Isolated single umbilical artery (SUA) group. PIV: Pulsatility index for veins.
- Citation: Li TG, Nie F, Xu XY. Correlation between ductus venosus spectrum and right ventricular diastolic function in isolated single-umbilical-artery foetus and normal foetus in third trimester. World J Clin Cases 2020; 8(23): 5866-5875
- URL: https://www.wjgnet.com/2307-8960/full/v8/i23/5866.htm
- DOI: https://dx.doi.org/10.12998/wjcc.v8.i23.5866


