Copyright
©The Author(s) 2020.
World J Clin Cases. Jul 6, 2020; 8(13): 2727-2737
Published online Jul 6, 2020. doi: 10.12998/wjcc.v8.i13.2727
Published online Jul 6, 2020. doi: 10.12998/wjcc.v8.i13.2727
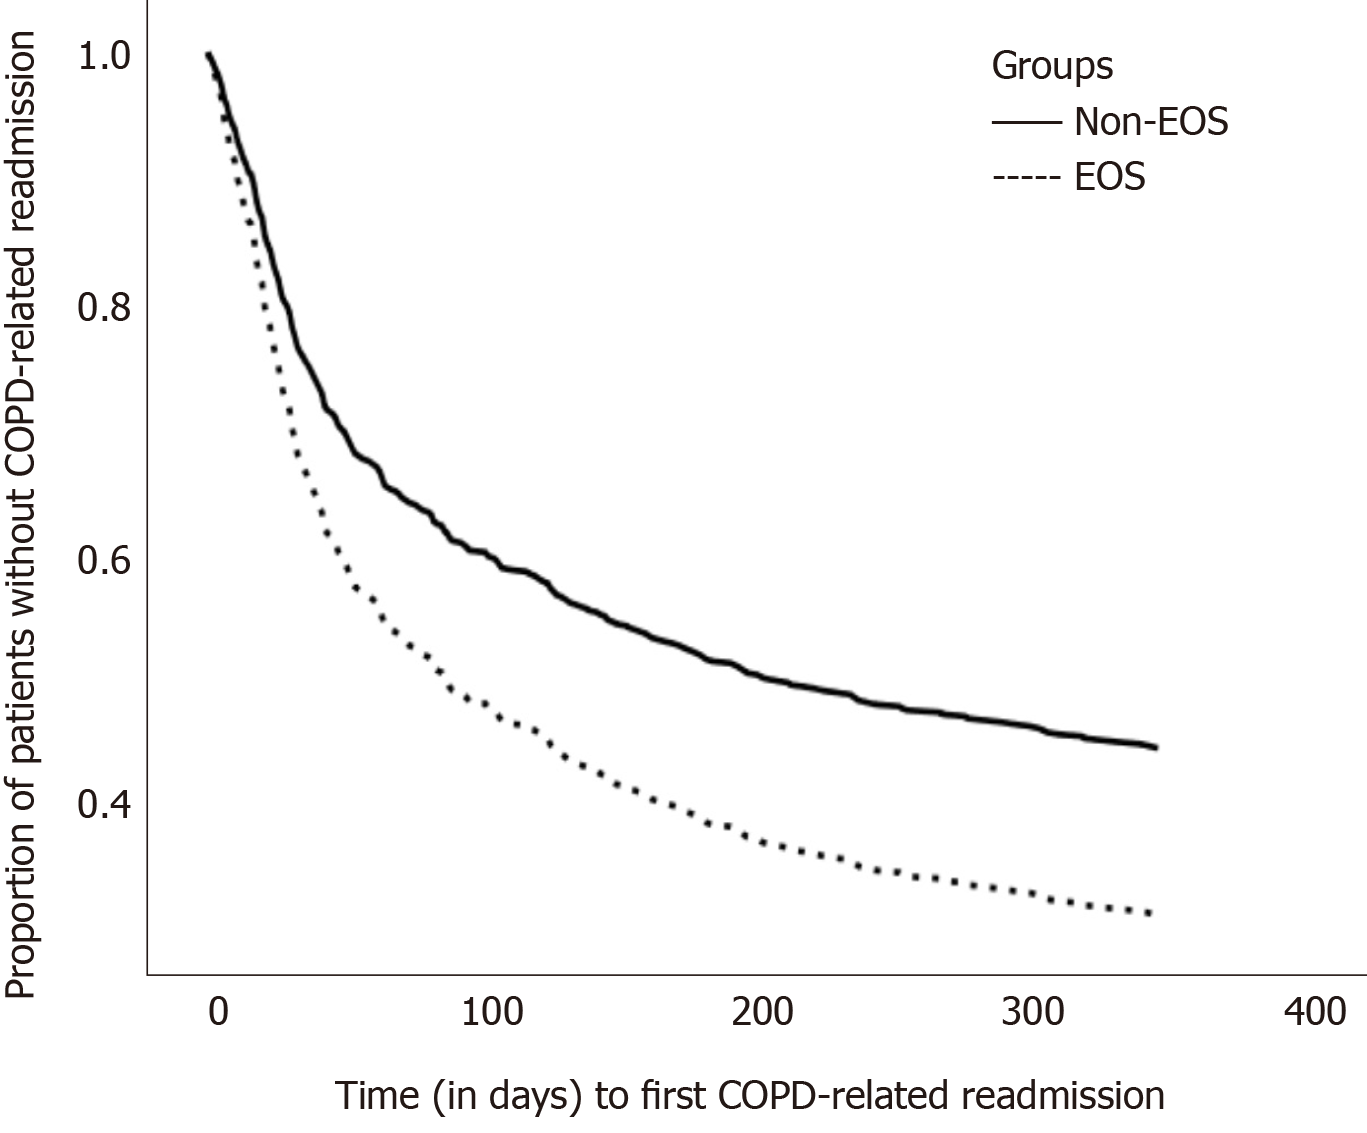
Figure 1 The Kaplan-Meier curves of time to first chronic obstructive pulmonary disease related readmission (P < 0.
001; adjusted hazard ratio = 1.488, 95% confidence interval = 1.195-1.854). Log-rank method was used to test the difference between the two groups. COPD: Chronic obstructive pulmonary disease; EOS: Patients with eosinophil count ≥ 2%; Non-EOS: Patients with eosinophil count < 2%.
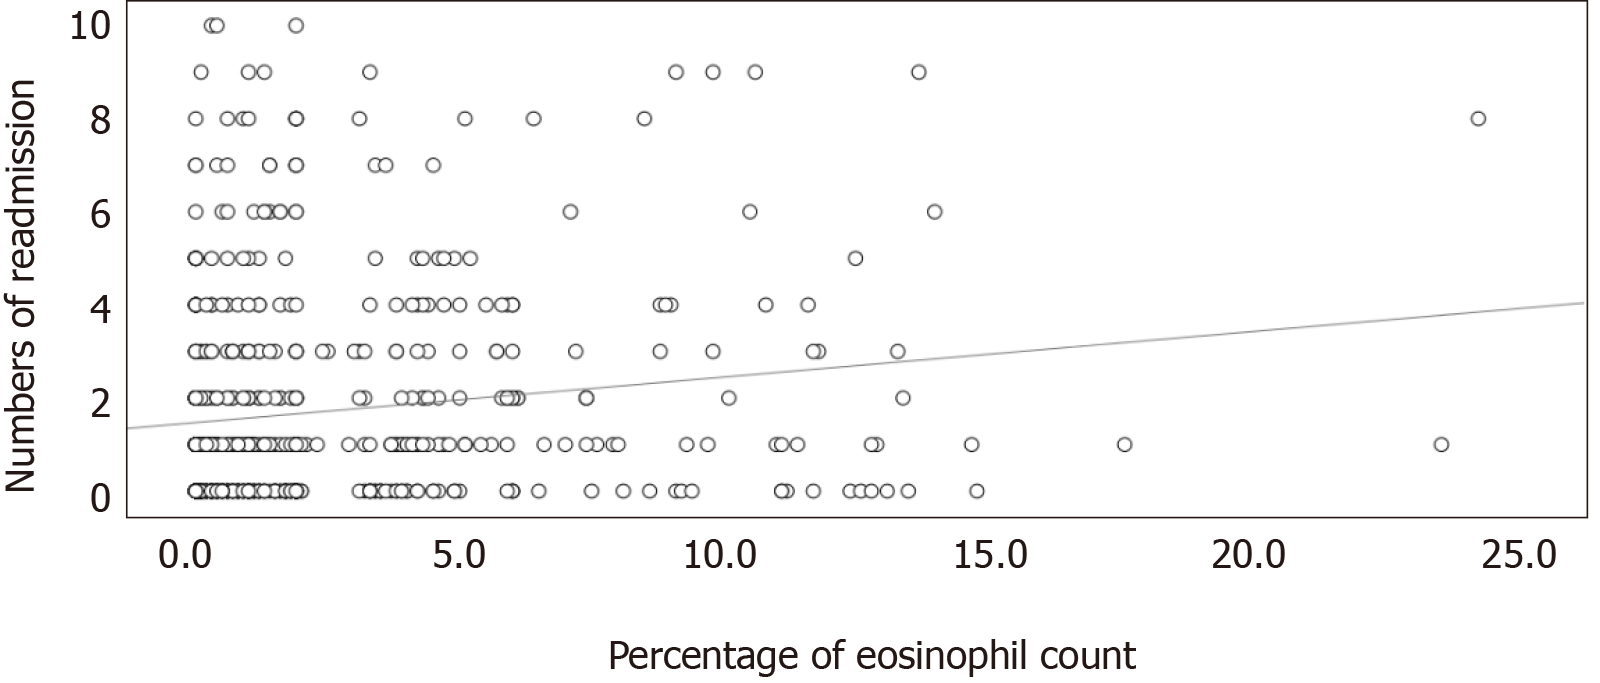
Figure 2 The correlation between the percentage of eosinophils and the number of readmissions within 12 mo (P < 0.
001; Pearson's r = 0.147). The relationships between continuous variables were assessed by the Pearson's correlation coefficient (r) and simple linear regression analysis.
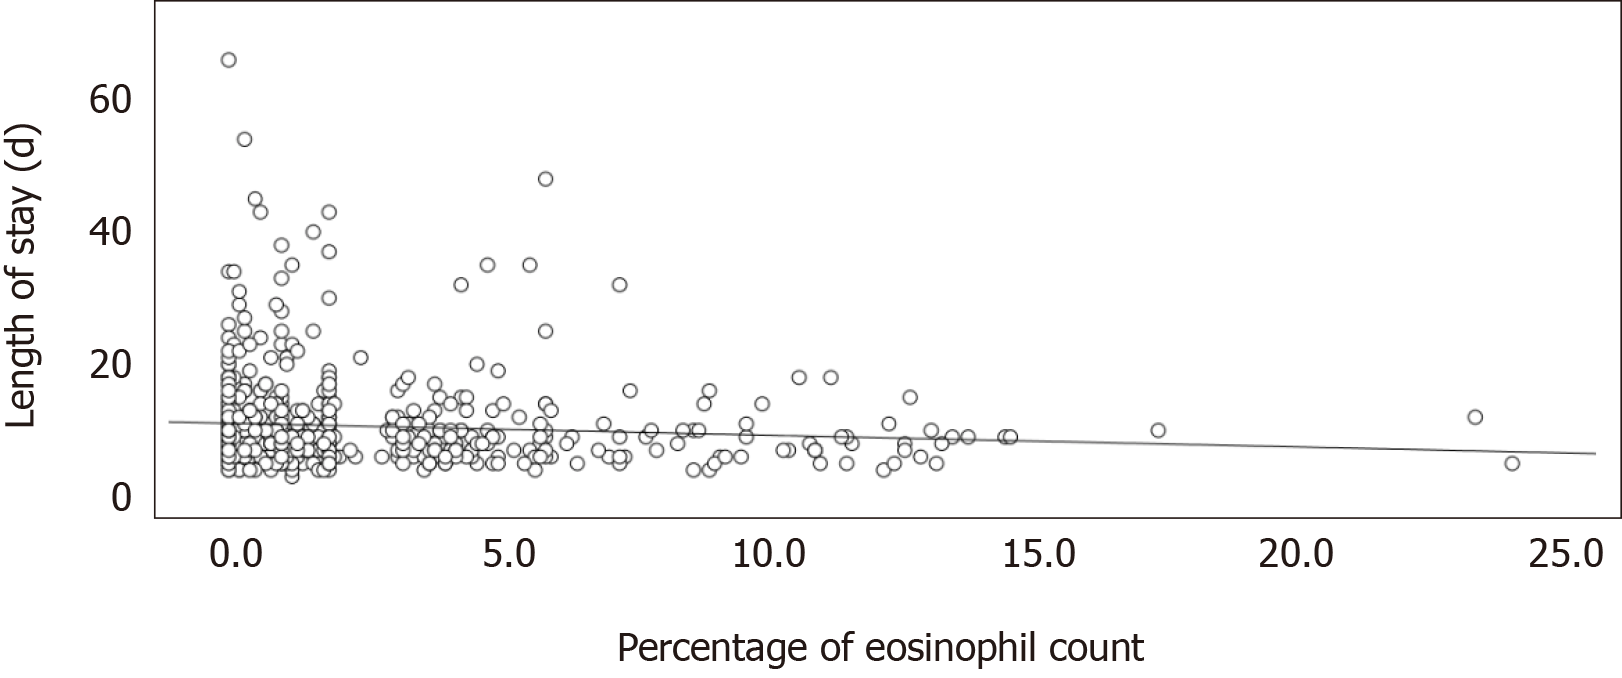
Figure 3 The correlation between the percentage of eosinophils and the length of stay (d) in the index hospitalization (P = 0.
031; Pearson's r = -0.086). The relationships between continuous variables are assessed by the Pearson's correlation coefficient (r) and simple linear regression analysis.
- Citation: Wu CW, Lan CC, Hsieh PC, Tzeng IS, Wu YK. Role of peripheral eosinophilia in acute exacerbation of chronic obstructive pulmonary disease. World J Clin Cases 2020; 8(13): 2727-2737
- URL: https://www.wjgnet.com/2307-8960/full/v8/i13/2727.htm
- DOI: https://dx.doi.org/10.12998/wjcc.v8.i13.2727


