Copyright
©The Author(s) 2018.
World J Clin Cases. Nov 26, 2018; 6(14): 800-806
Published online Nov 26, 2018. doi: 10.12998/wjcc.v6.i14.800
Published online Nov 26, 2018. doi: 10.12998/wjcc.v6.i14.800
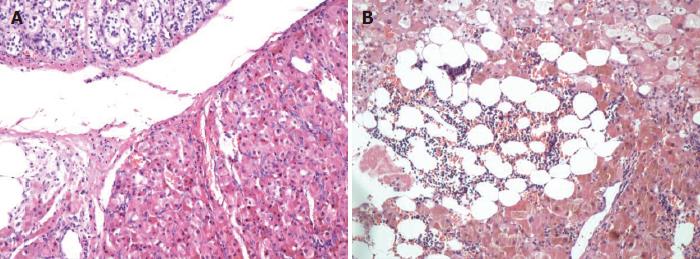
Figure 1 Histopathology (H and E staining, × 100).
A: The left adrenal lesion of Patient 1 conforms to primary pigmented nodular adrenocortical disease (PPNAD); B: The right adrenal lesion of Patient 2 conforms to PPNAD with local myelolipoma like change.
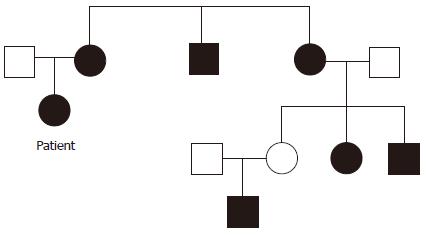
Figure 2 Pedigree chart of Patient 1.
Many of the patient’s family members had “facial asymmetry”. Circles represent females; squares represent males. Graphics in black represent “facial asymmetry”.
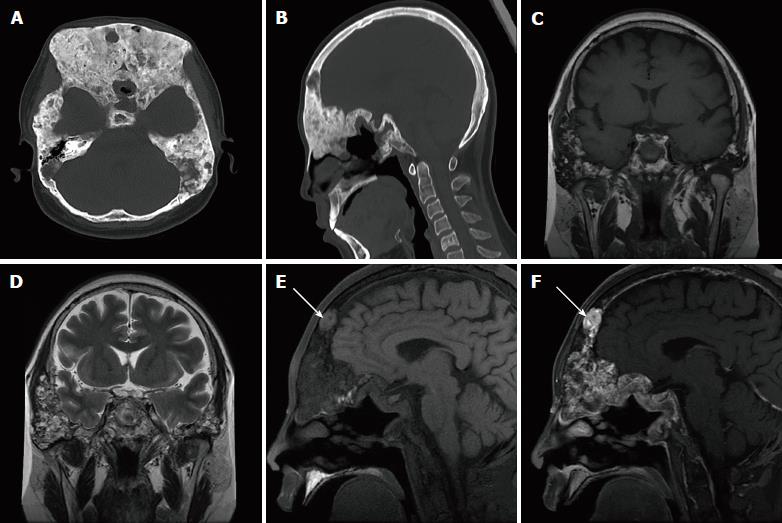
Figure 3 Computed tomography and magnetic resonance imaging images of Patient 1.
A and B: Axial and sagittal skull computed tomography images showing that the skull and maxillofacial bones were remarkably enlarged with both sclerotic and lytic lesions; C-F: Coronal T1-weighted image (C) and T2-weighted image (D) showing bone lesions with heterogeneous signal intensity in the temporal and sphenoid bones; hyperintensity in the frontal bone was found on the fat saturated T1-weighted image (E, arrow), indicating mucus; the bone lesions were markedly enhanced after enhancement (F).
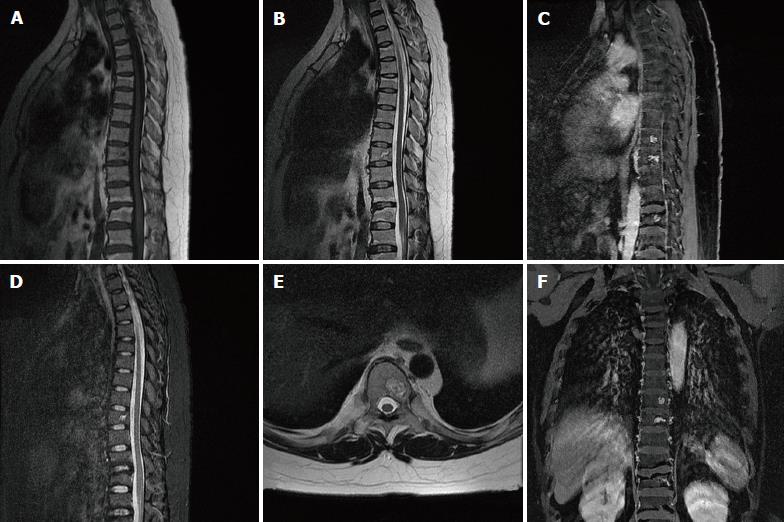
Figure 4 Spine magnetic resonance imaging of Patient 1.
A-F: Patchy bone lesions that were of low signal intensity on T1WI (A), mixed signal intensity on T2WI in sagittal (B), axial (E), and coronal images (F), and high signal intensity on fat saturated T2WI (C) with enhancement on gadolinium enhanced T1WI (D).
Figure 5 Pigmentation spots on the lips of patient 2 and his father.
A: Patient 2 has multiple scattered pigmentation spots on the lips; B: His father has similar spots.
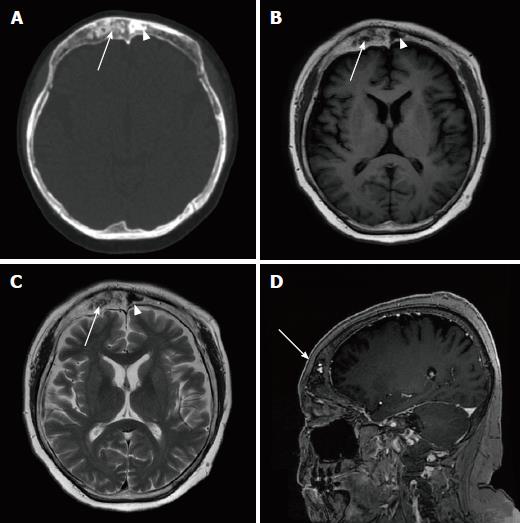
Figure 6 Computed tomography and magnetic resonance imaging images of Patient 2.
A: Axial skull computed tomography image showing the thickened frontal bone with both sclerotic lesion (arrow head) and lytic lesion (arrow); B: Axial T1-weighted imaging showing that both the sclerotic lesion and the lytic lesion were hypointense; C: Axial T2-weighted imaging showing that the sclerotic lesion was hypointense and the lytic part was slightly hyperintense; D: Sagittal post-contrast T1-weighted imaging showing that the lytic lesion was remarkably enhanced on sagittal post-contrast T1-weighted imaging (arrow).
- Citation: Li S, Duan L, Wang FD, Lu L, Jin ZY. Carney complex: Two case reports and review of literature. World J Clin Cases 2018; 6(14): 800-806
- URL: https://www.wjgnet.com/2307-8960/full/v6/i14/800.htm
- DOI: https://dx.doi.org/10.12998/wjcc.v6.i14.800


