Copyright
©The Author(s) 2018.
World J Clin Cases. Sep 26, 2018; 6(10): 355-364
Published online Sep 26, 2018. doi: 10.12998/wjcc.v6.i10.355
Published online Sep 26, 2018. doi: 10.12998/wjcc.v6.i10.355
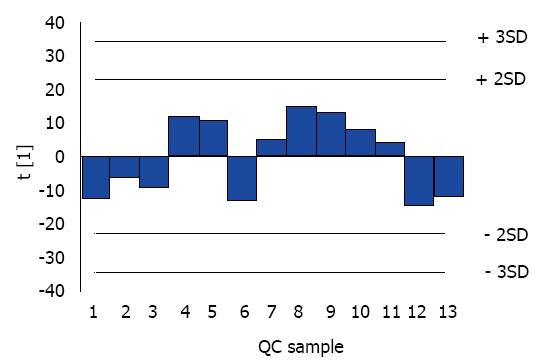
Figure 1 Dynamic distribution of quality control samples throughout the Ultra-high performance liquid chromatography-tandem mass spectrometry analysis.
Colored bars indicate the quality control samples that are projected onto the first principal component with a range from -2 SD to +2 SD. QC: Quality control; SD: Standard deviation.
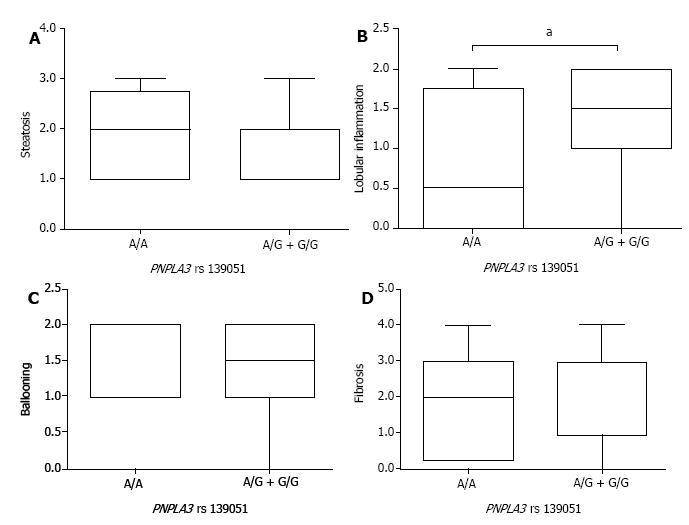
Figure 2 Nonalcoholic fatty liver disease patients carrying the A/A genotype at PNPLA3 rs139051 demonstrated low-grade lobular inflammation.
Box plots indicate the difference in pathologic characteristics of steatosis (A); lobular inflammation (B); ballooning (C); and fibrosis (D) between nonalcoholic fatty liver disease patients with the A/A or A/G + G/G genotype at PNPLA3 rs139051. Results are presented as medians and Interquartile Range. aP < 0.05.
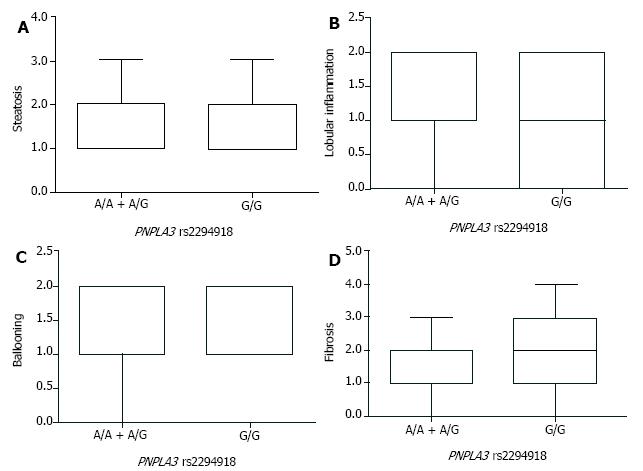
Figure 3 PNPLA3 rs2294918 showed no association with pathologic characteristics of nonalcoholic fatty liver disease patients.
Box plots indicate the grade of steatosis (A); lobular inflammation (B); ballooning (C); and fibrosis (D) in nonalcoholic fatty liver disease patients with the G/G or A/A + A/G genotype at PNPLA3 rs2294918. Results are presented as medians and Interquartile Range.
- Citation: Luo JJ, Cao HX, Yang RX, Zhang RN, Pan Q. PNPLA3 rs139051 is associated with phospholipid metabolite profile and hepatic inflammation in nonalcoholic fatty liver disease. World J Clin Cases 2018; 6(10): 355-364
- URL: https://www.wjgnet.com/2307-8960/full/v6/i10/355.htm
- DOI: https://dx.doi.org/10.12998/wjcc.v6.i10.355


