Copyright
©The Author(s) 2024.
World J Clin Cases. Jul 26, 2024; 12(21): 4536-4542
Published online Jul 26, 2024. doi: 10.12998/wjcc.v12.i21.4536
Published online Jul 26, 2024. doi: 10.12998/wjcc.v12.i21.4536
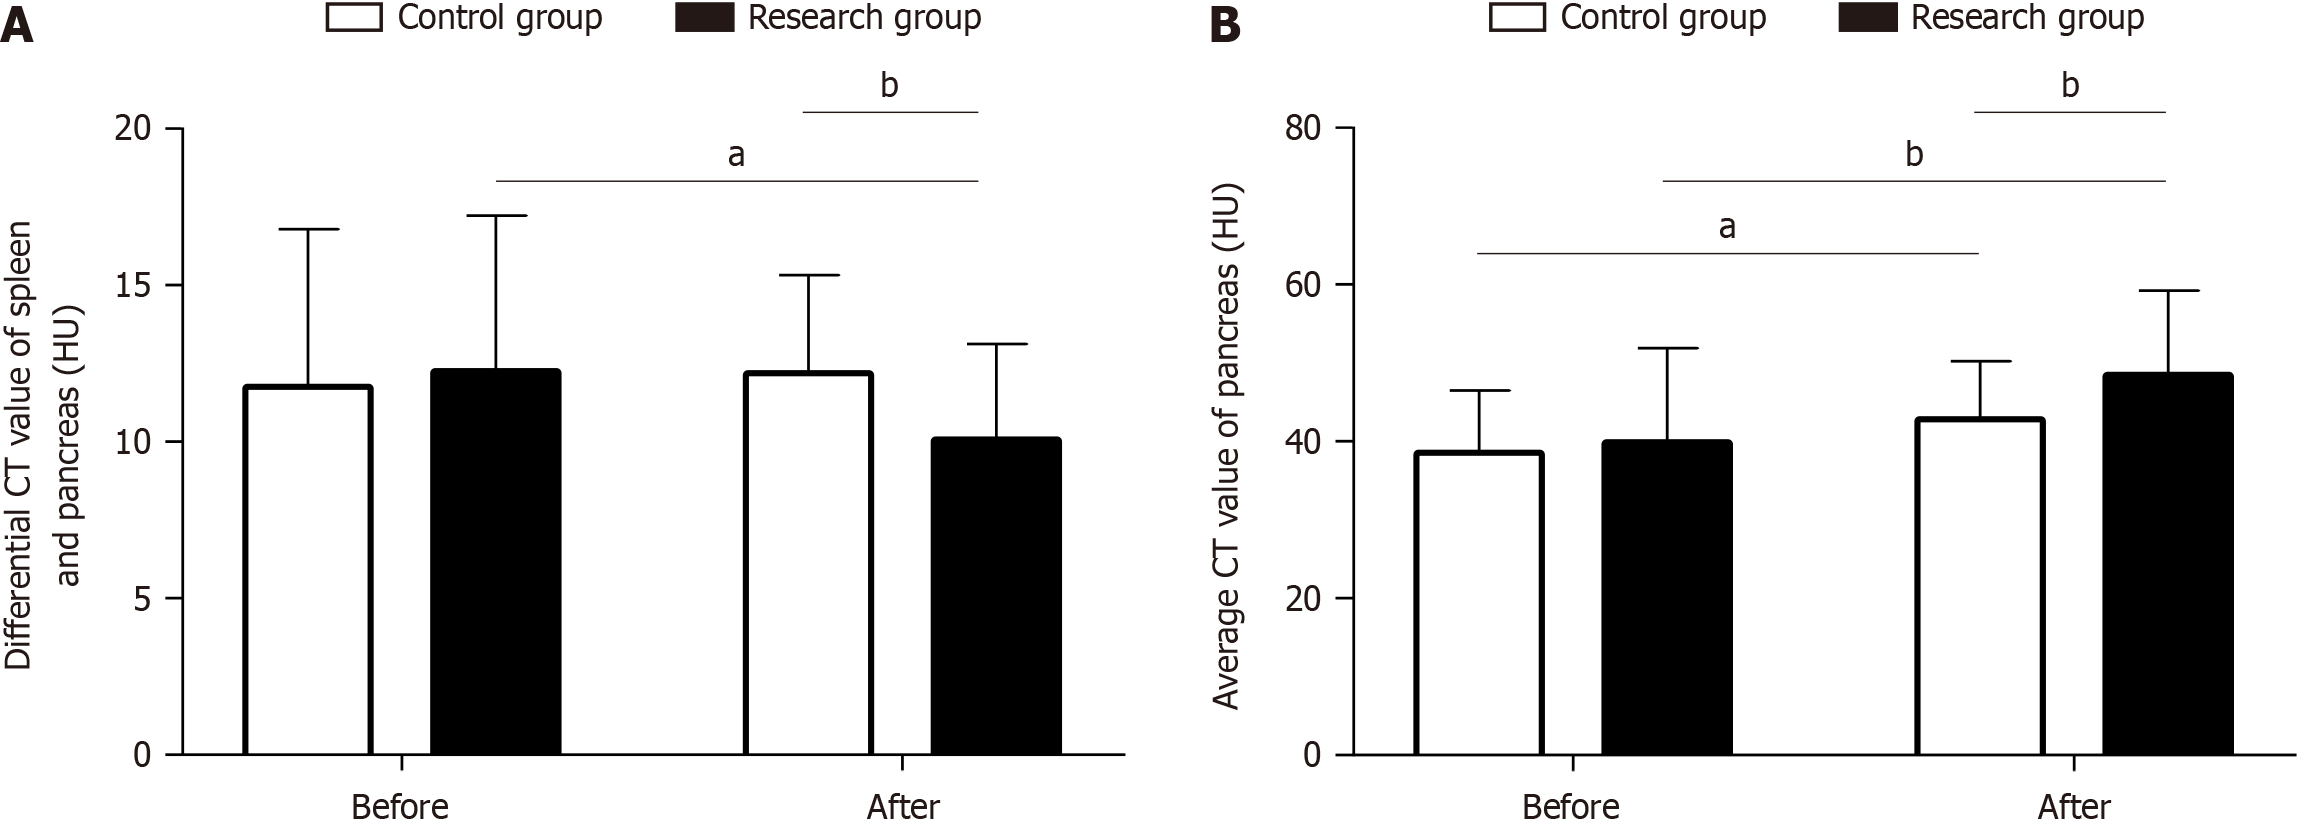
Figure 1 Improvement of intrapancreatic fat deposition.
A: Comparative analysis of differential computed tomography (CT) values of the spleen and pancreas; B: Comparative analysis of the average CT value of the pancreas. aP < 0.05. bP < 0.01. CT: Computed tomography.
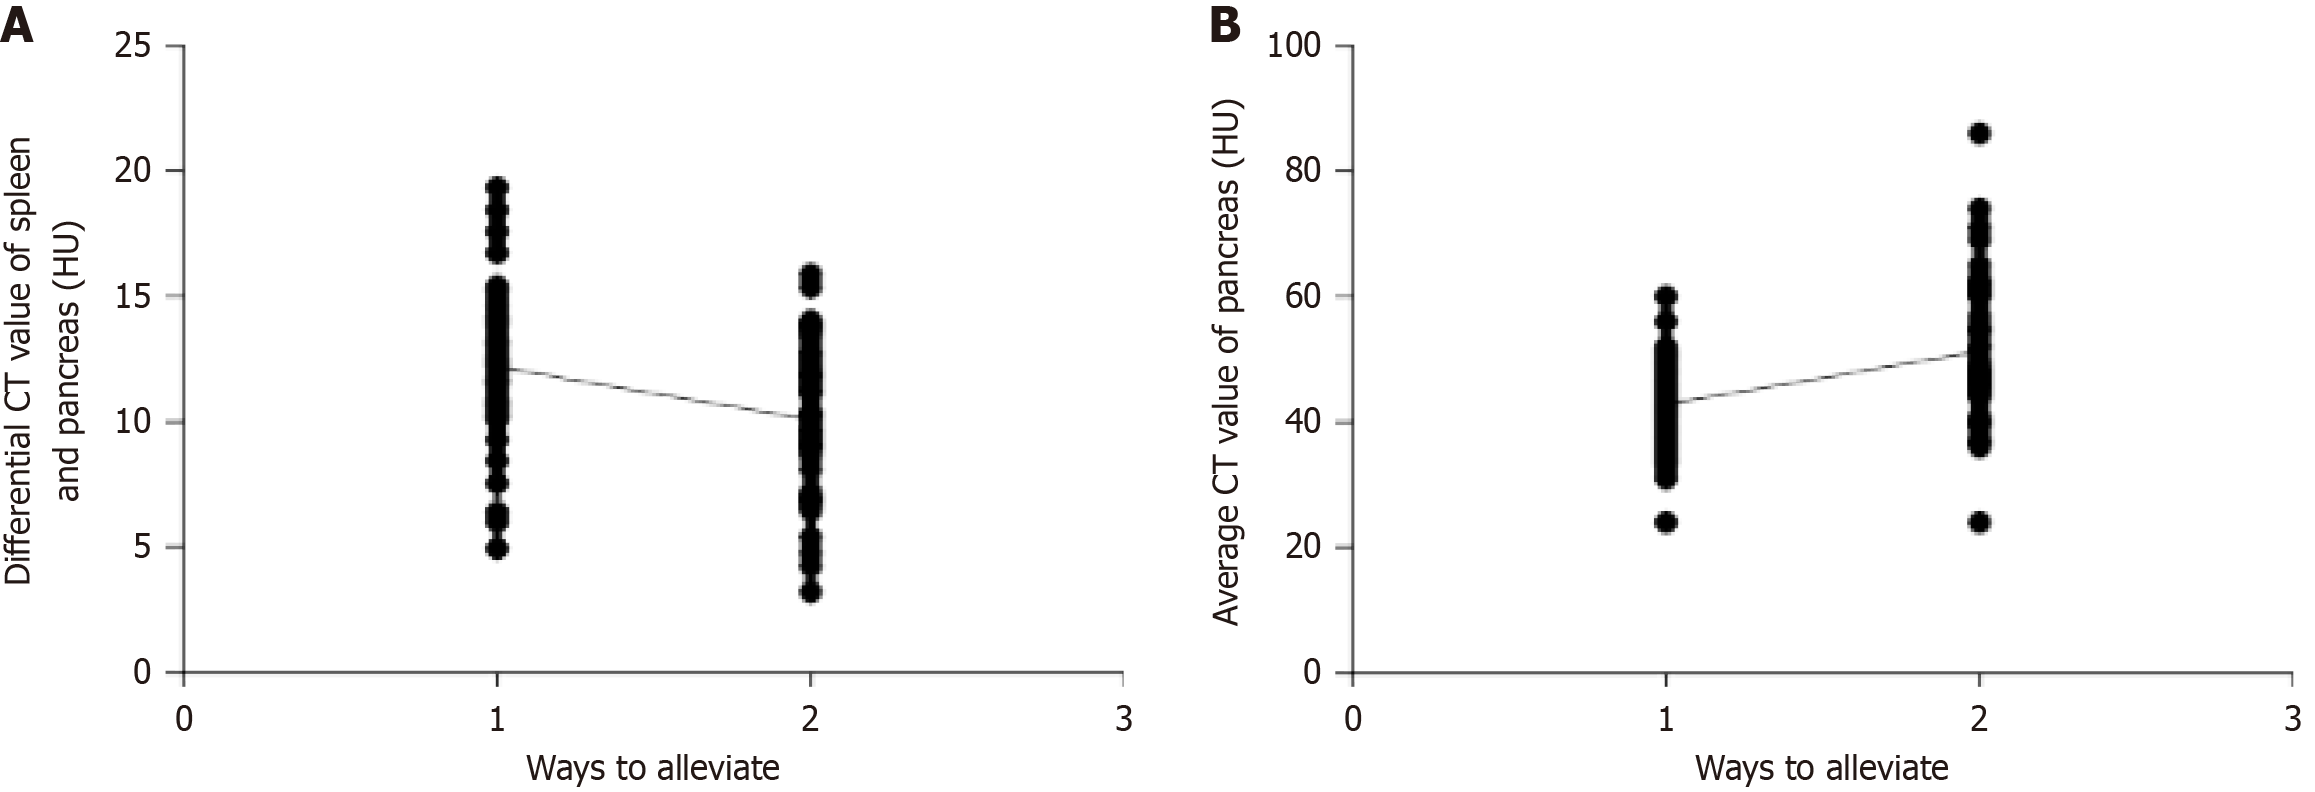
Figure 2 Correlation analysis.
A: Correlation between the two remission methods using differential computed tomography (CT) values of the spleen and pancreas; B: Correlation between the two remission methods using the average CT value of the pancreas. CT: Computed tomography.
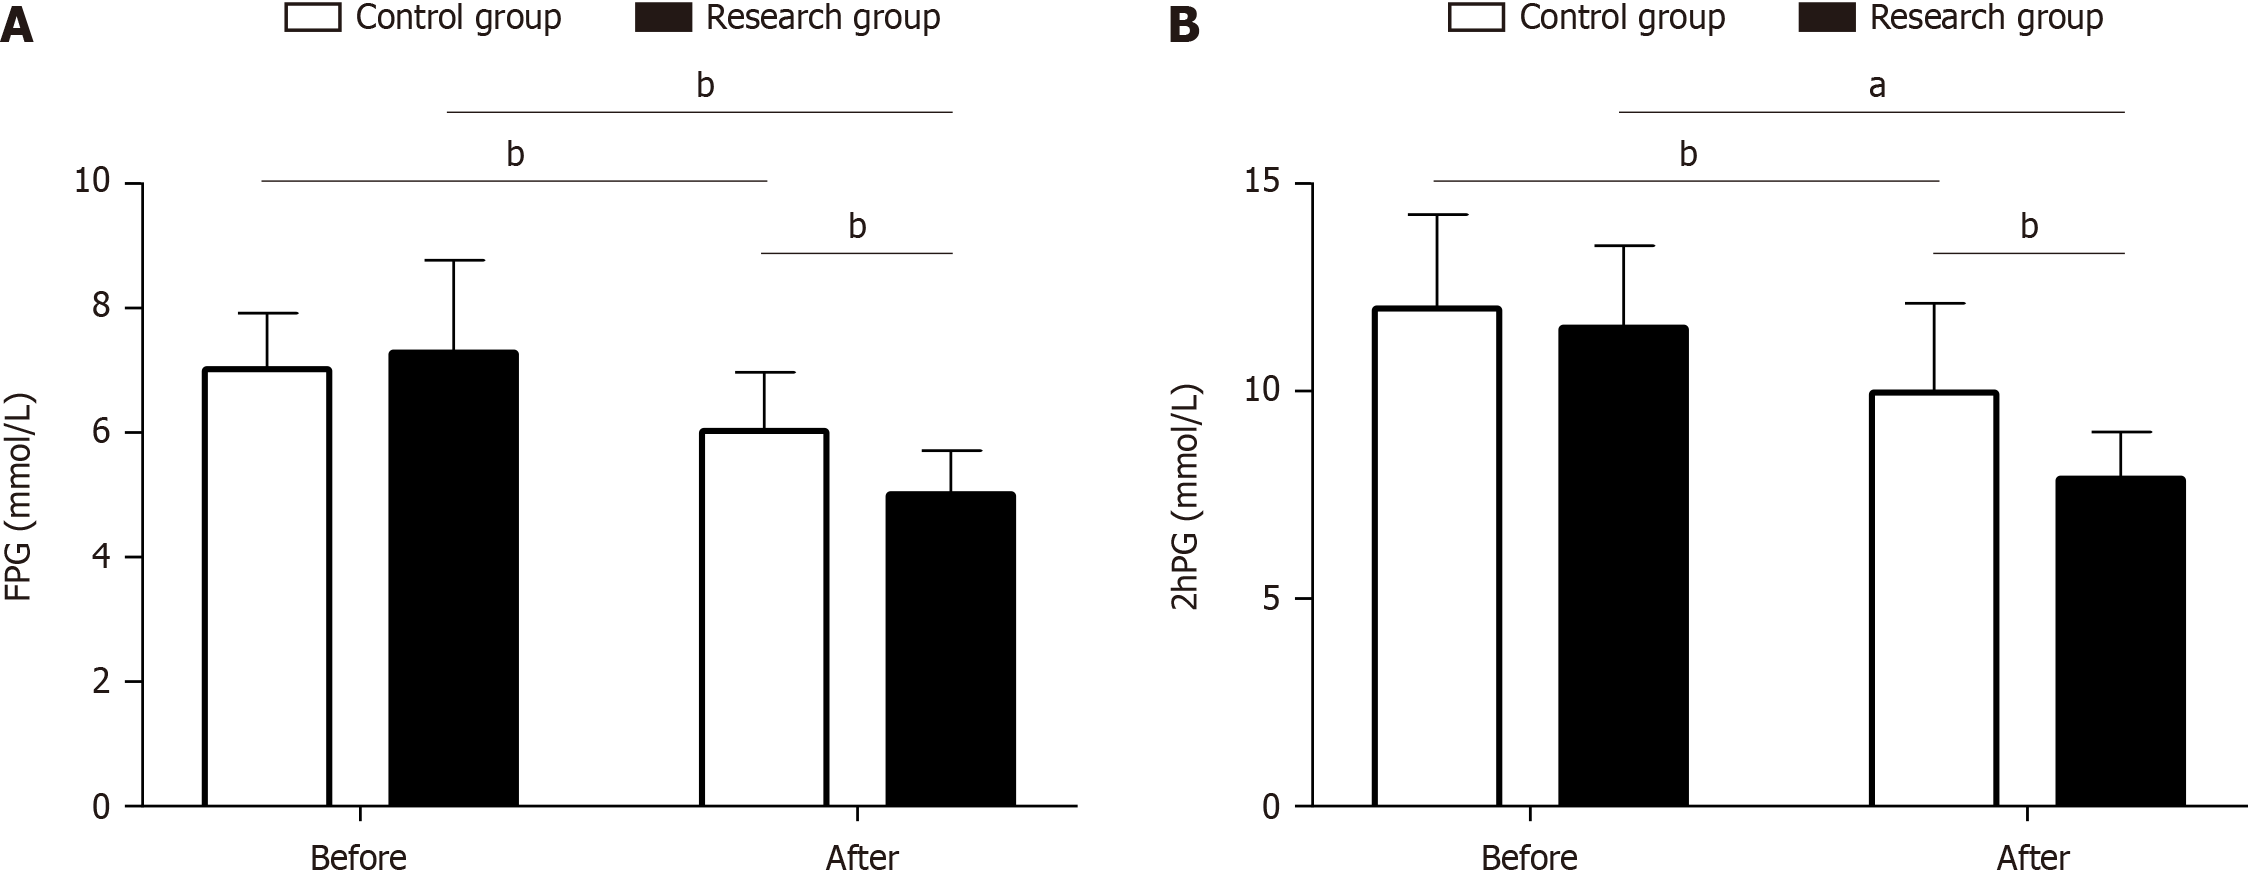
Figure 3 Fasting blood glucose and 2-hour postprandial blood glucose.
A: Comparative analysis of fasting blood glucose; B: Comparative analysis of 2-hour postprandial blood glucose. aP < 0.001. bP < 0.01. FBG: Fasting blood glucose; 2Hpbg: 2-hour postprandial blood glucose.
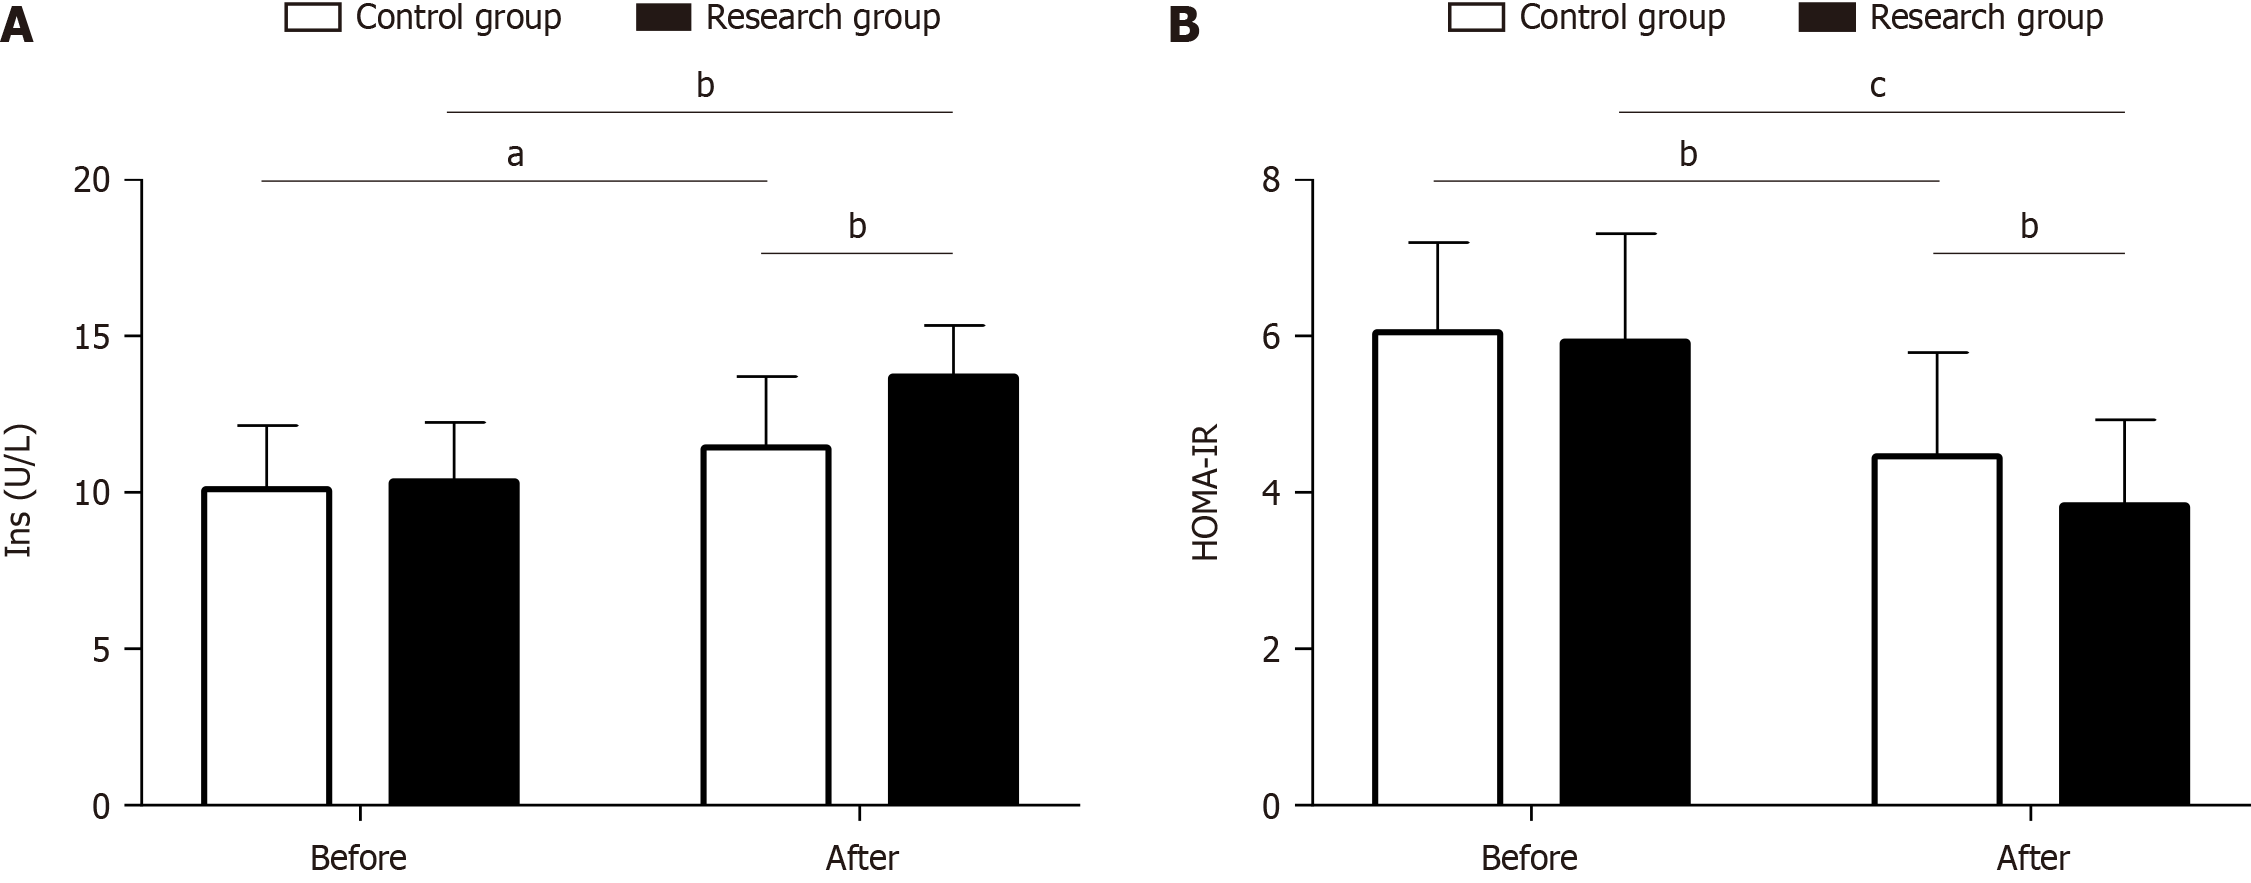
Figure 4 Insulin and homeostasis model assessment of insulin resistance.
A: Comparative analysis of insulin levels; B: Comparative analysis of homeostasis model assessment of insulin resistance results. aP < 0.05. bP < 0.01. cP < 0.001. Ins: Insulin; HOMA-IR: Homeostasis model assessment of insulin resistance.
- Citation: Liu J, Luo Y, Zhu YR, Wu ZT, Hou Y, Xu YJ, Li L, Ma CW. Correlation between type 2 diabetes mellitus remission and intrapancreatic fat deposition. World J Clin Cases 2024; 12(21): 4536-4542
- URL: https://www.wjgnet.com/2307-8960/full/v12/i21/4536.htm
- DOI: https://dx.doi.org/10.12998/wjcc.v12.i21.4536


