Copyright
©The Author(s) 2023.
World J Clin Cases. Feb 16, 2023; 11(5): 1019-1030
Published online Feb 16, 2023. doi: 10.12998/wjcc.v11.i5.1019
Published online Feb 16, 2023. doi: 10.12998/wjcc.v11.i5.1019
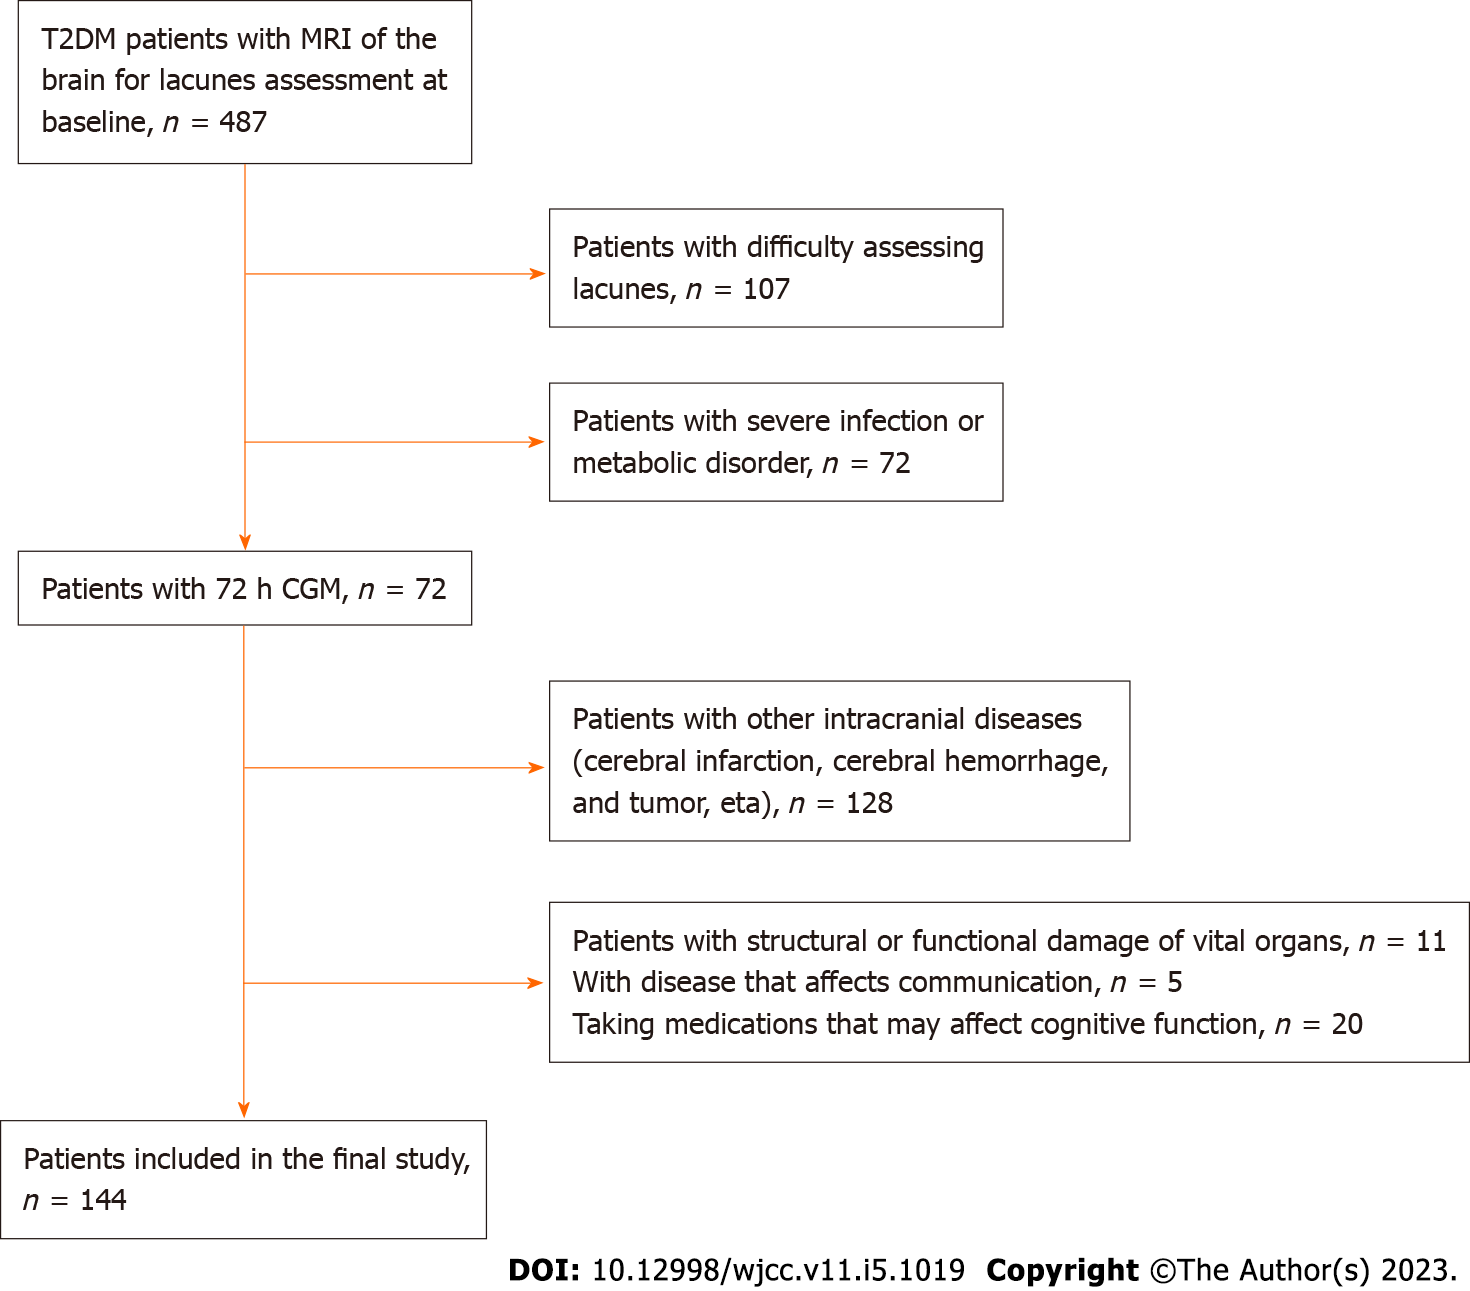
Figure 1 Flowchart of enrollment of study patients.
T2DM: Type 2 diabetes mellitus; MRI: Magnetic resonance imaging; CGM: Continuous blood glucose monitoring.
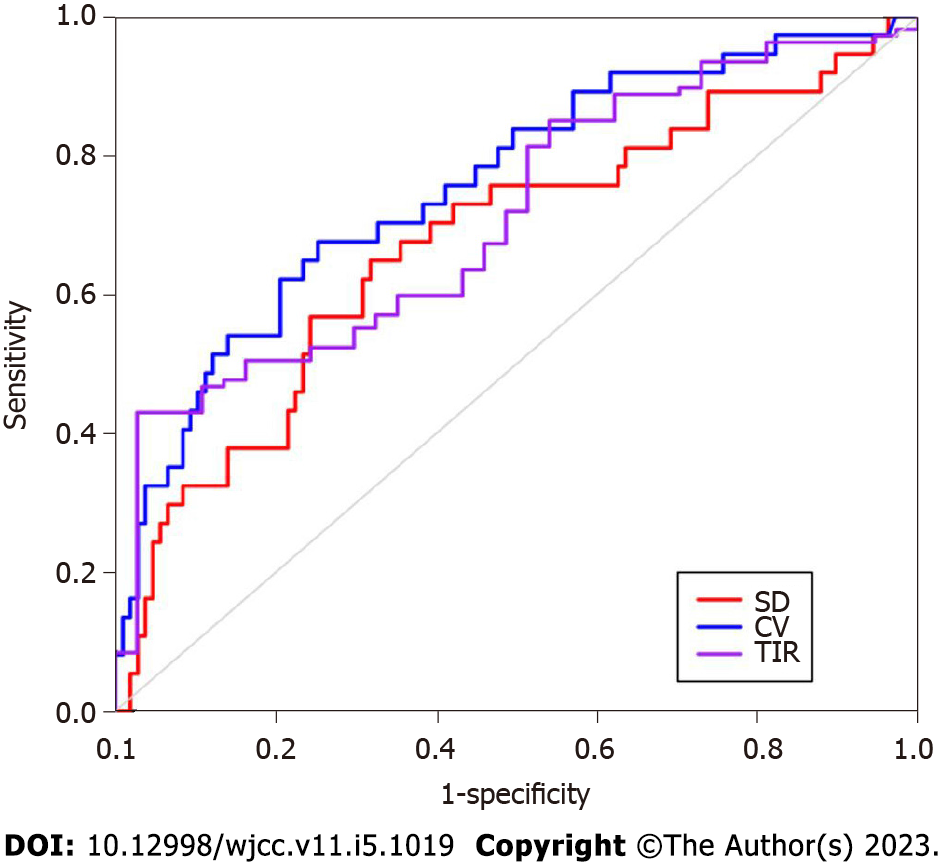
Figure 2 Receiver operating characteristic curve for glycemic variability in predicting cognitive impairment in patients with lacunes complicated with type 2 diabetes.
SD: Standard deviation; %CV: Percentage coefficient of variation; TIR: Time in range.
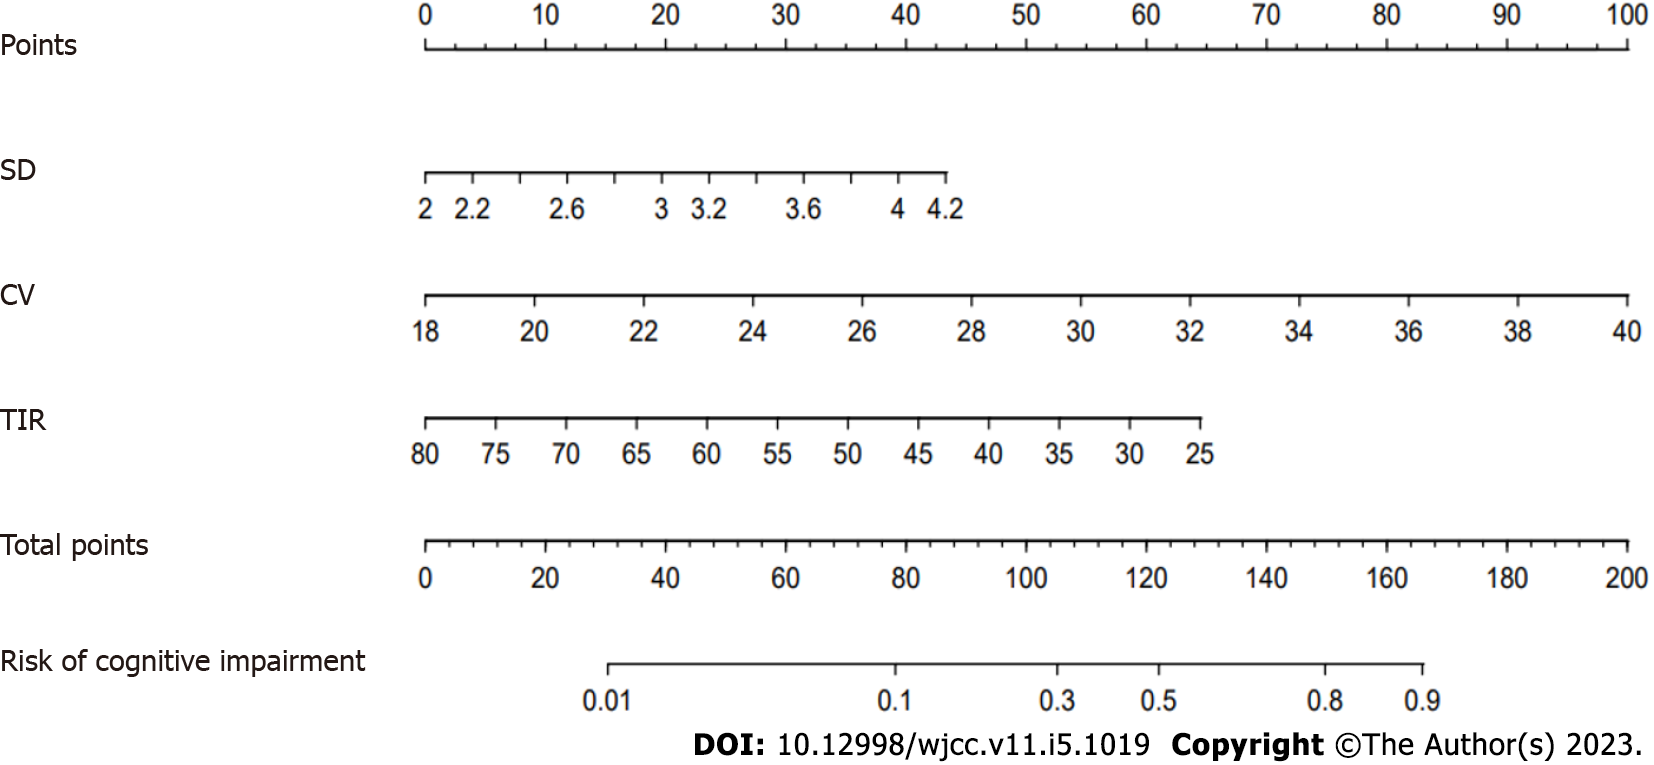
Figure 3 Nomogram model for predicting the risk of cognitive impairment in patients with lacunes complicated with type 2 diabetes.
SD: Standard deviation; %CV: Percentage coefficient of variation; TIR: Time in range.
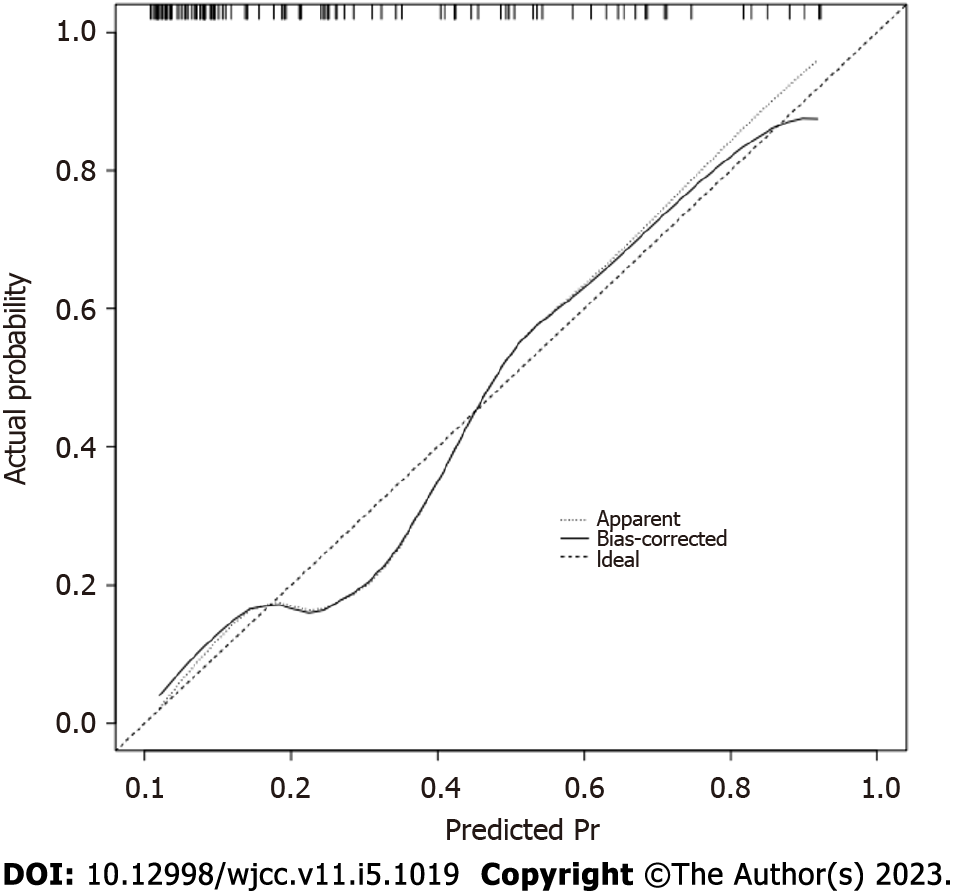
Figure 4
Internal calibration of the risk prediction model for cognitive impairment in patients with lacunes complicated with type 2 diabetes.
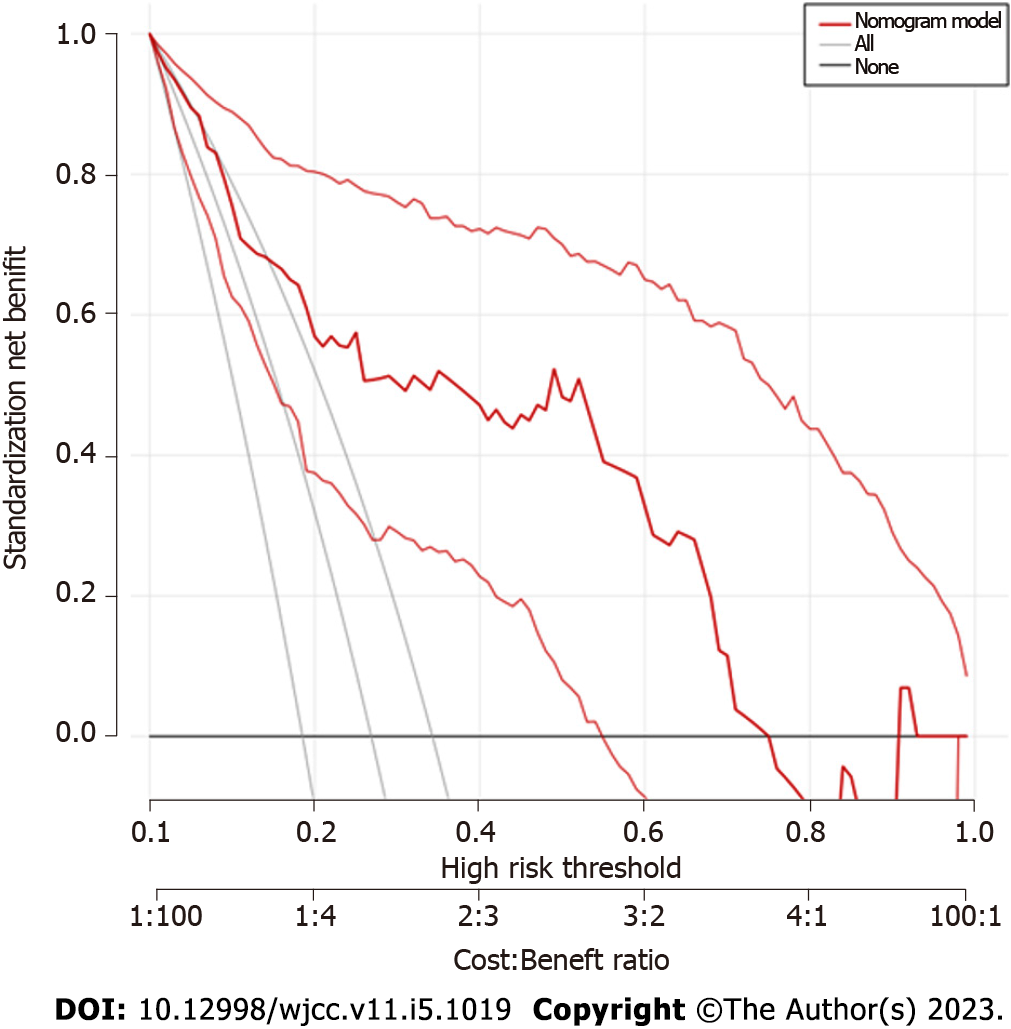
Figure 5
Internal validation of the decision curve analysis of the nomogram prediction model for the risk of cognitive impairment in patients with lacunes complicated with type 2 diabetes.
- Citation: Meng QZ, Wang Y, Li B, Xi Z, Wang M, Xiu JQ, Yang XP. Relationship between glycemic variability and cognitive function in lacune patients with type 2 diabetes. World J Clin Cases 2023; 11(5): 1019-1030
- URL: https://www.wjgnet.com/2307-8960/full/v11/i5/1019.htm
- DOI: https://dx.doi.org/10.12998/wjcc.v11.i5.1019


