Copyright
©The Author(s) 2022.
World J Clin Cases. Mar 16, 2022; 10(8): 2543-2549
Published online Mar 16, 2022. doi: 10.12998/wjcc.v10.i8.2543
Published online Mar 16, 2022. doi: 10.12998/wjcc.v10.i8.2543
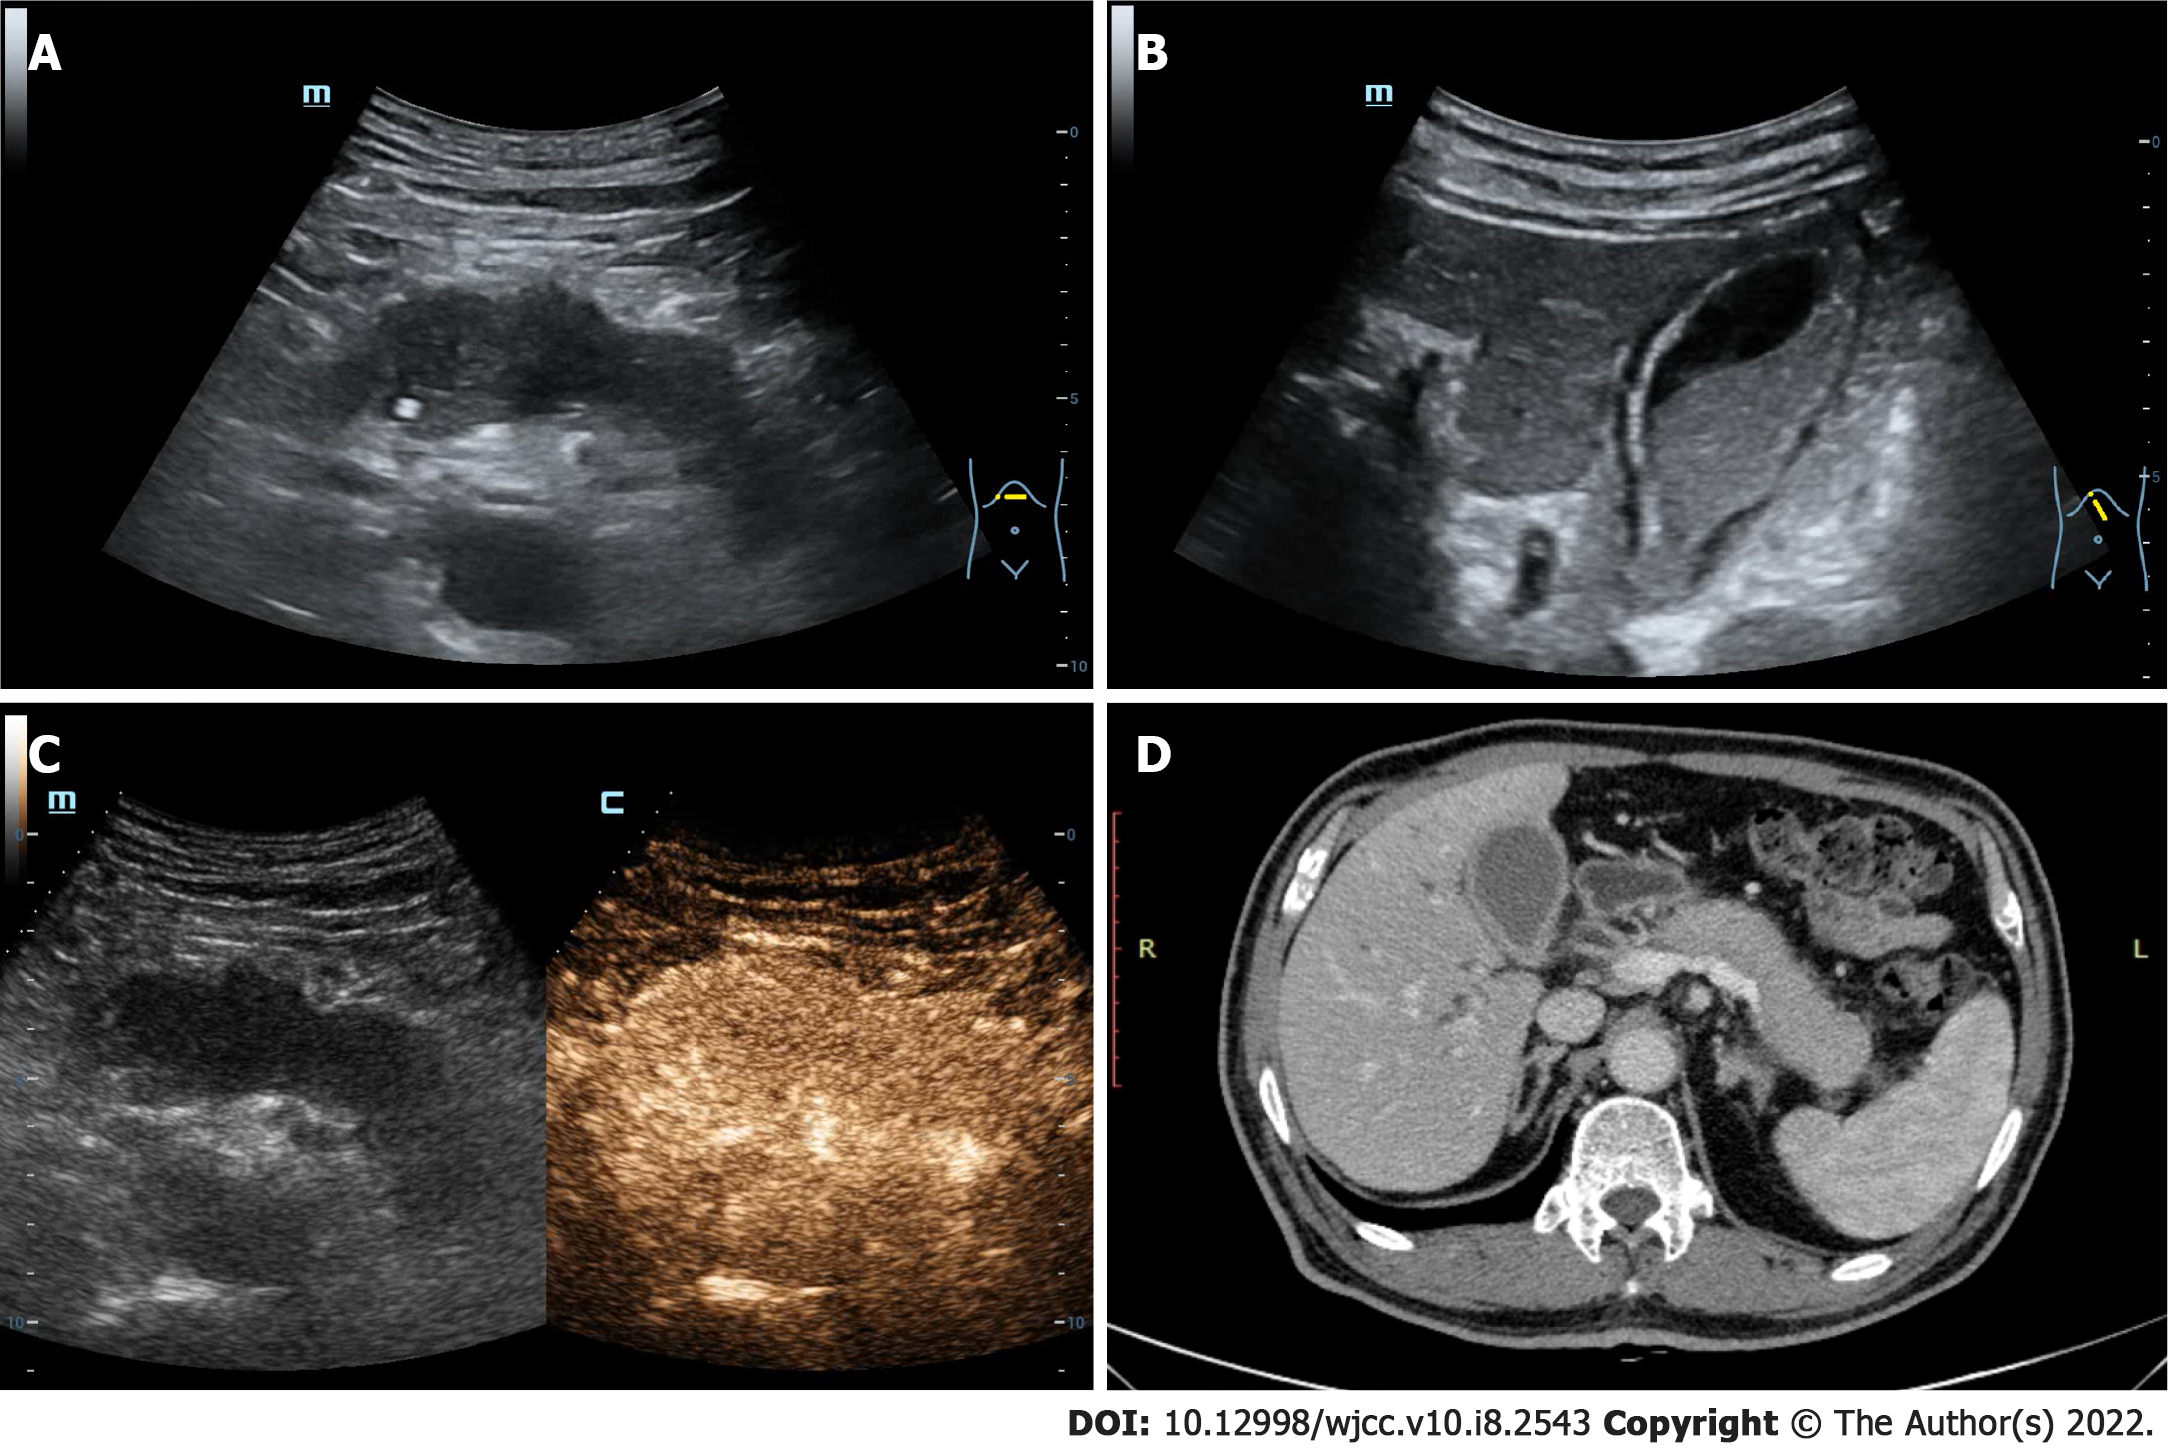
Figure 1 The ultrasound and computed tomography images of pancreas and gallbladder.
A: The pancreas is diffusely enlarged with unclear boundary and the parenchyma echo is reduced; B: The gallbladder volume is enlarged and the wall is rough, accompanying with the silt-like deposits; C: The pancreatic lesions area is uniformly enhanced in arterial phase after the intravenous ultrasound contrast-enhanced; D: Contrast-enhanced computed tomography image revealing that both the pancreas and gallbladder are enlarged and the gallbladder wall is thickened, which are consistent with the ultrasound results.
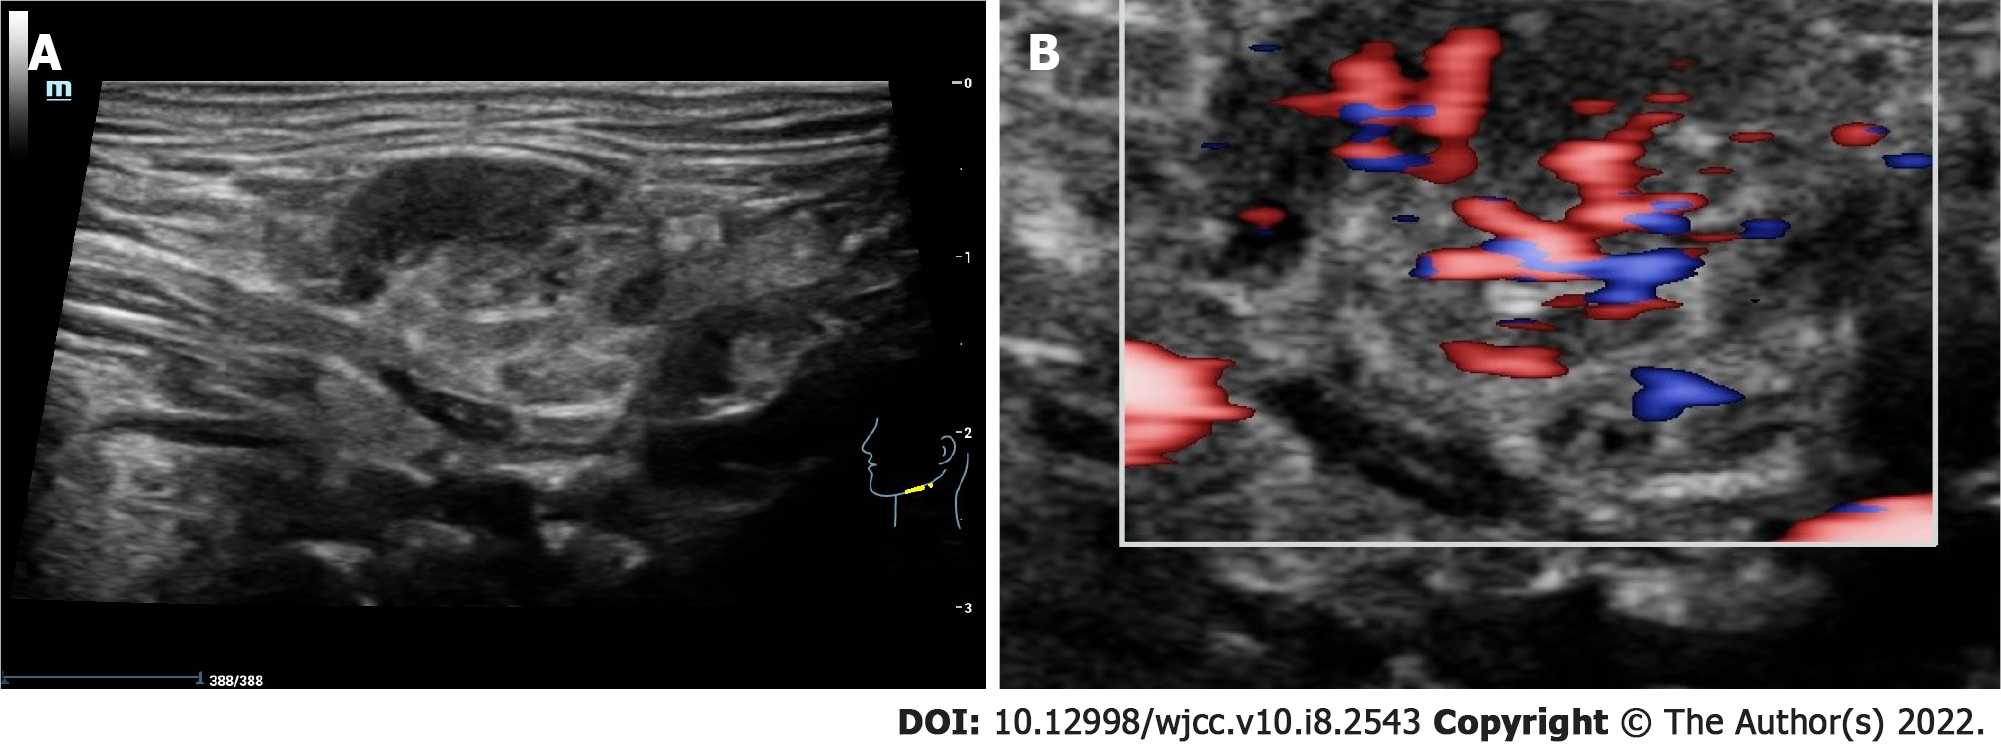
Figure 2 The ultrasound image of the left submandibular gland.
A: The submandibular gland is enlarged and its parenchyma echo is not uniform; B: Color doppler flow imaging suggesting that the blood flow signal is significantly increased.
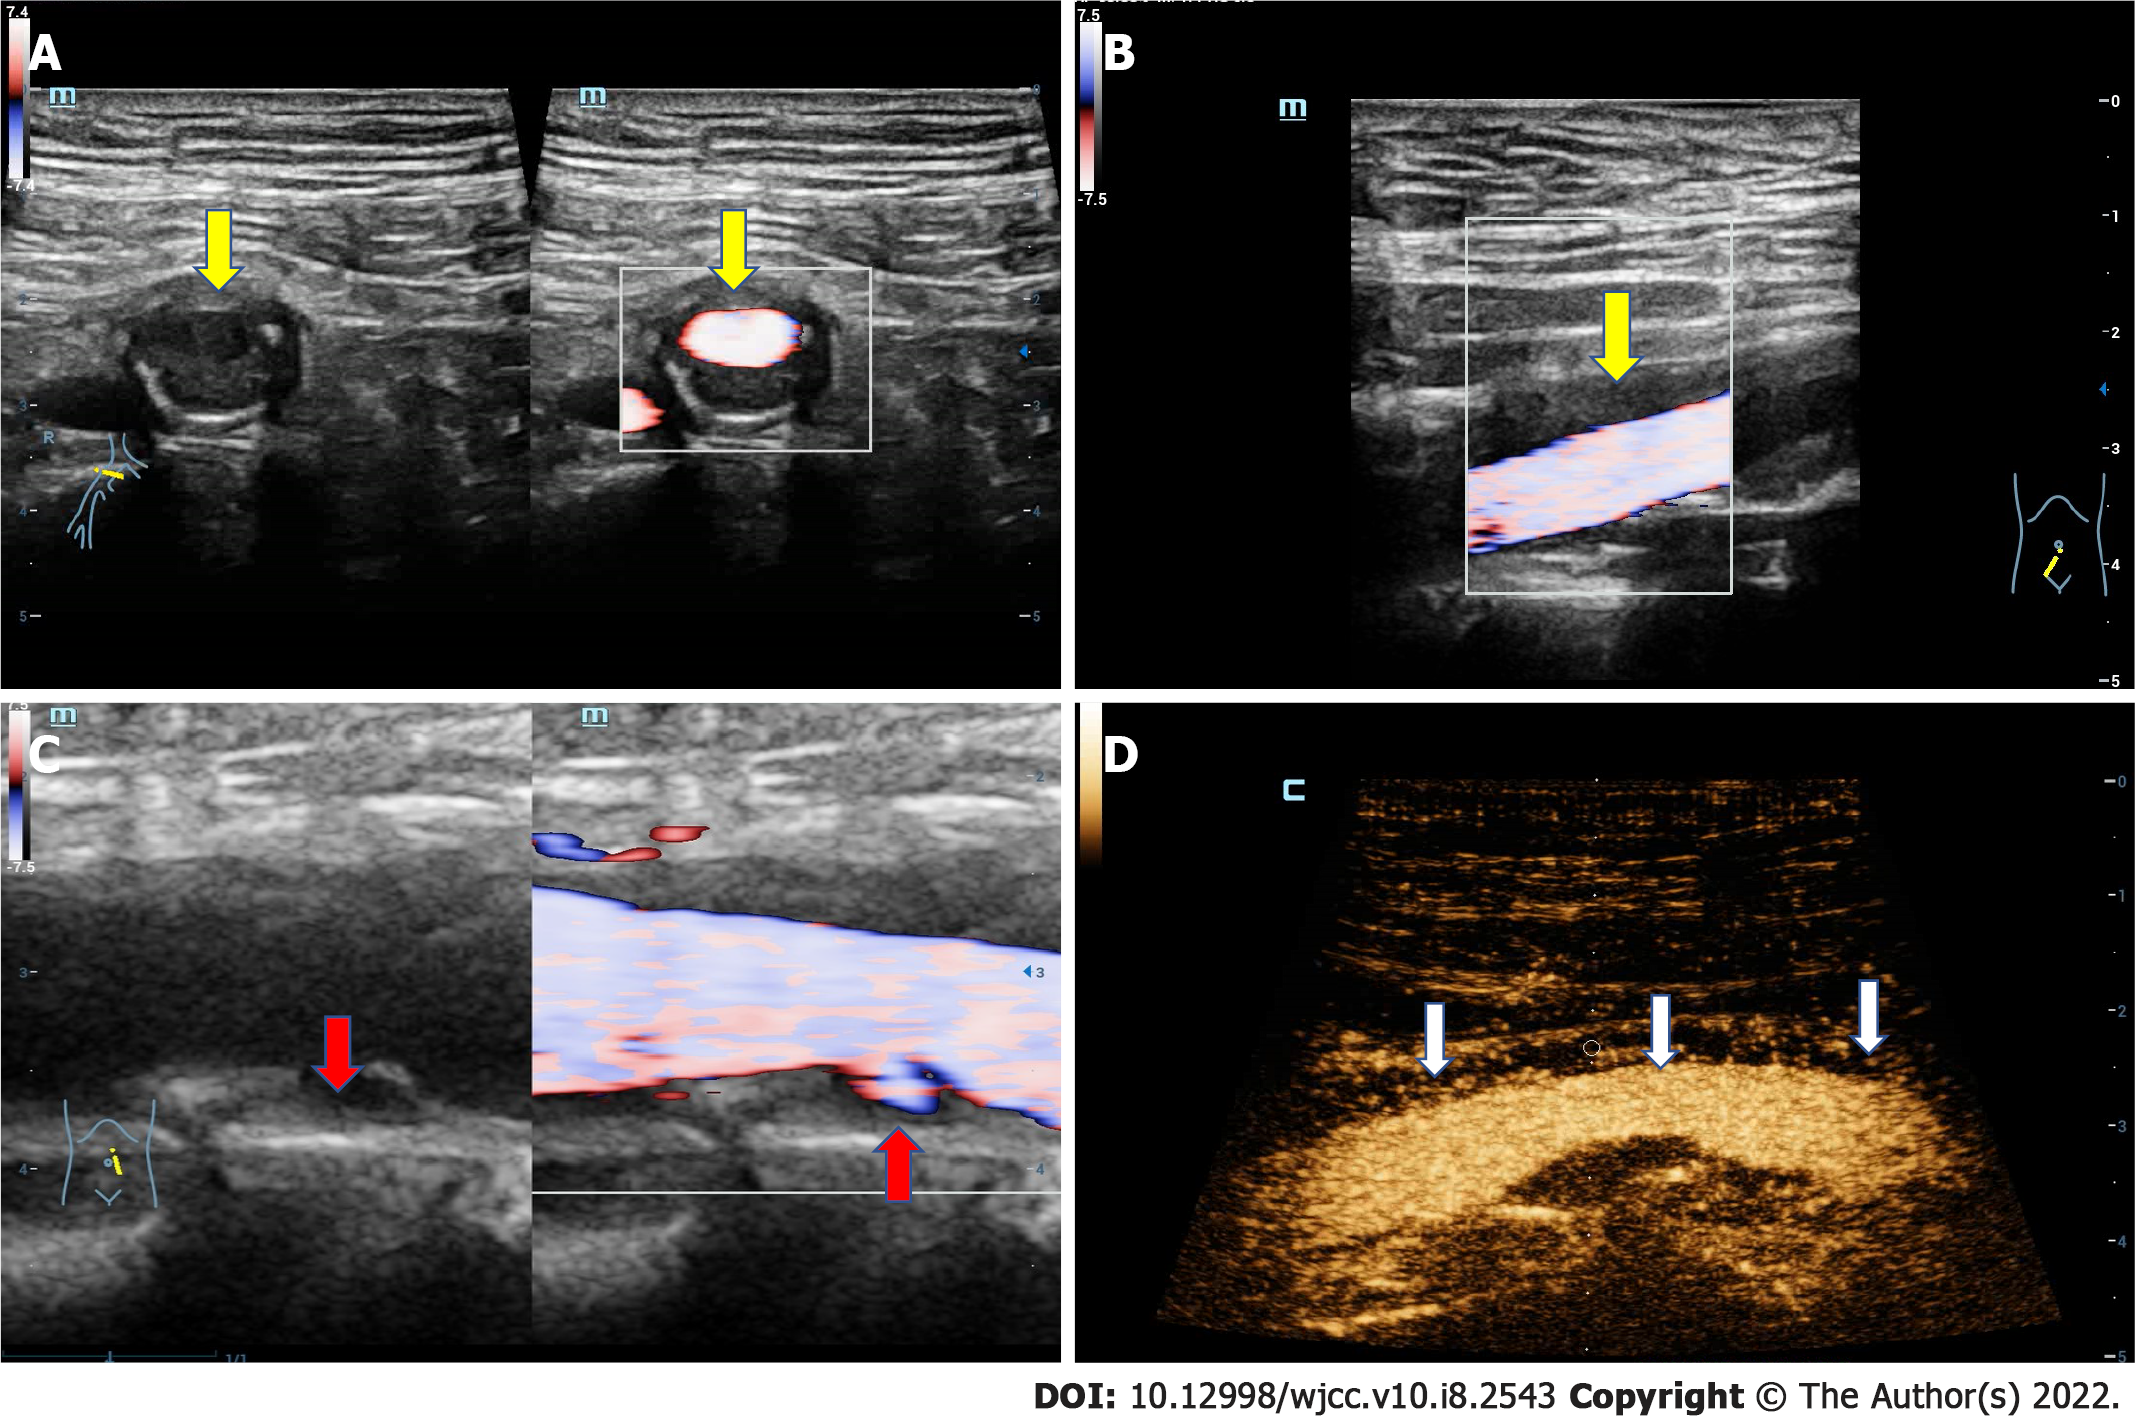
Figure 3 The ultrasound images of the artery.
A: The transverse ultrasound image of iliac artery shows that the adventitia is obviously thickened; B: The longitudinal ultrasound image of iliac artery shows that the adventitia is obviously thickened (yellow arrow); C: The longitudinal section of iliac artery, in which multiple plaques can be clearly seen on the arterial wall, and there is an ulceration in the plaque of the posterior wall (red arrow); D: Contrast-enhanced ultrasound demonstrates that extensive new blood vessels in the adventitia (white arrow).
- Citation: An YQ, Ma N, Liu Y. Immunoglobulin G4-related disease involving multiple systems: A case report. World J Clin Cases 2022; 10(8): 2543-2549
- URL: https://www.wjgnet.com/2307-8960/full/v10/i8/2543.htm
- DOI: https://dx.doi.org/10.12998/wjcc.v10.i8.2543


