Copyright
©The Author(s) 2022.
World J Clin Cases. Mar 16, 2022; 10(8): 2404-2419
Published online Mar 16, 2022. doi: 10.12998/wjcc.v10.i8.2404
Published online Mar 16, 2022. doi: 10.12998/wjcc.v10.i8.2404
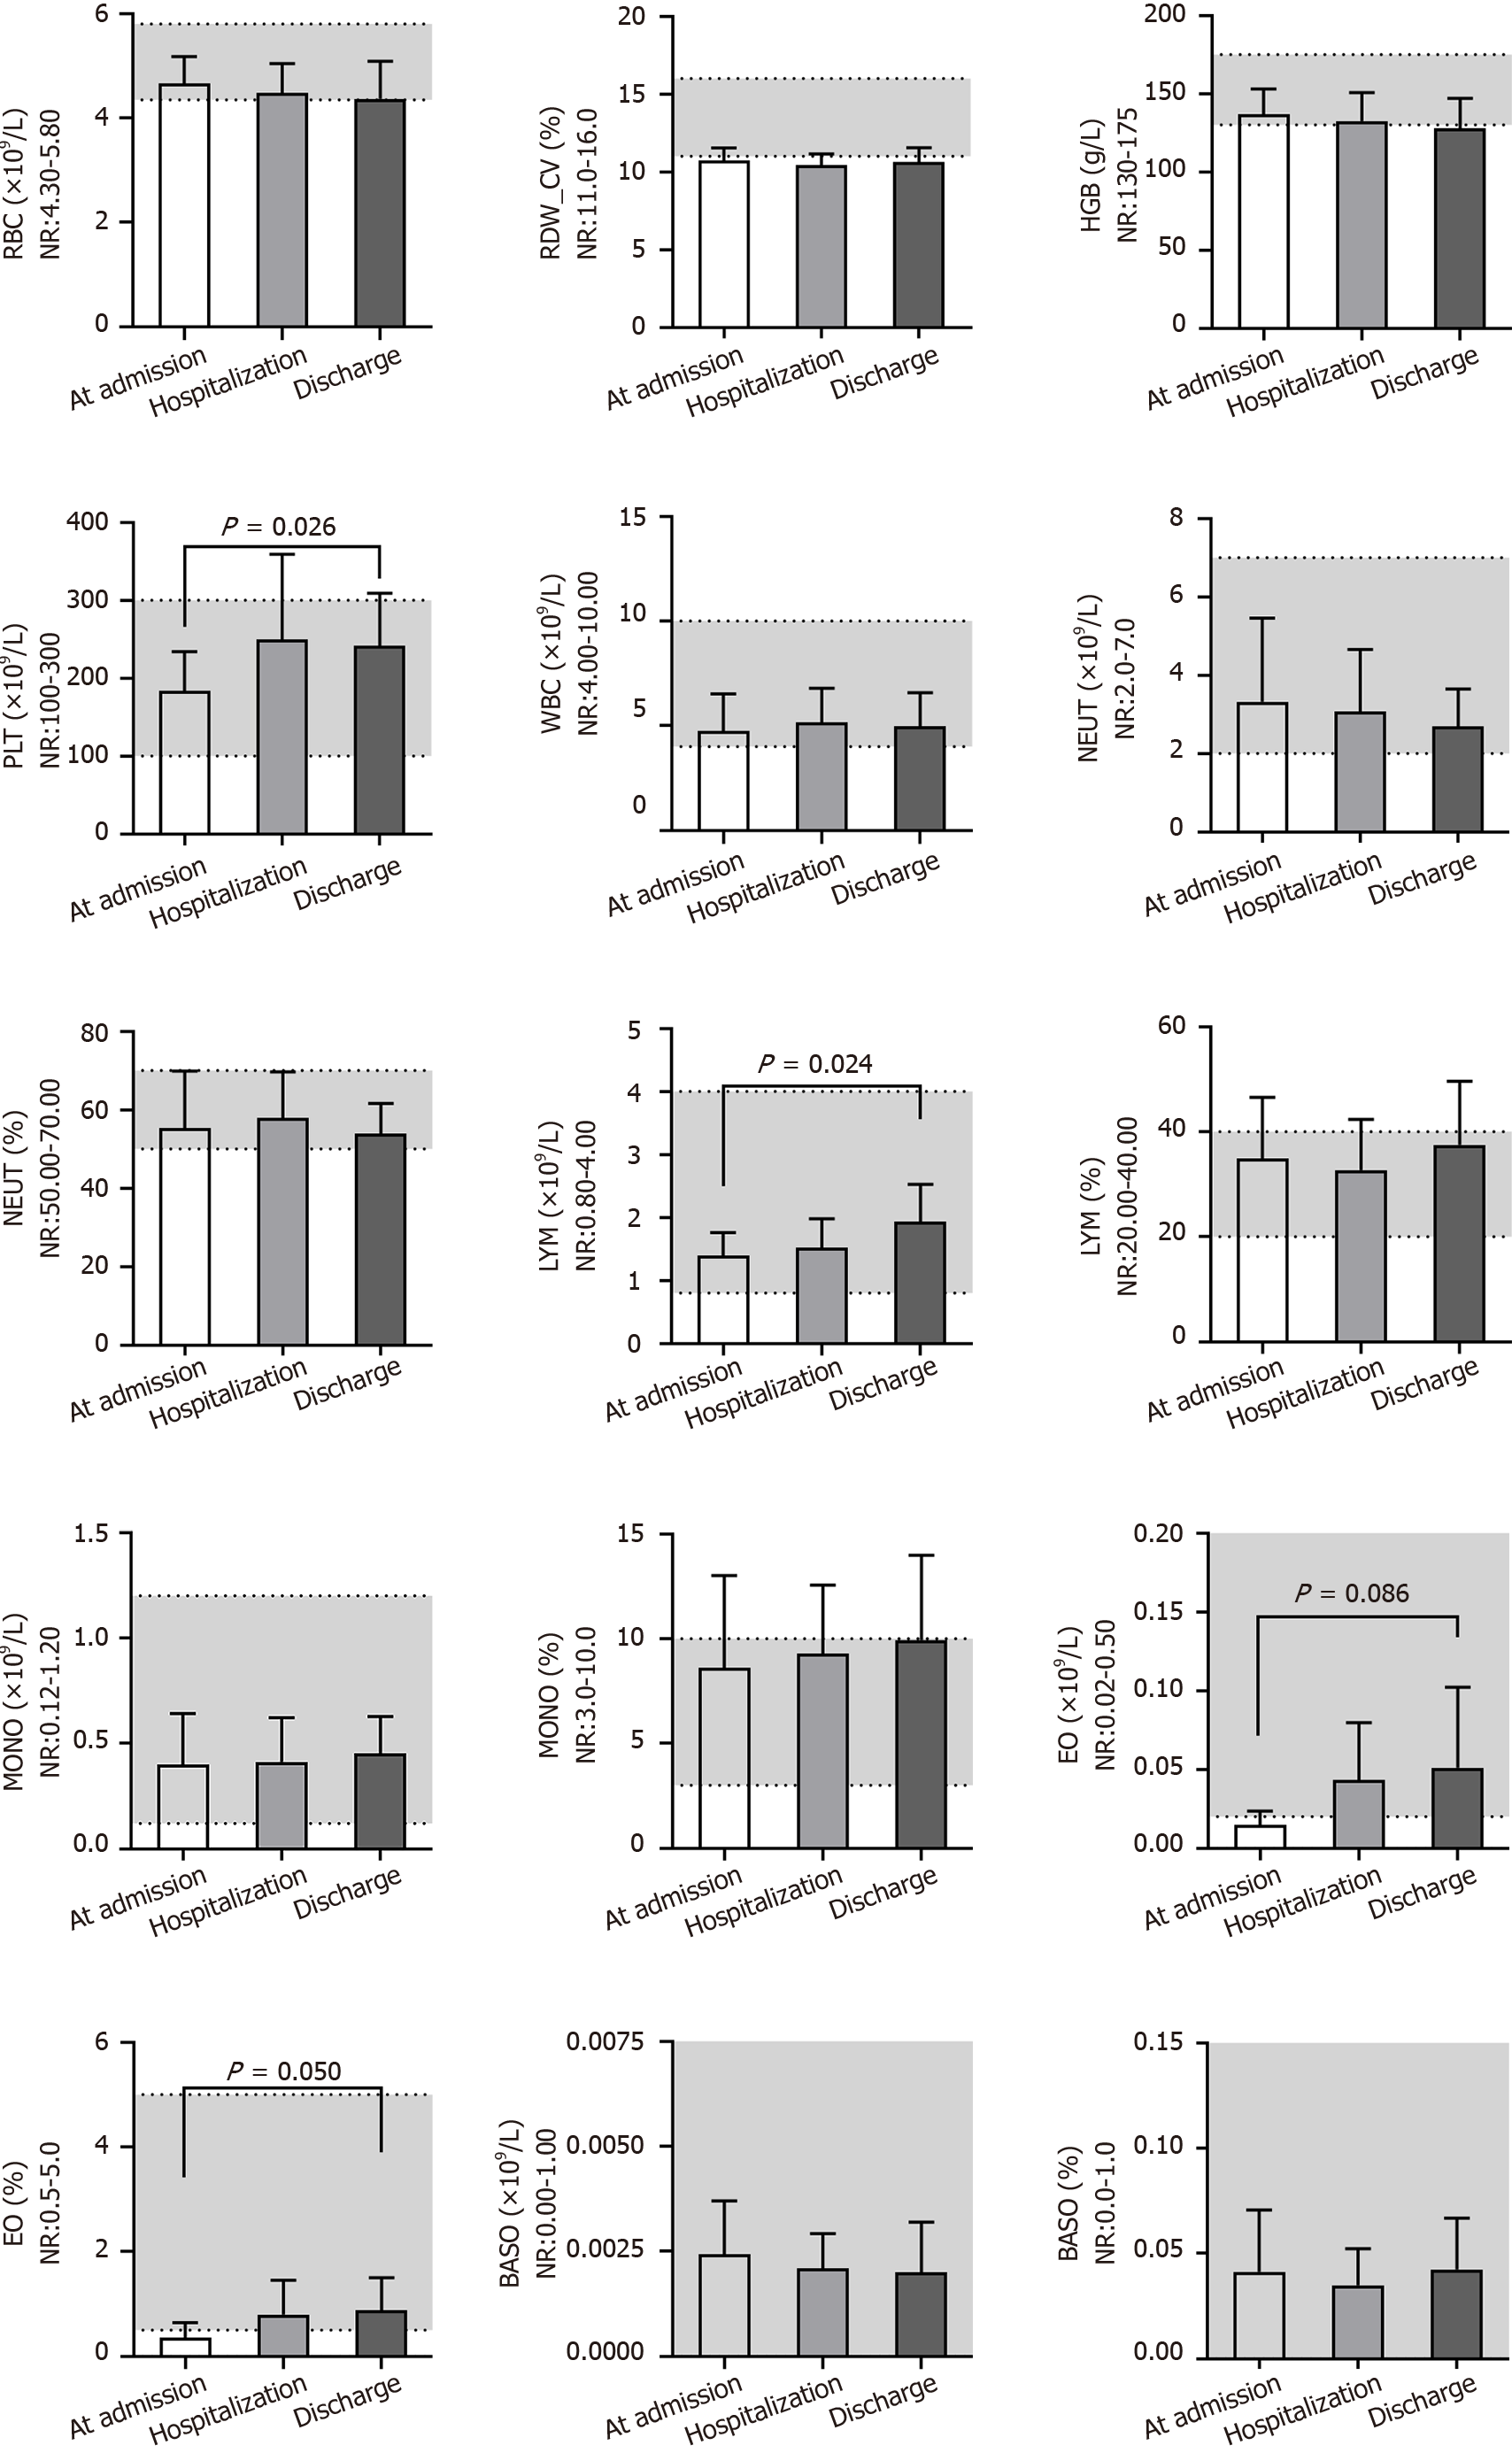
Figure 1 Dynamic changes in routine blood examination indices for patients with coronavirus disease 2019 at admission, upon hospitalization and before discharge.
RBC: Red blood cell; RDW_CV: RBC distribution width_CV; HGB: Hemoglobin; PLT: Platelet; WBC: White blood cell; NEUT: Neutrophil; LYM: Lymphocyte; MONO: Monocyte; EO: Eosinophil; BASO: Basophil; NR: Normal range.
Figure 2 Dynamic changes in the serum erythrocyte sedimentation rate and C-reactive protein levels of patients with coronavirus disease 2019 at admission, upon hospitalization and before discharge.
ESR: Erythrocyte sedimentation rate; CRP: C-reactive protein; hs-CRP: High-sensitivity C-reactive protein; NR: Normal range.
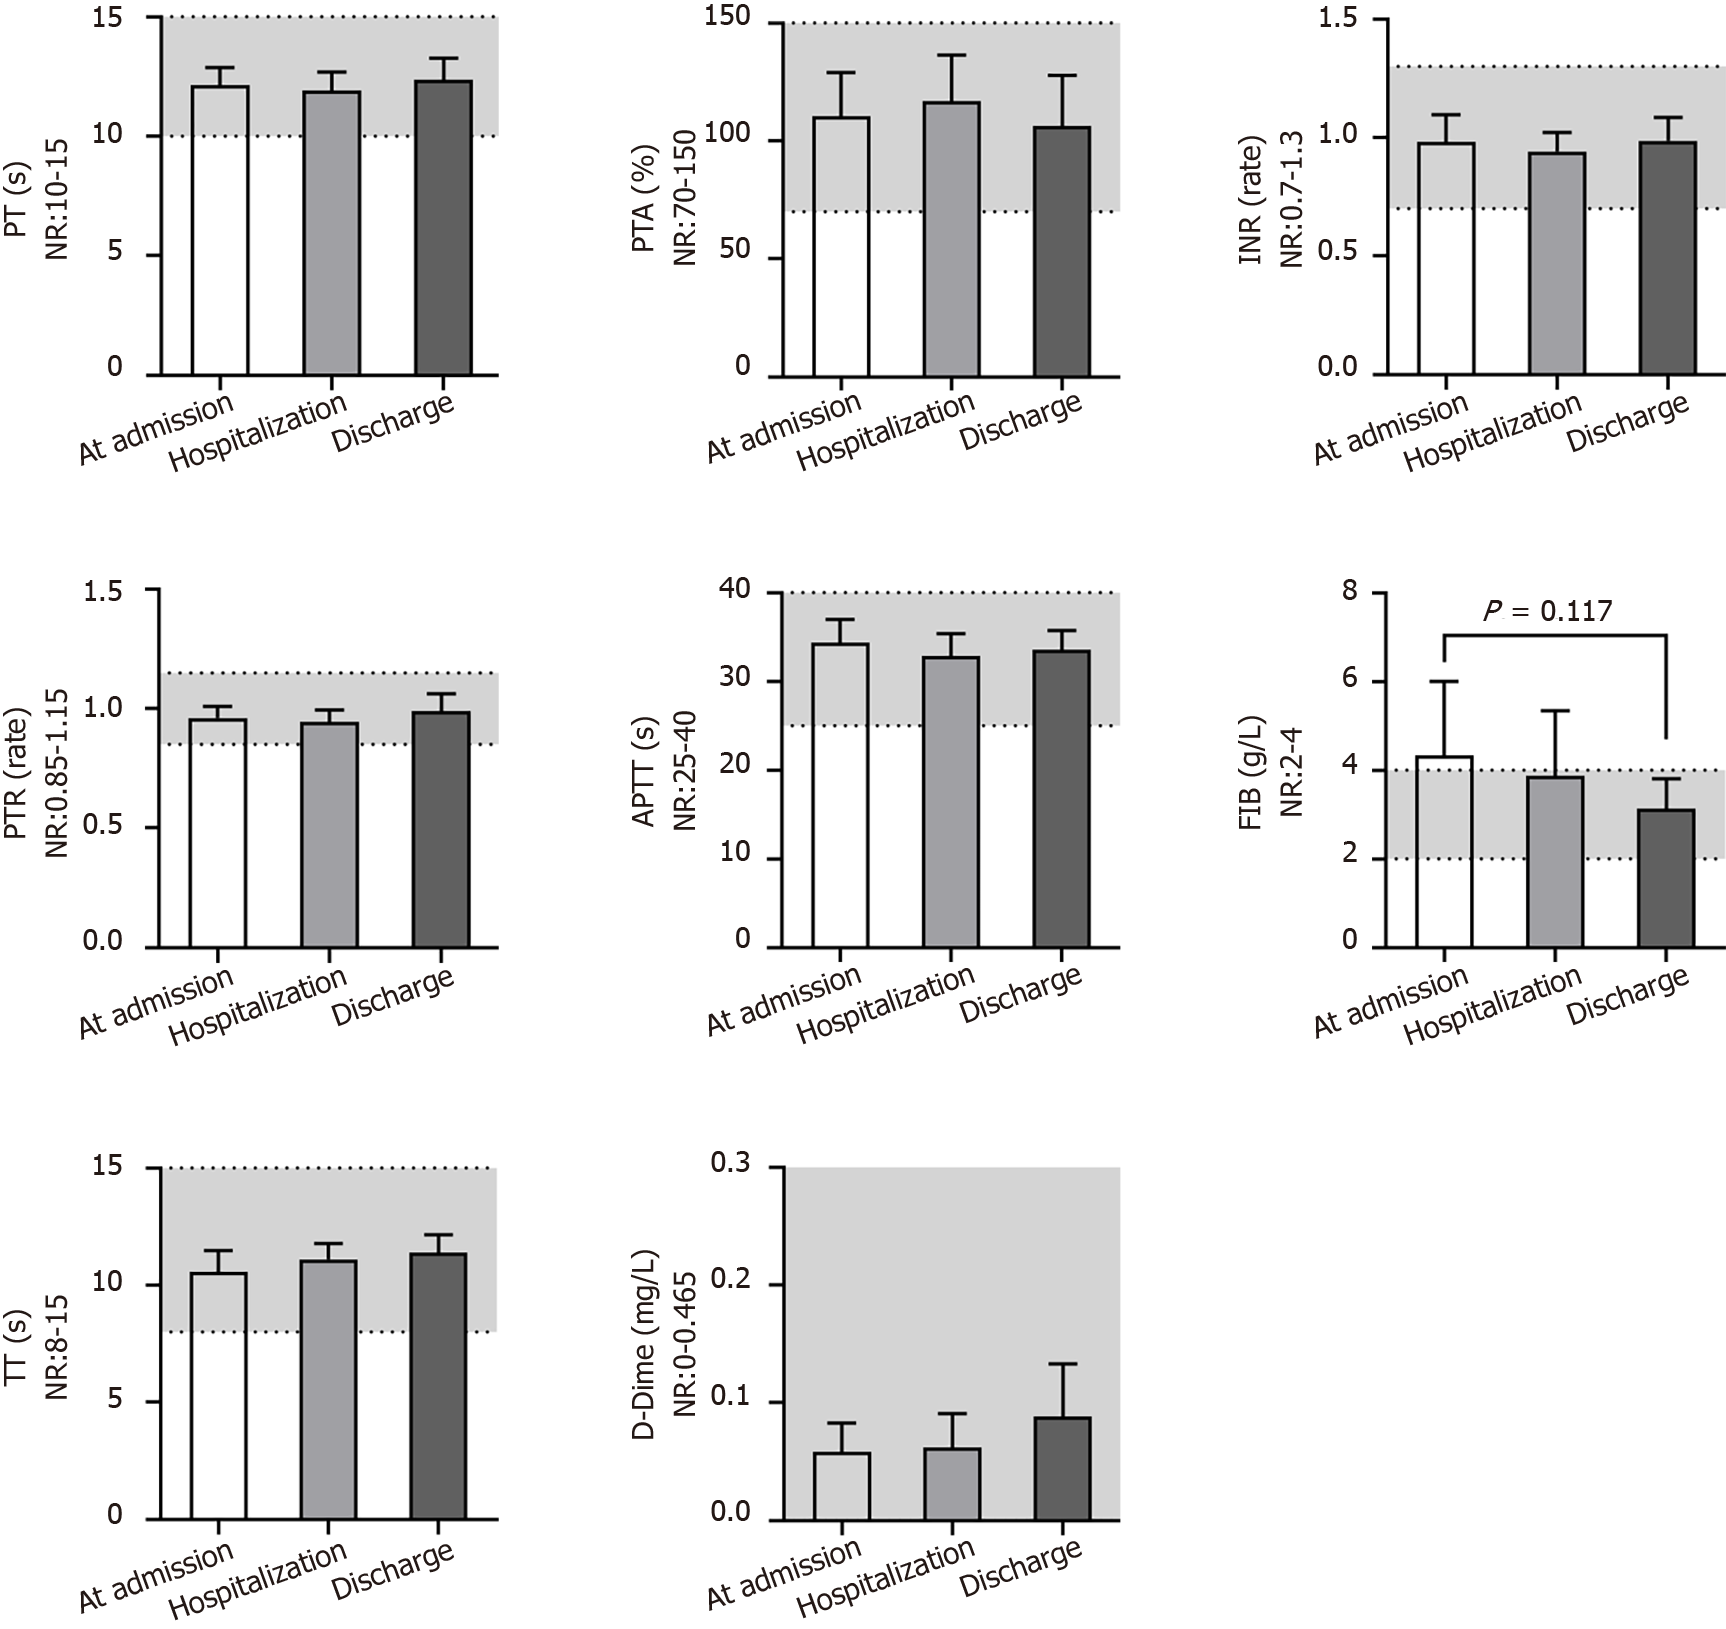
Figure 3 Dynamic changes in coagulation function indices for patients with coronavirus disease 2019 at admission, upon hospitalization and before discharge.
PT: Prothrombin time; PTA: Prothrombin activity; INR: International normalized ratio; PTR: Prothrombin ratio; APTT: Activated partial thromboplastin time; FIB: Fibrinogen; TT: Thrombin time; NR: Normal range.
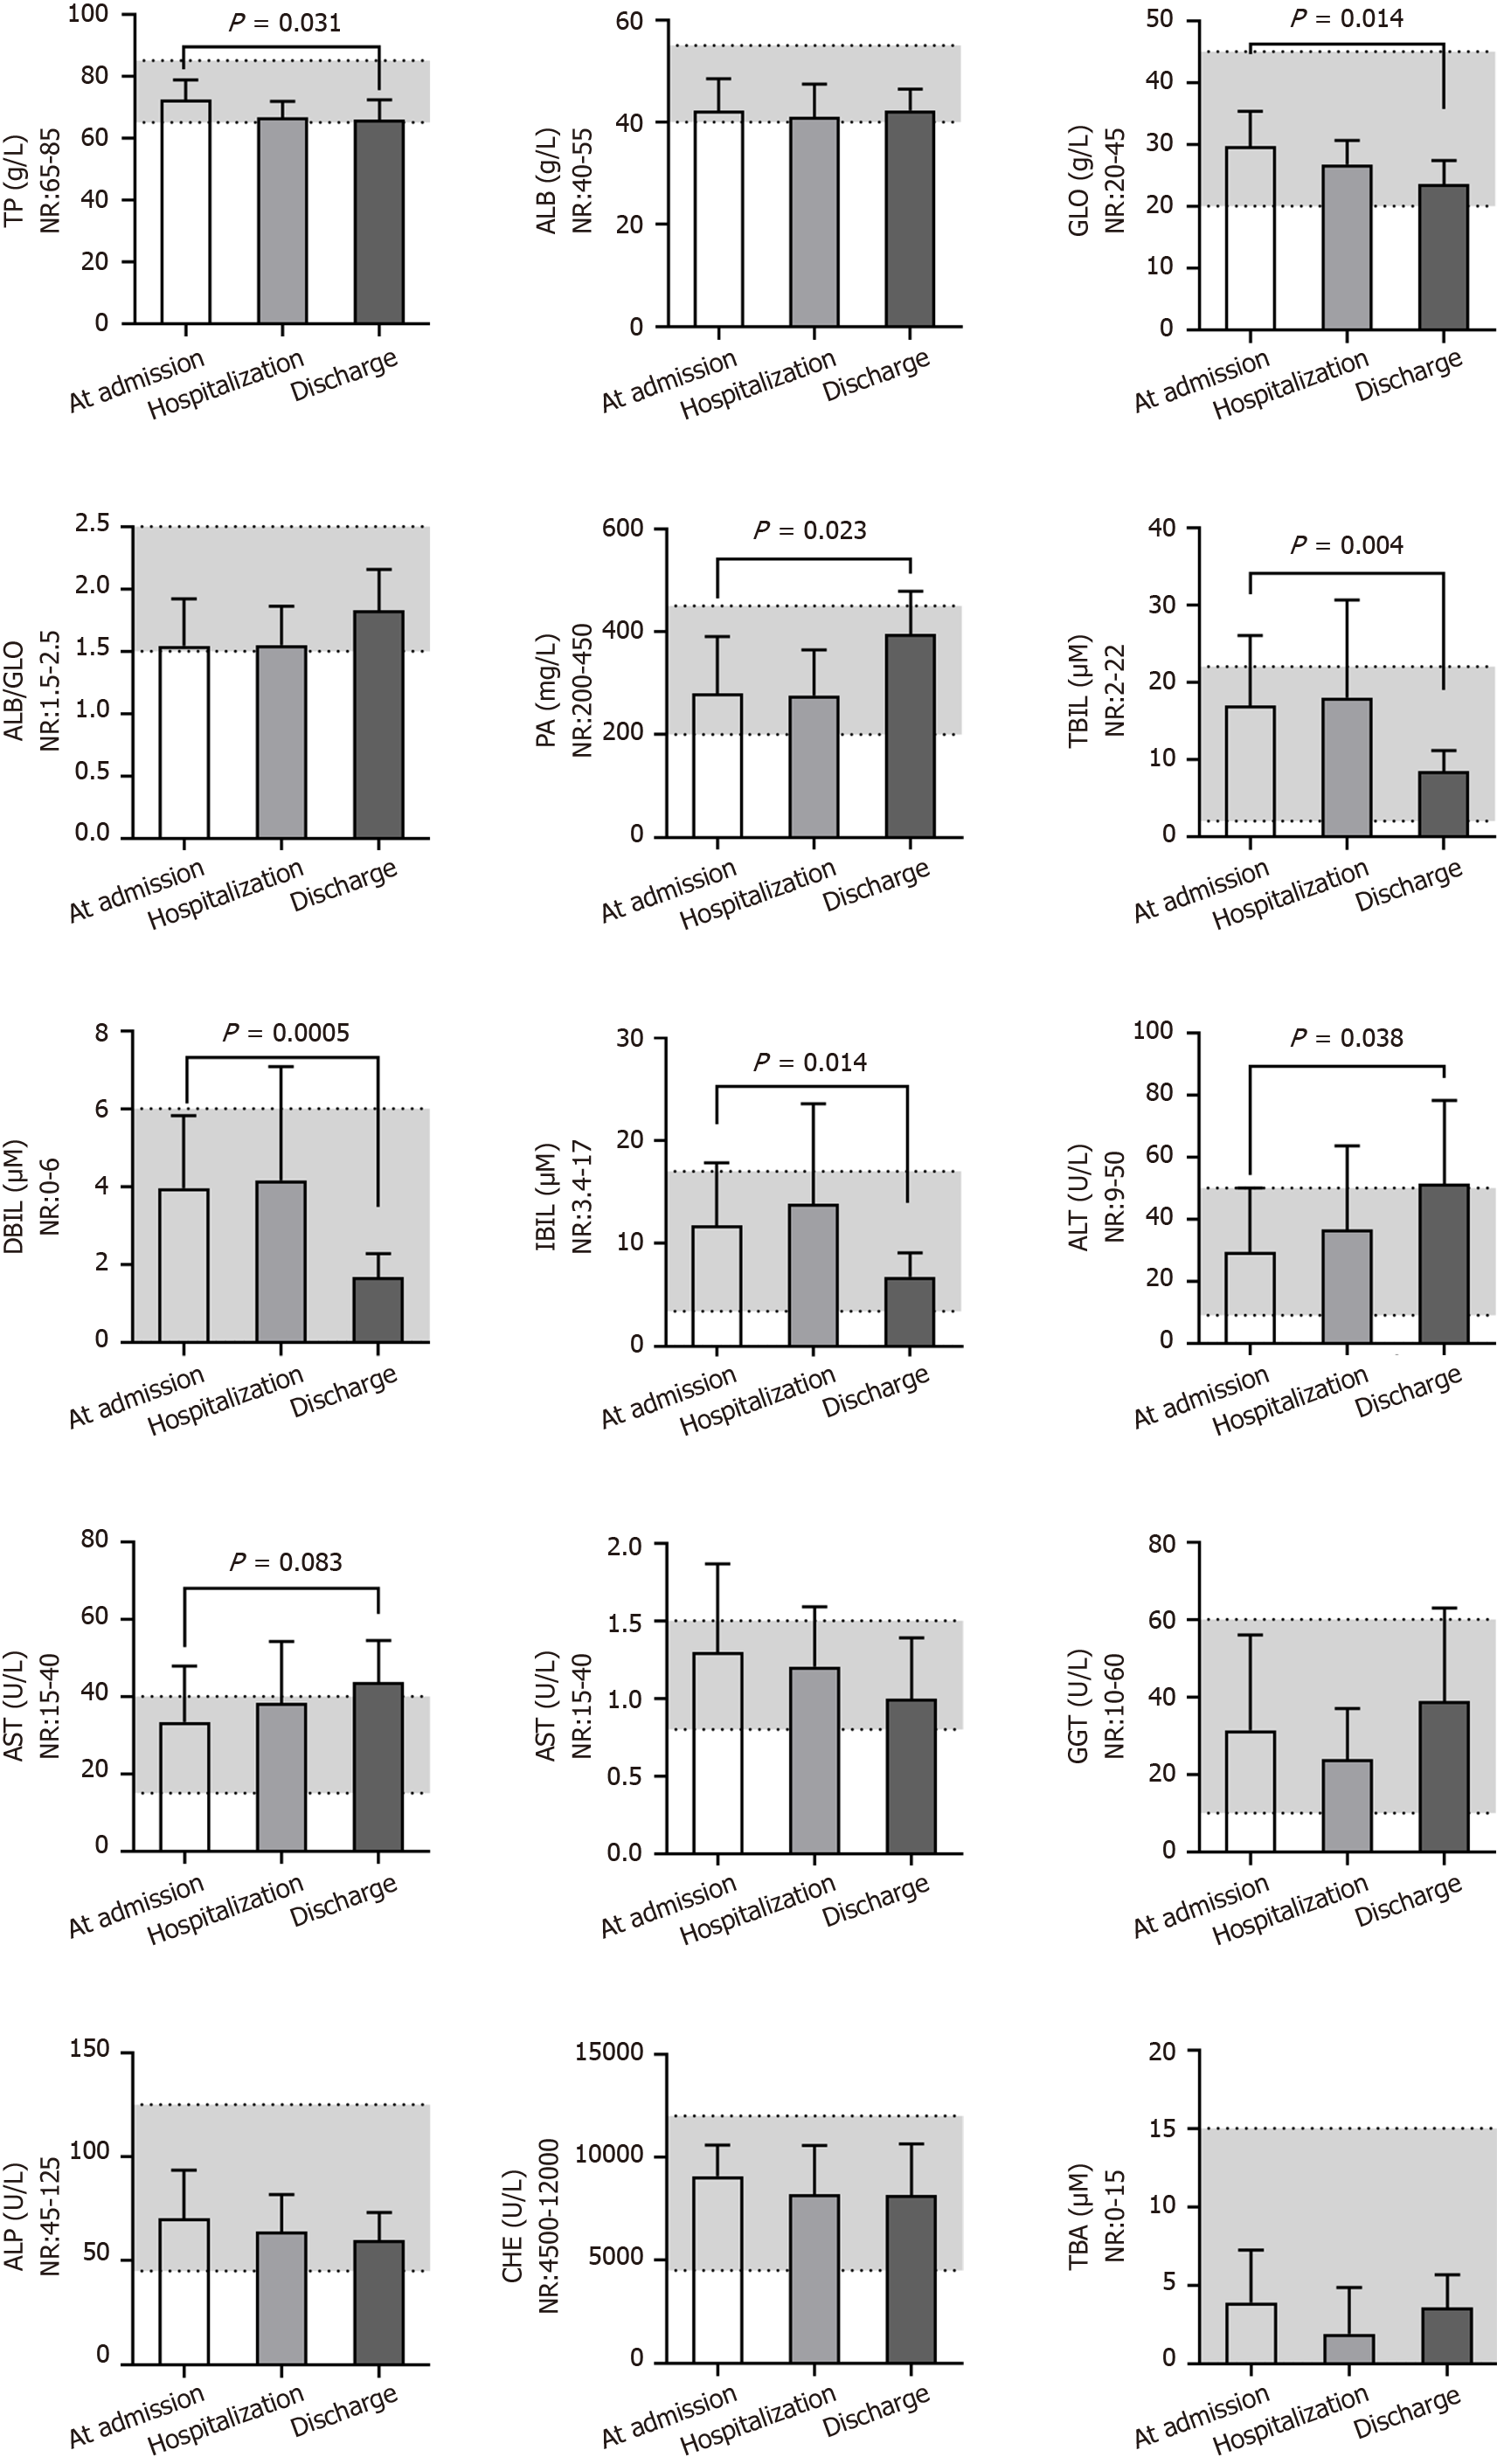
Figure 4 Dynamic changes in liver function indices for patients with coronavirus disease 2019 at admission, upon hospitalization and before discharge.
TP: Total protein; ALB: Albumin; GLO: Globulin; PA: Prealbumin; TBIL: Total bilirubin; DBIL: Direct bilirubin; IBIL: Indirect bilirubin; ALT: Alanine transaminase; AST: Aspartate transferase; GGT: Glutamyl transpeptidase; ALP: Alkaline phosphatase; CHE: Cholinesterase; TBA: Total bile acid; NR: Normal range.
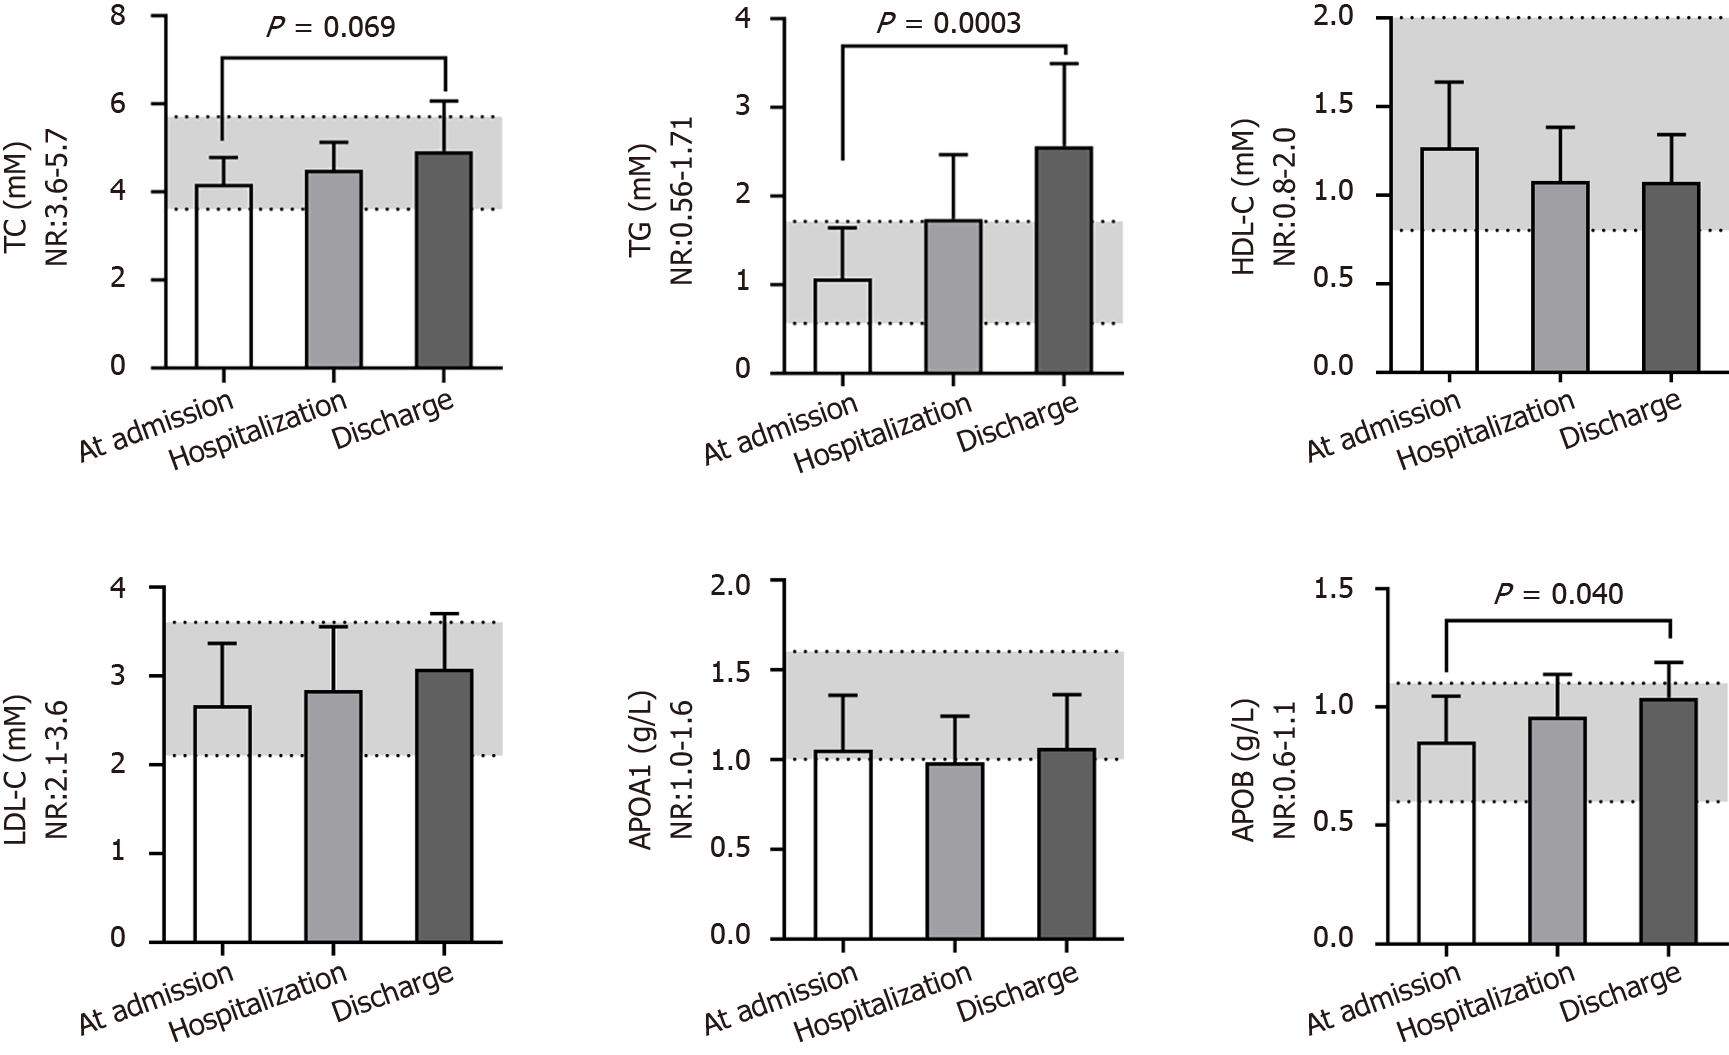
Figure 5 Dynamic changes in blood lipid indices for patients with coronavirus disease 2019 at admission, upon hospitalization and before discharge.
TC: Total cholesterol; TG: Triglyceride; HDL-C: High-density lipoprotein cholesterol; LDL-C: Low-density lipoprotein cholesterol; APOPA1: Apolipoprotein A1; APOB: Apolipoprotein B; NR: Normal range.
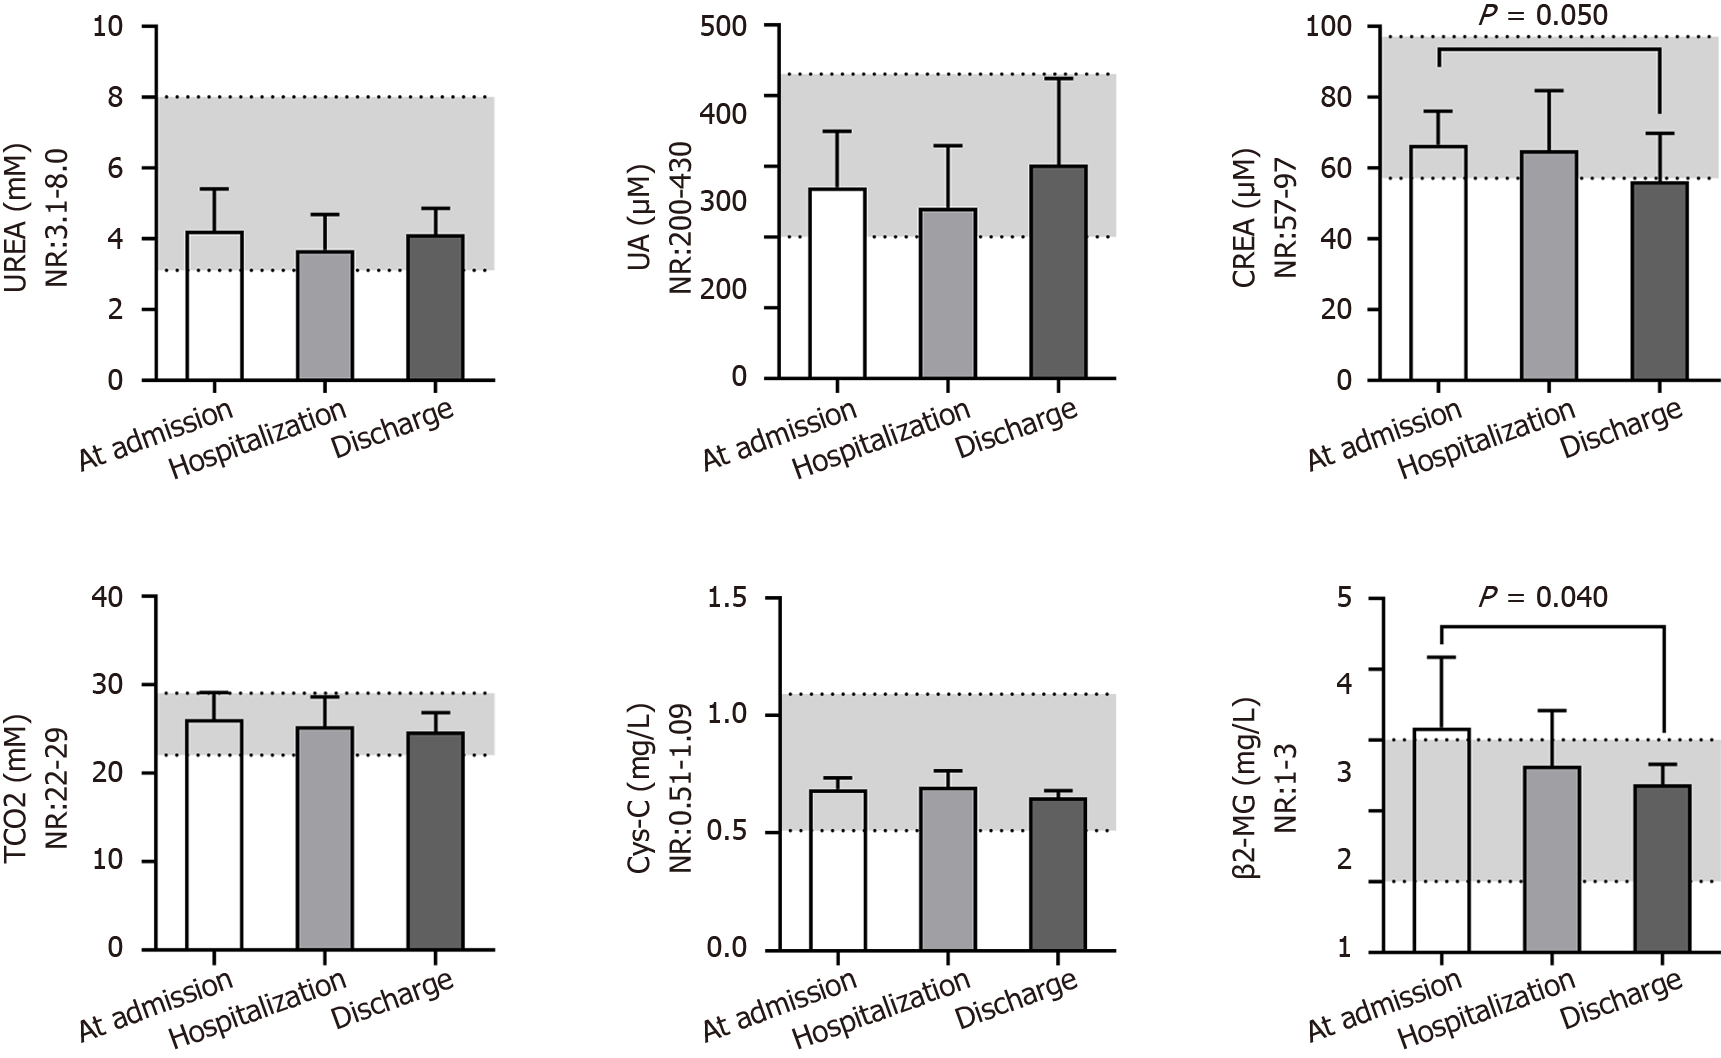
Figure 6 Dynamic changes in renal function indices for patients with coronavirus disease 2019 at admission, upon hospitalization and before discharge.
UA: Uric acid; CREA: Creatinine; TCO2: Total CO2; Cys-c: Cystatin C; β2-MG: β2-microglobulin; NR: Normal range.
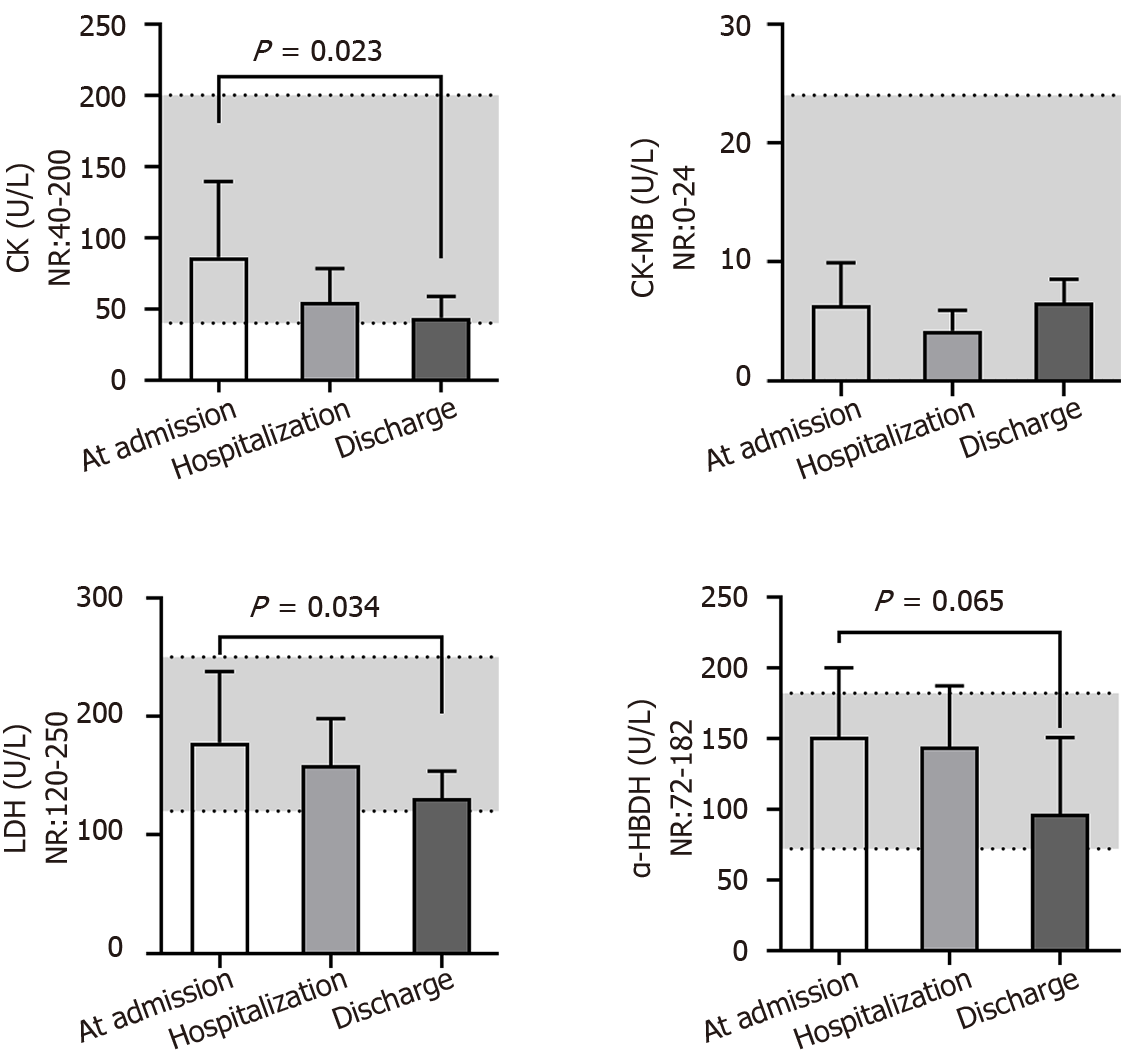
Figure 7 Dynamic changes in myocardial enzyme activities for patients with coronavirus disease 2019 at admission, upon hospitalization and before discharge.
CK: Creatine kinase; CK-MB: Creatine phosphokinase isoenzyme; LDH: Lactic dehydrogenase; α-HBDH: α-hydroxybutyric dehydrogenase; NR: Normal range.
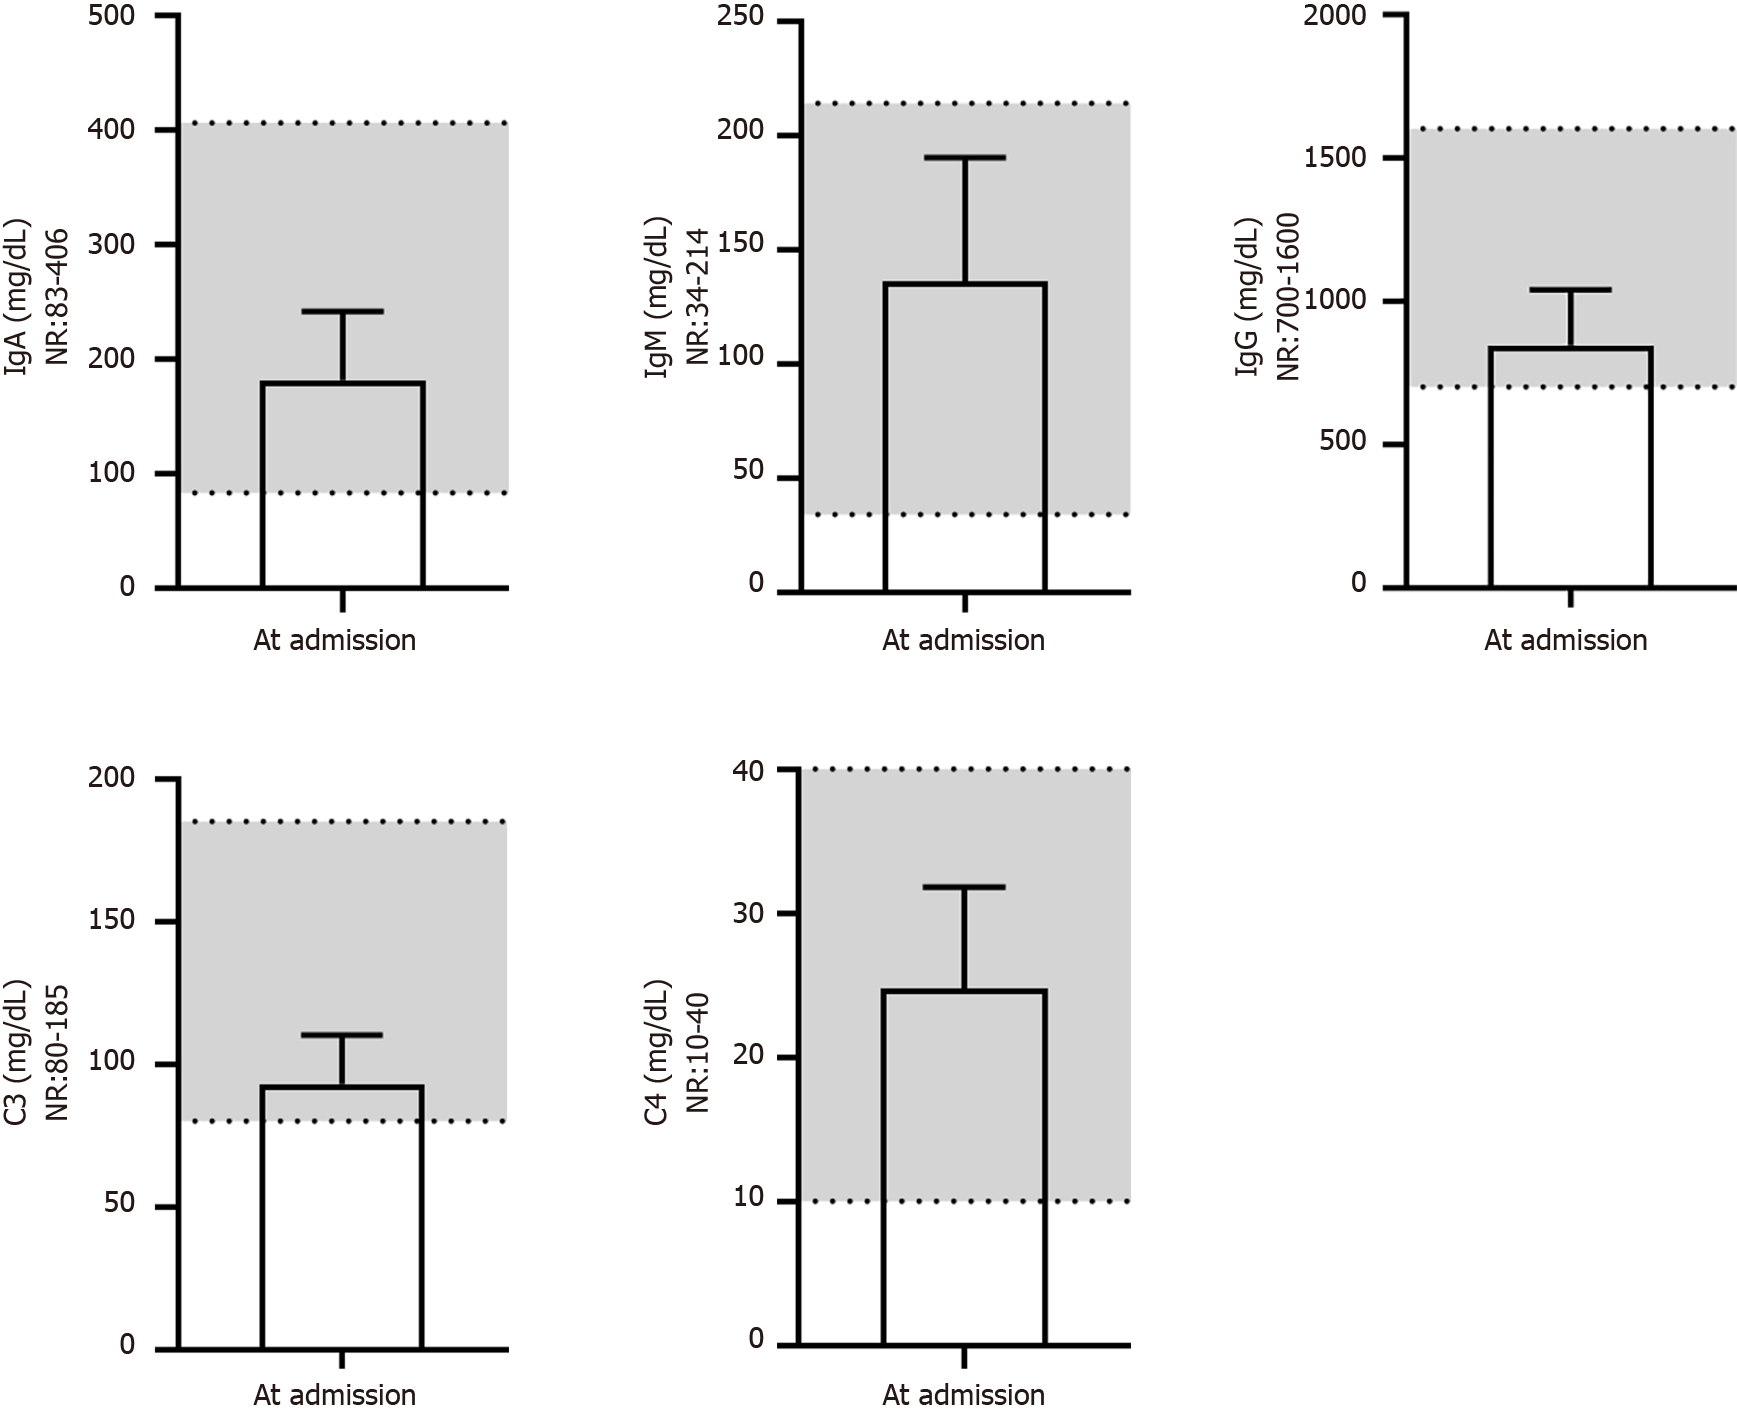
Figure 8 Levels of five blood biochemical markers of immunity for patients with coronavirus disease 2019 at admission.
Ig: Immunoglobulin; NR: Normal range.
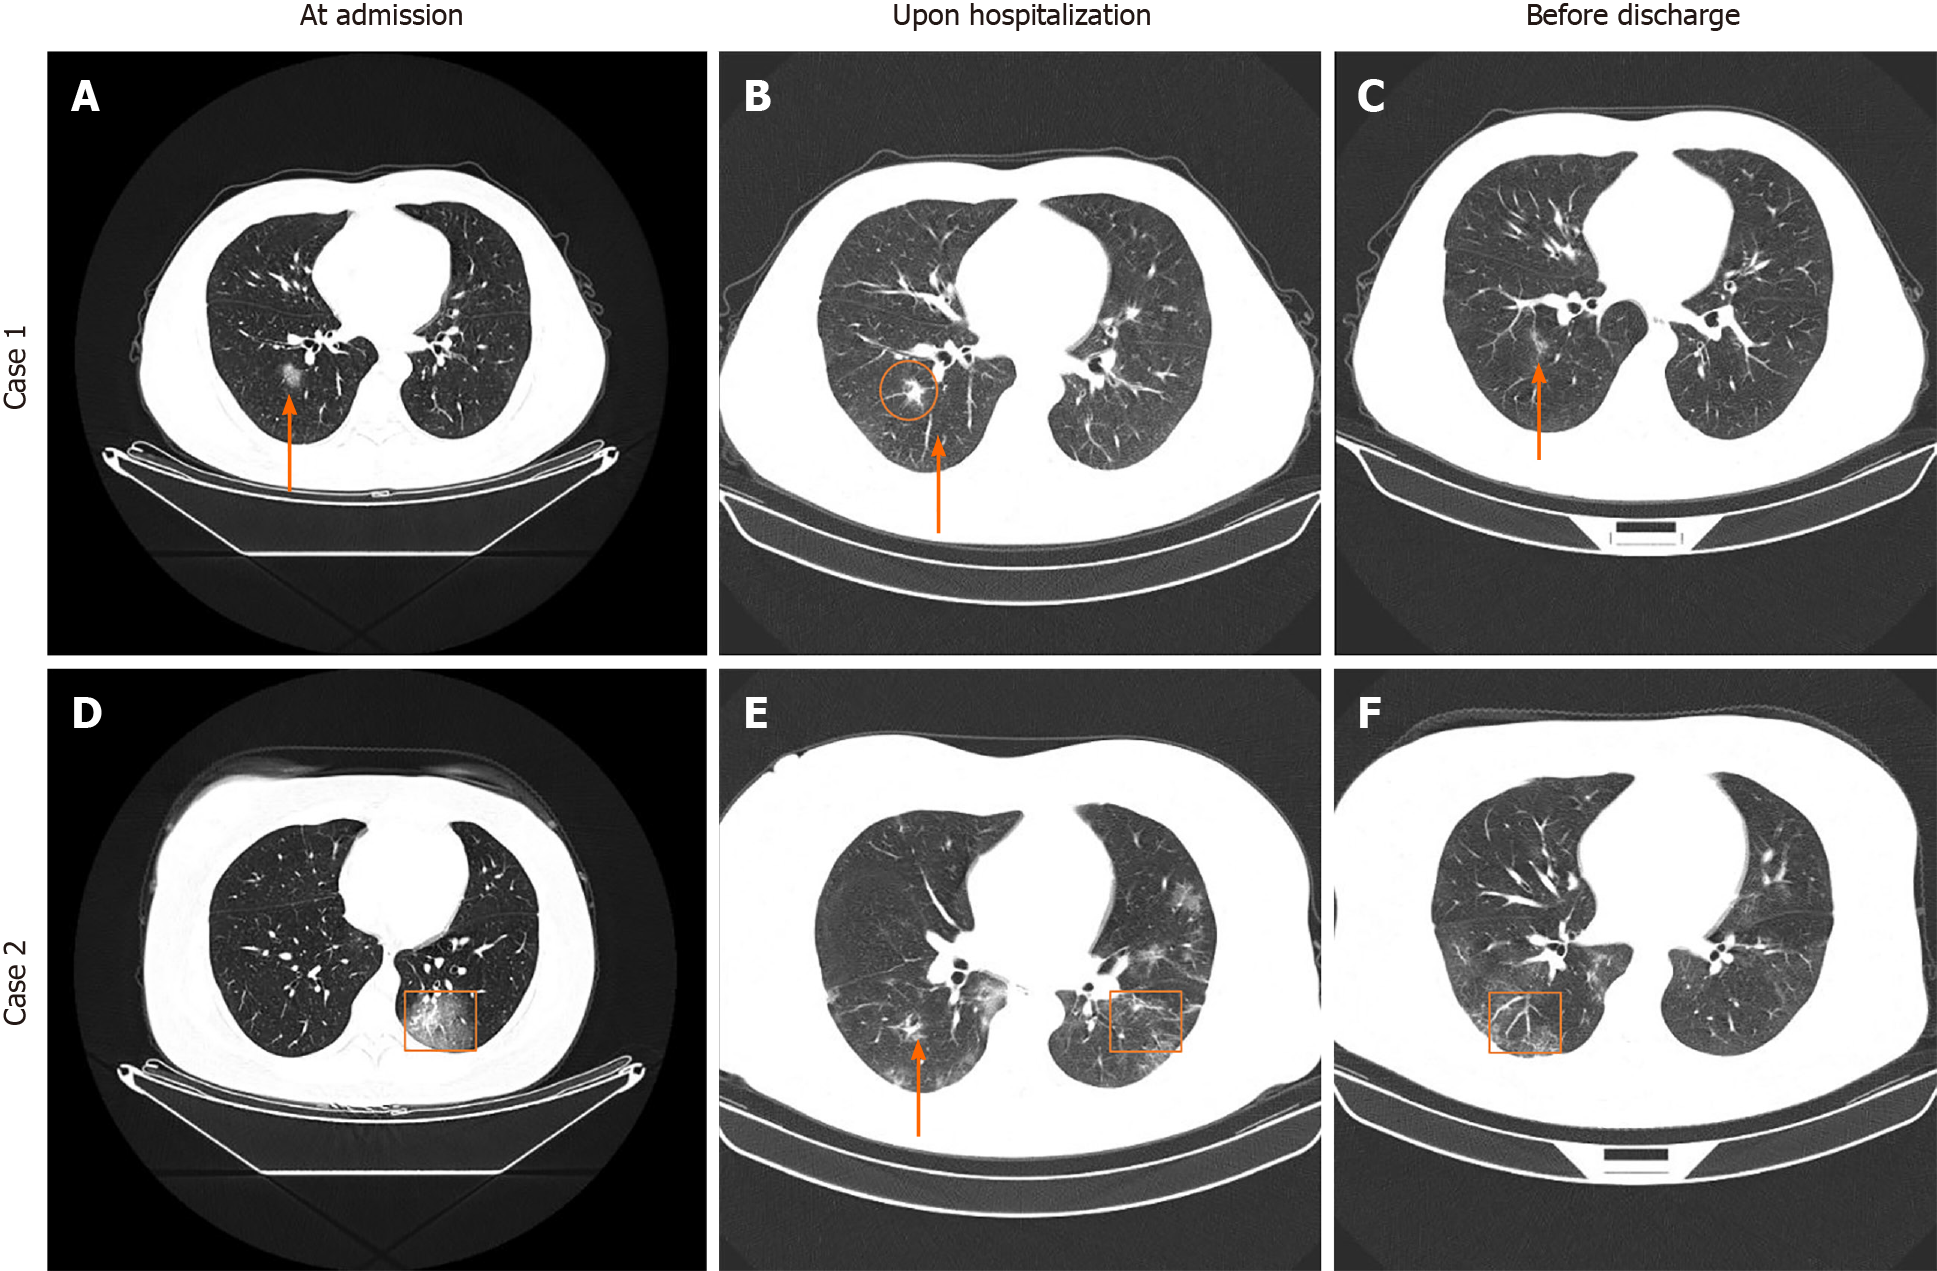
Figure 9 Representative computed tomography images of two patients with coronavirus disease 2019 at admission, upon hospitalization and before discharge.
A: Punctate ground-glass opacity (GGO) was observed in the inferior lobe of the right lung; B: Partial absorption was observed for the GGO lesion in the inferior lobe of the right lung; C: A striped high-density shade was only observed in the inferior lobe of the right lung after further absorption; D: Patchy GGO was observed in the inferior lobe of the left lung; E: Multiple patchy GGOs were observed in both lungs, and the number of lesions was increased; F: Remarkable absorption of patchy GGOs was observed in both lungs. The red boxes and arrows indicate abnormalities.
- Citation: Nie XB, Shi BS, Zhang L, Niu WL, Xue T, Li LQ, Wei XY, Wang YD, Chen WD, Hou RF. Epidemiological features and dynamic changes in blood biochemical indices for COVID-19 patients in Hebi. World J Clin Cases 2022; 10(8): 2404-2419
- URL: https://www.wjgnet.com/2307-8960/full/v10/i8/2404.htm
- DOI: https://dx.doi.org/10.12998/wjcc.v10.i8.2404


