Copyright
©The Author(s) 2022.
World J Clin Cases. Mar 6, 2022; 10(7): 2194-2205
Published online Mar 6, 2022. doi: 10.12998/wjcc.v10.i7.2194
Published online Mar 6, 2022. doi: 10.12998/wjcc.v10.i7.2194
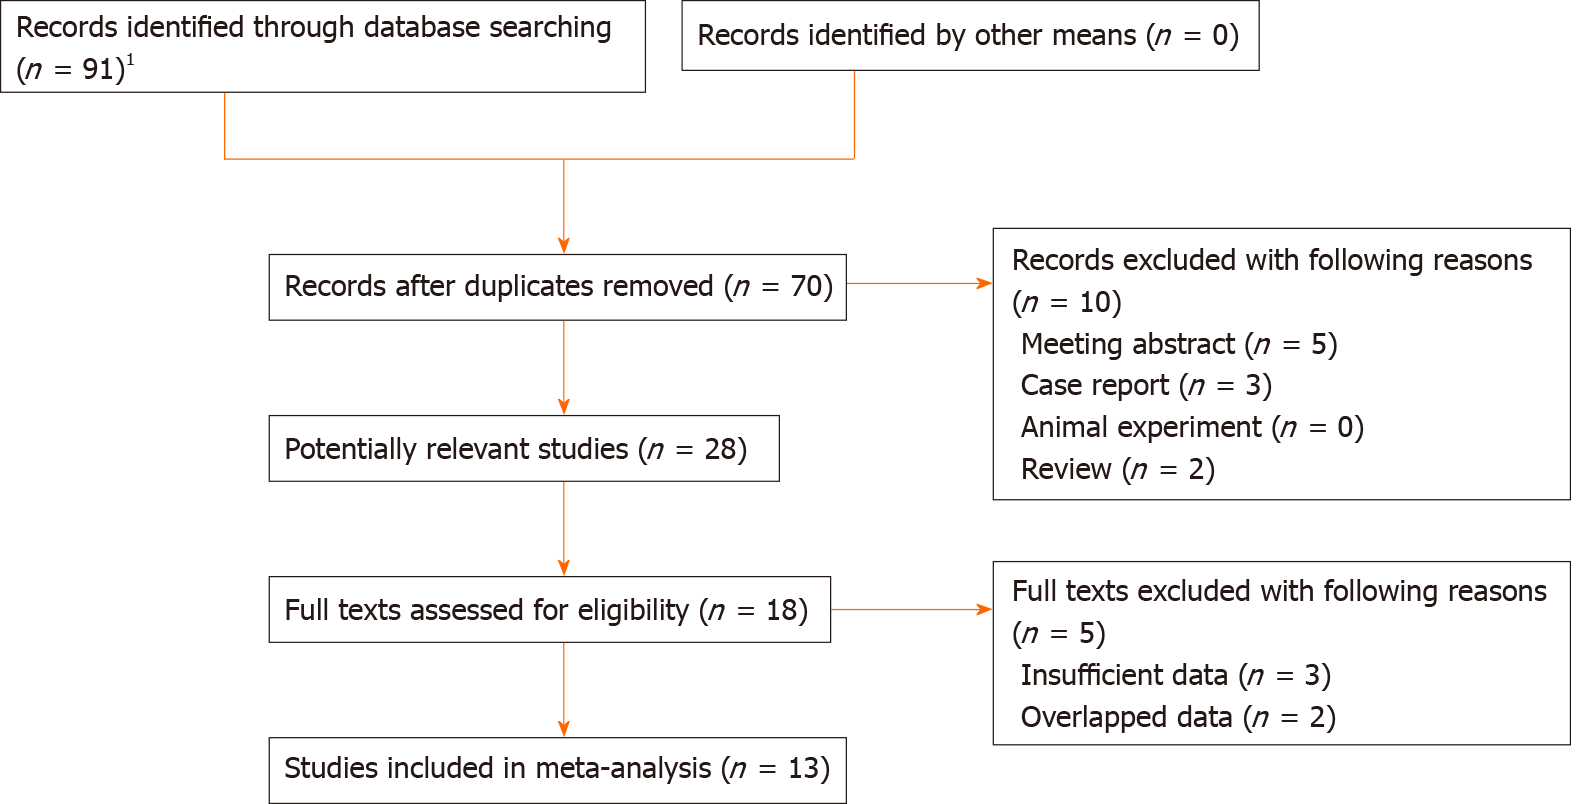
Figure 1 The flow diagram of this meta-analysis.
1PubMed (n = 22), EMBASE (n = 26), Web of Science (n = 30), CNKI (n = 13).
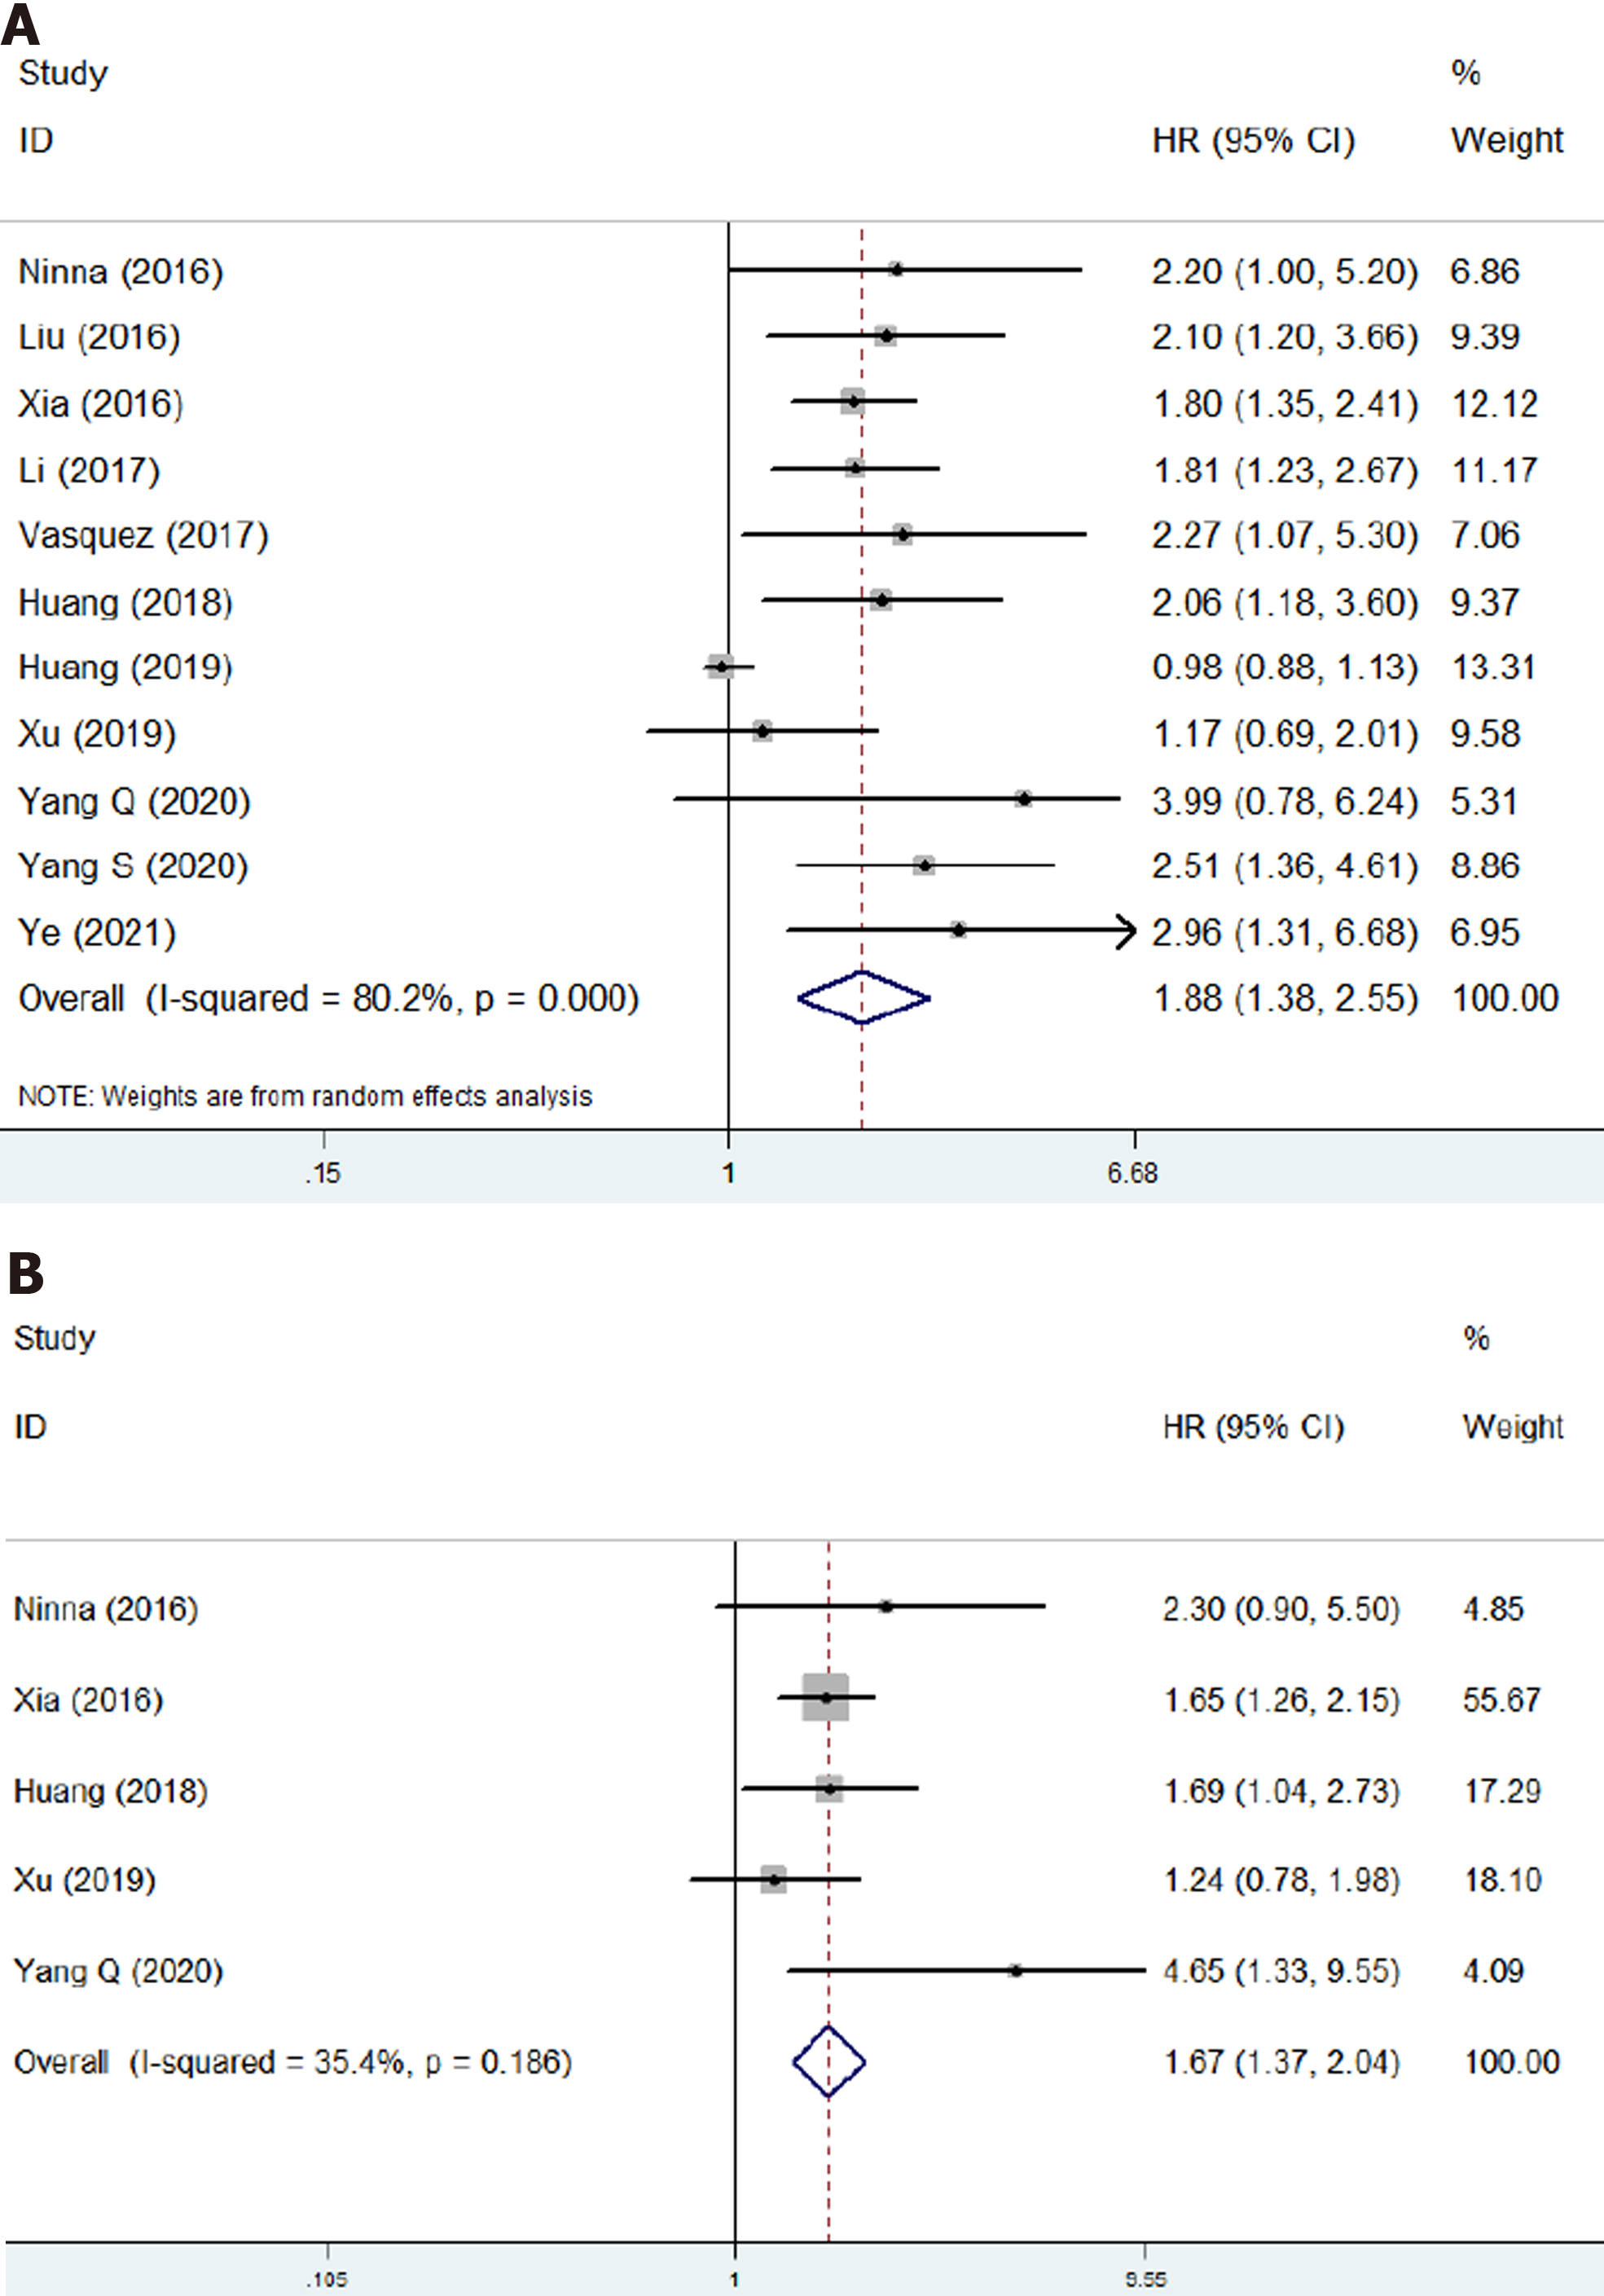
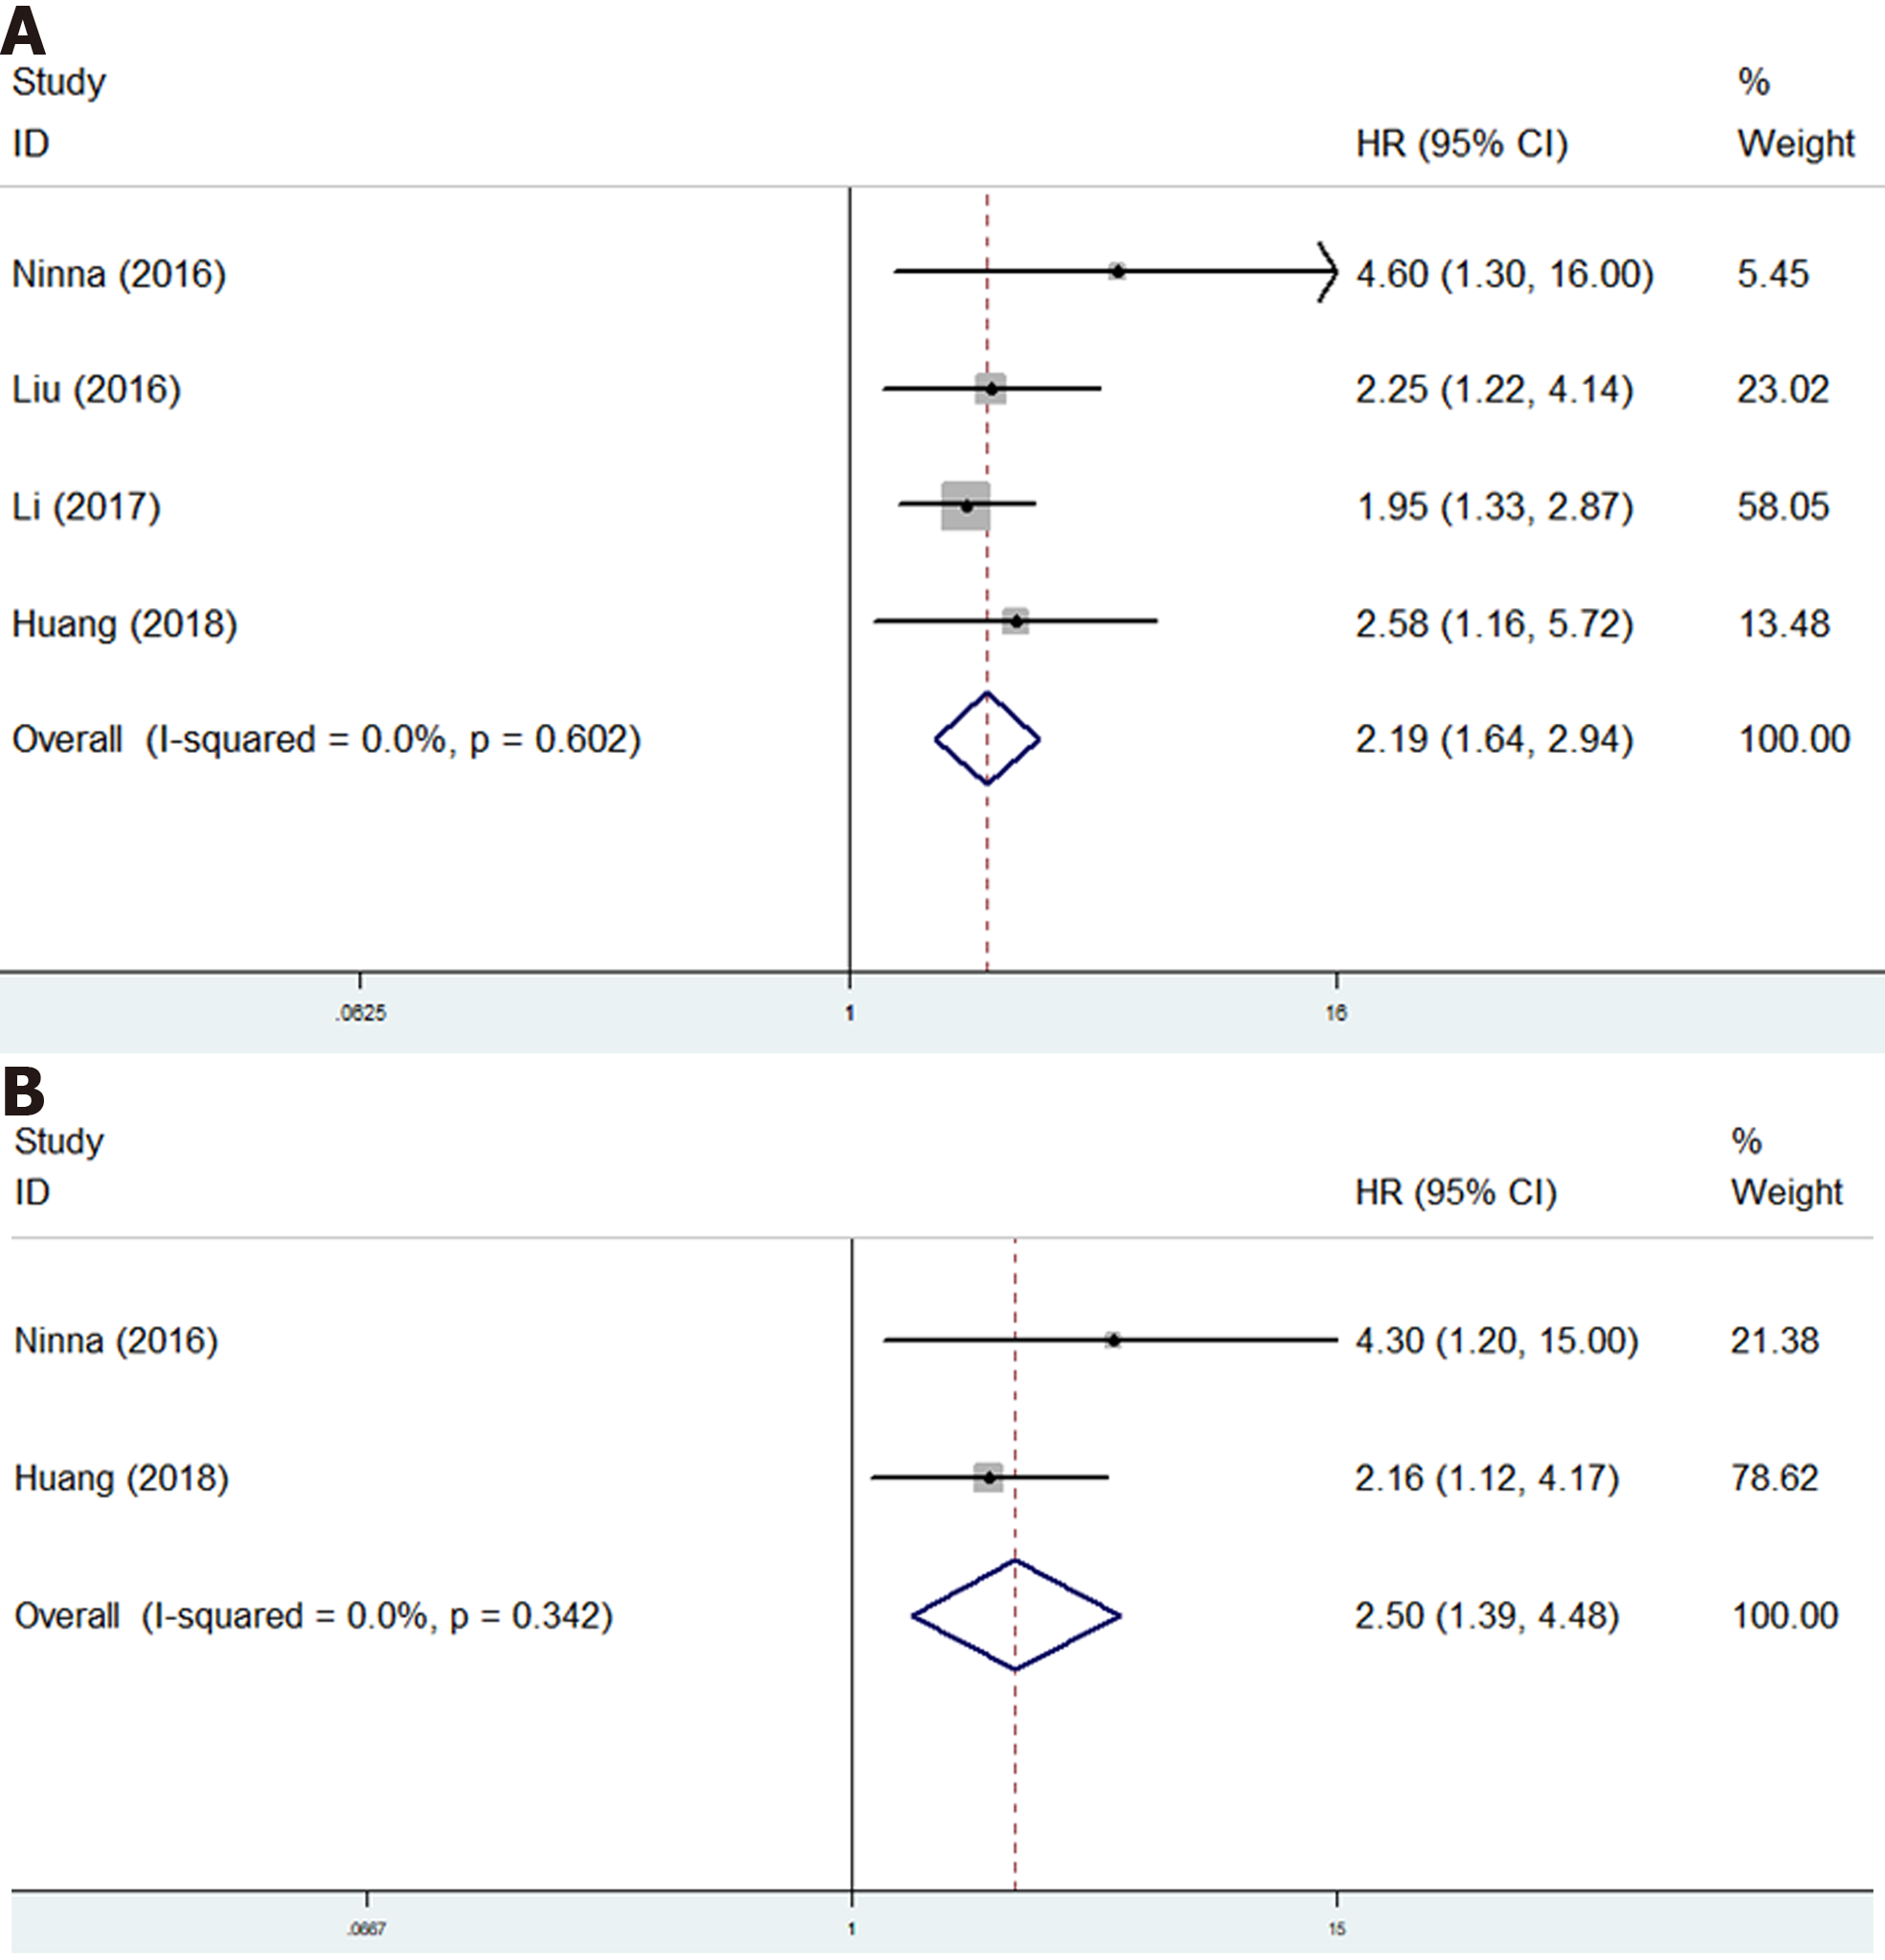
Figure 2 The association of neutrophil to lymphocyte ratio with prognosis of osteosarcoma patients.
A: The association of neutrophil to lymphocyte ratio with overall survival of osteosarcoma patients; B: The association of neutrophil to lymphocyte ratio with disease-free survival of osteosarcoma patients. CI: Confidence interval; HR: Hazard ratio.
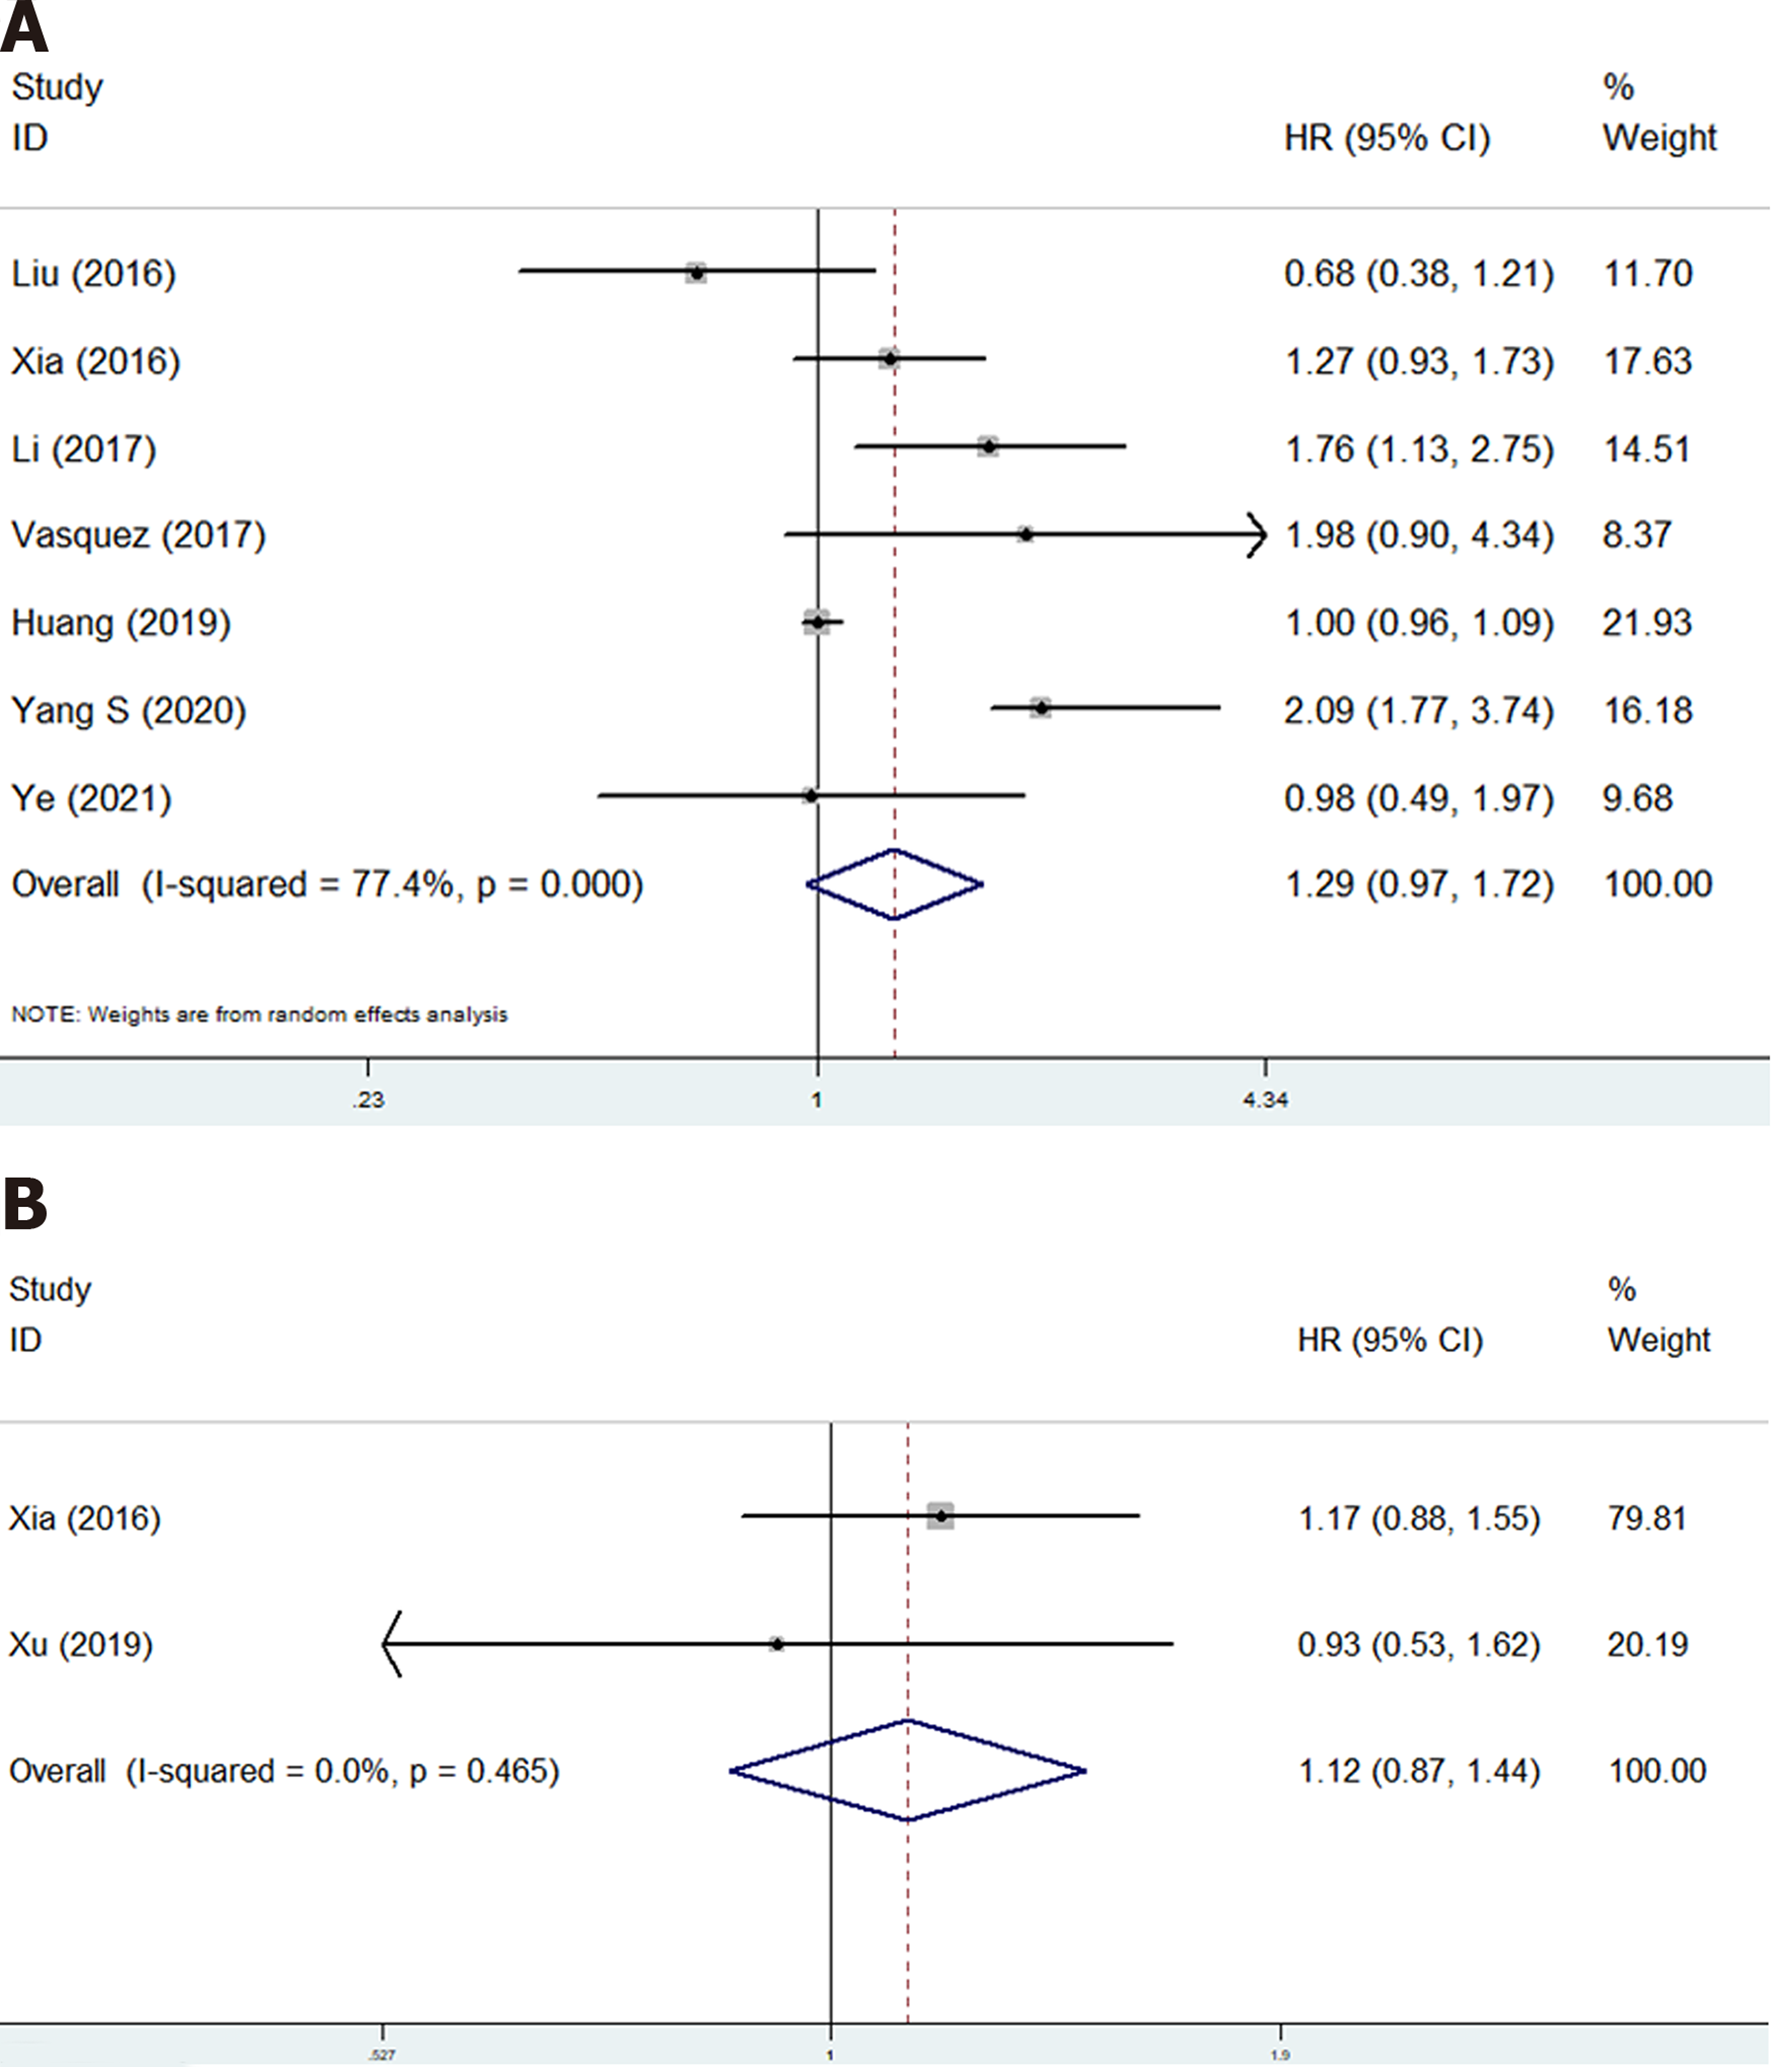
Figure 3 The association of platelet to lymphocyte ratio with prognosis of osteosarcoma patients.
A: Overall survival; B: Disease-free survival. CI: Confidence interval; HR: Hazard ratio.
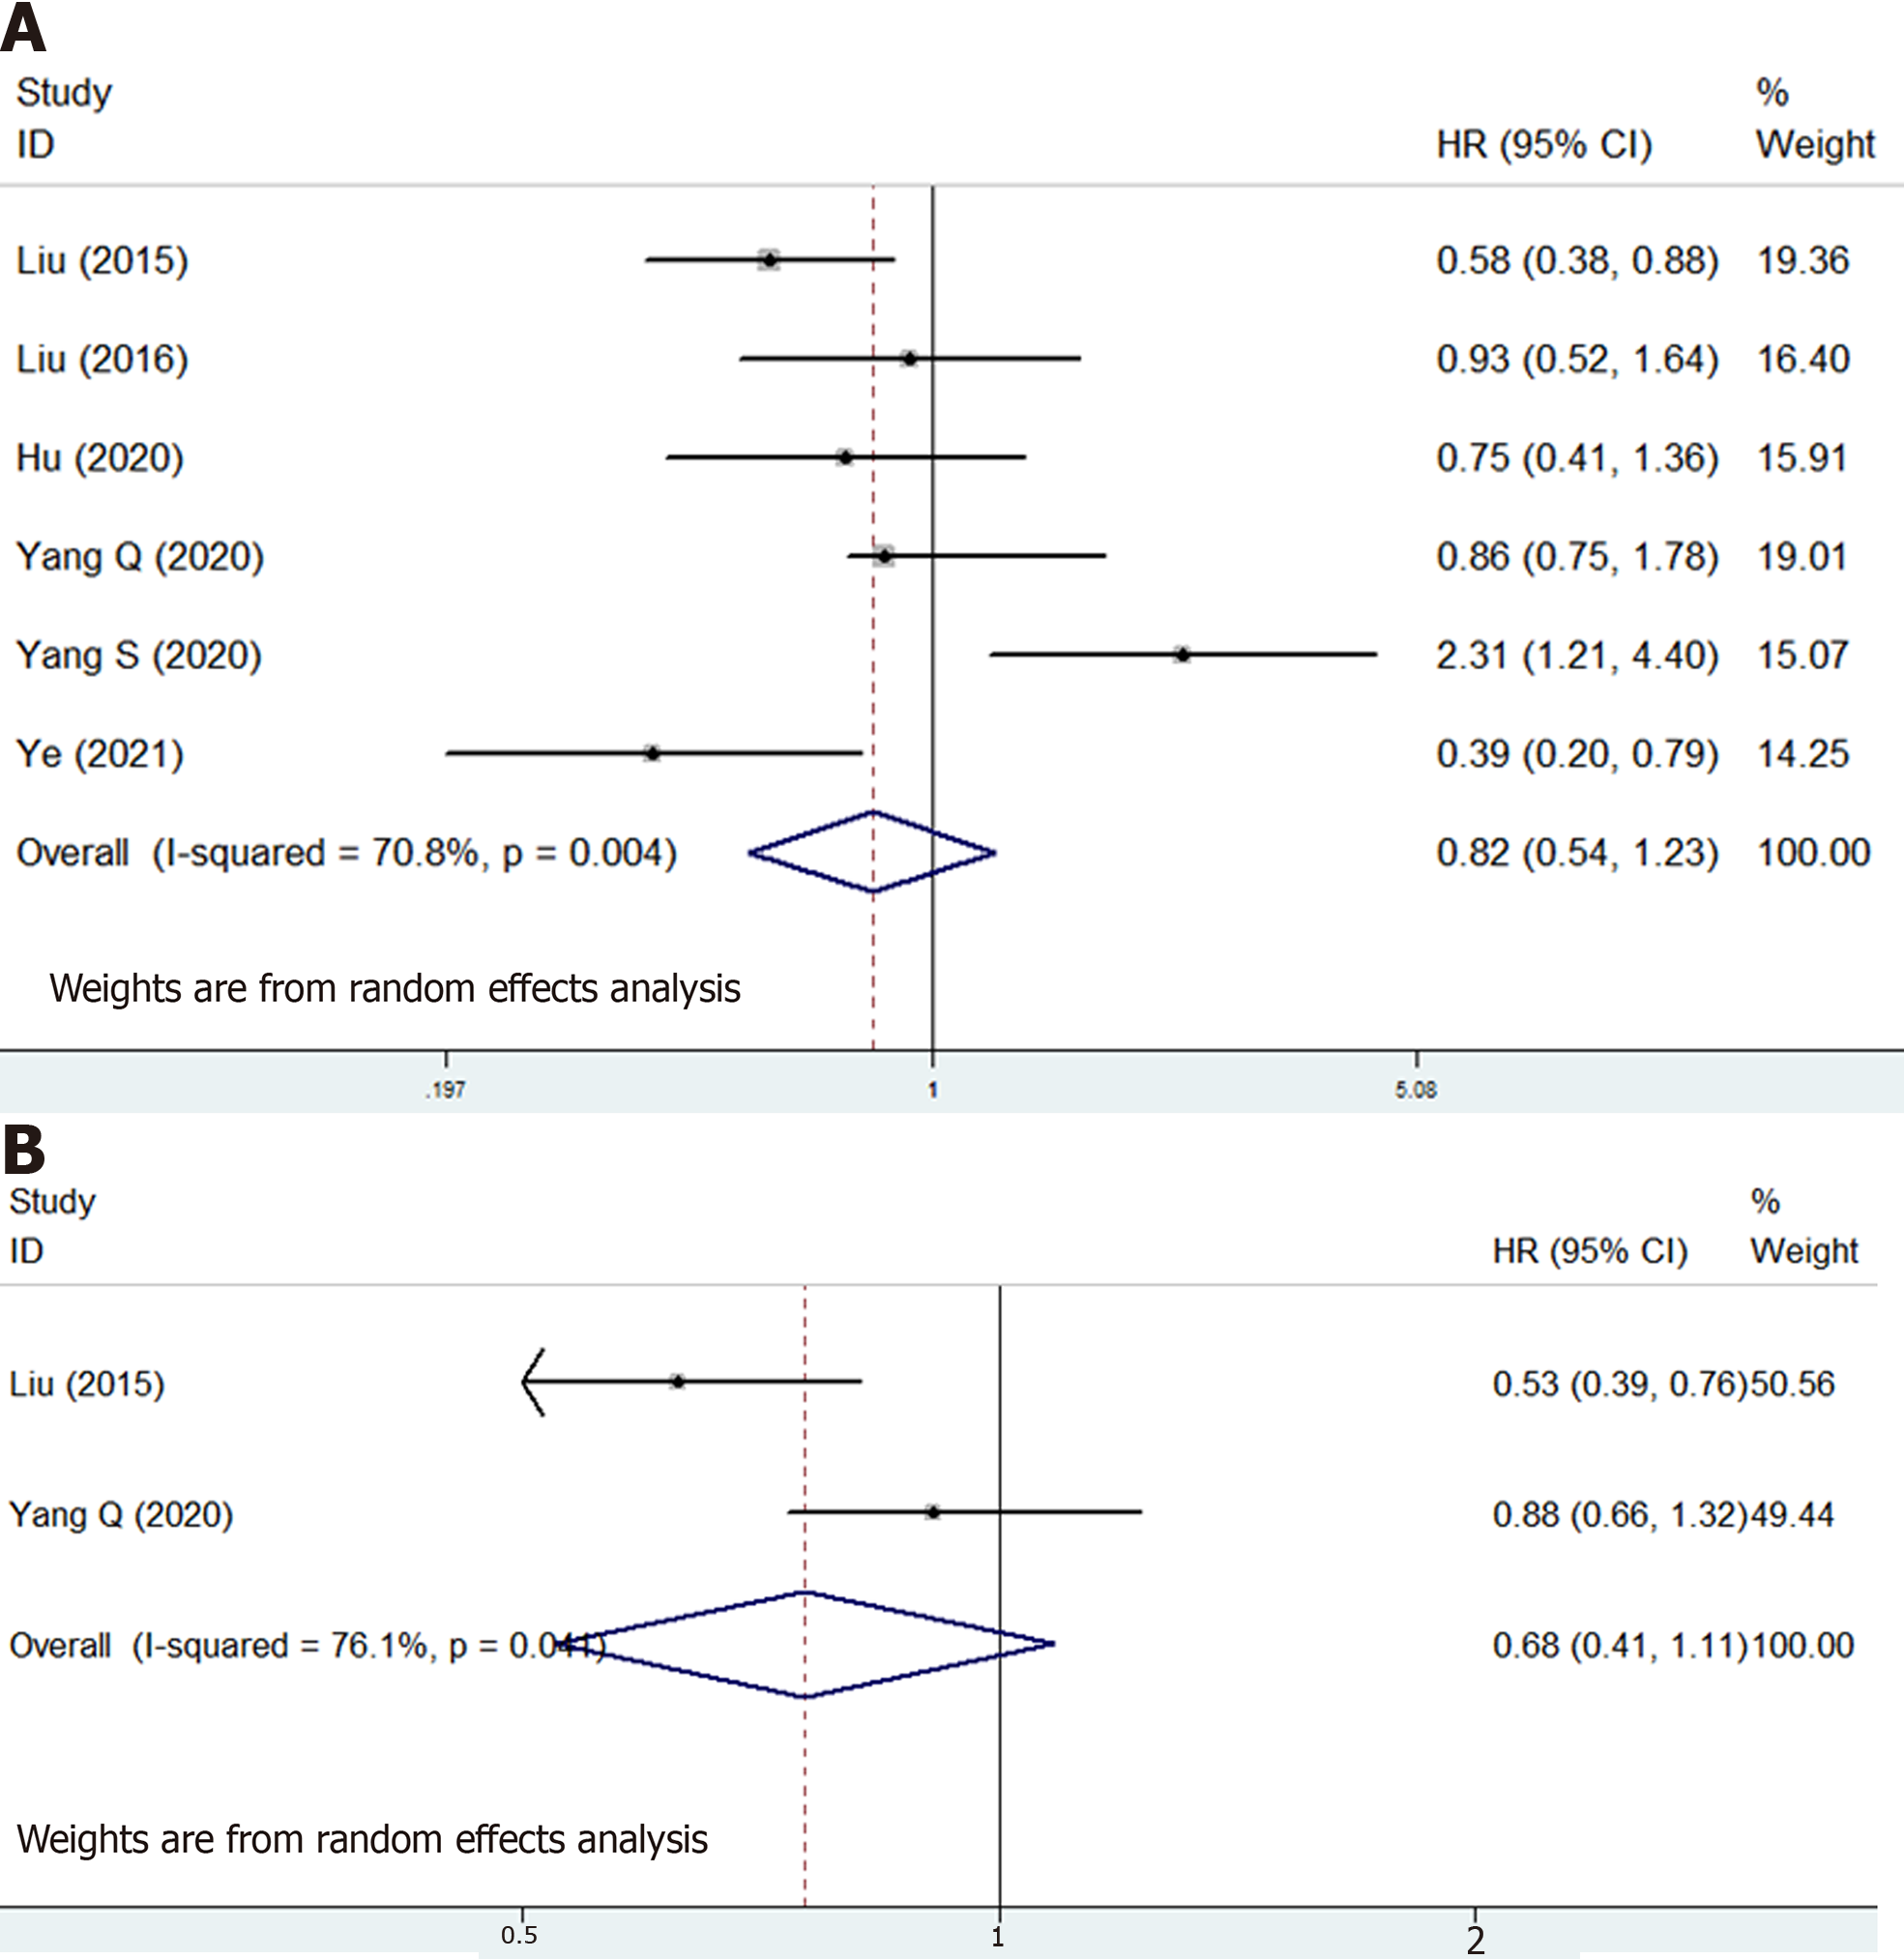
Figure 4 The association of lymphocyte to monocyte ratio with prognosis of osteosarcoma patients.
A: The association of lymphocyte to monocyte ratio with overall survival of osteosarcoma patients; B: The association of lymphocyte to monocyte ratio with disease-free survival of osteosarcoma patients. CI: Confidence interval; HR: Hazard ratio.
Figure 5 The association of Glasgow prognostic score with prognosis of osteosarcoma patients.
A: The association of Glasgow prognostic score with overall survival of osteosarcoma patients; B: The association of Glasgow prognostic score with disease-free survival of osteosarcoma patients. CI: Confidence interval; HR: Hazard ratio.
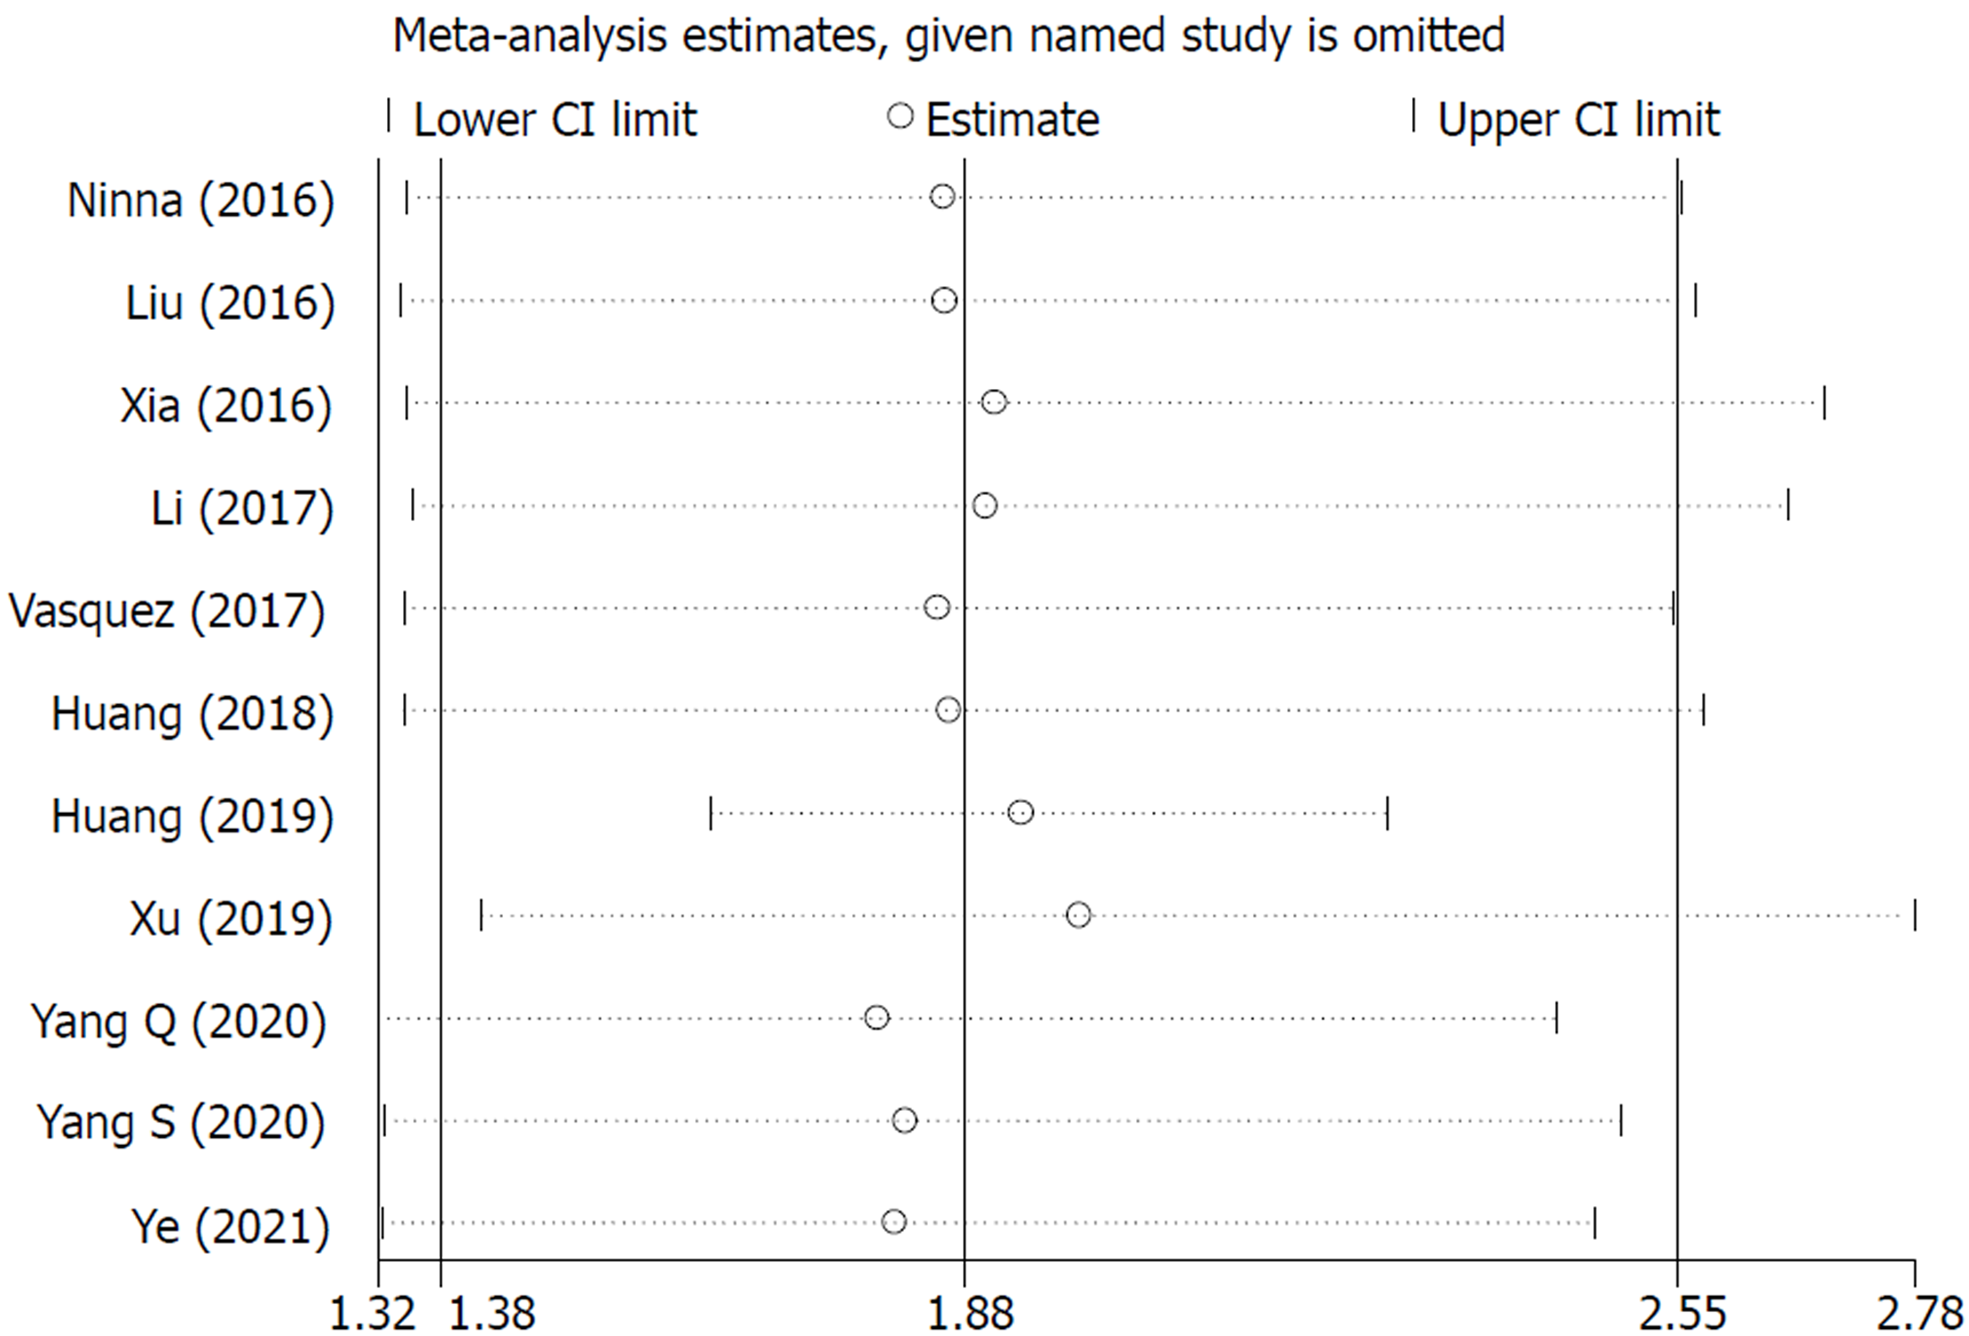
Figure 6 Sensitivity analysis about the association of neutrophil to lymphocyte ratio with overall survival of osteosarcoma patients.
CI: Confidence interval.
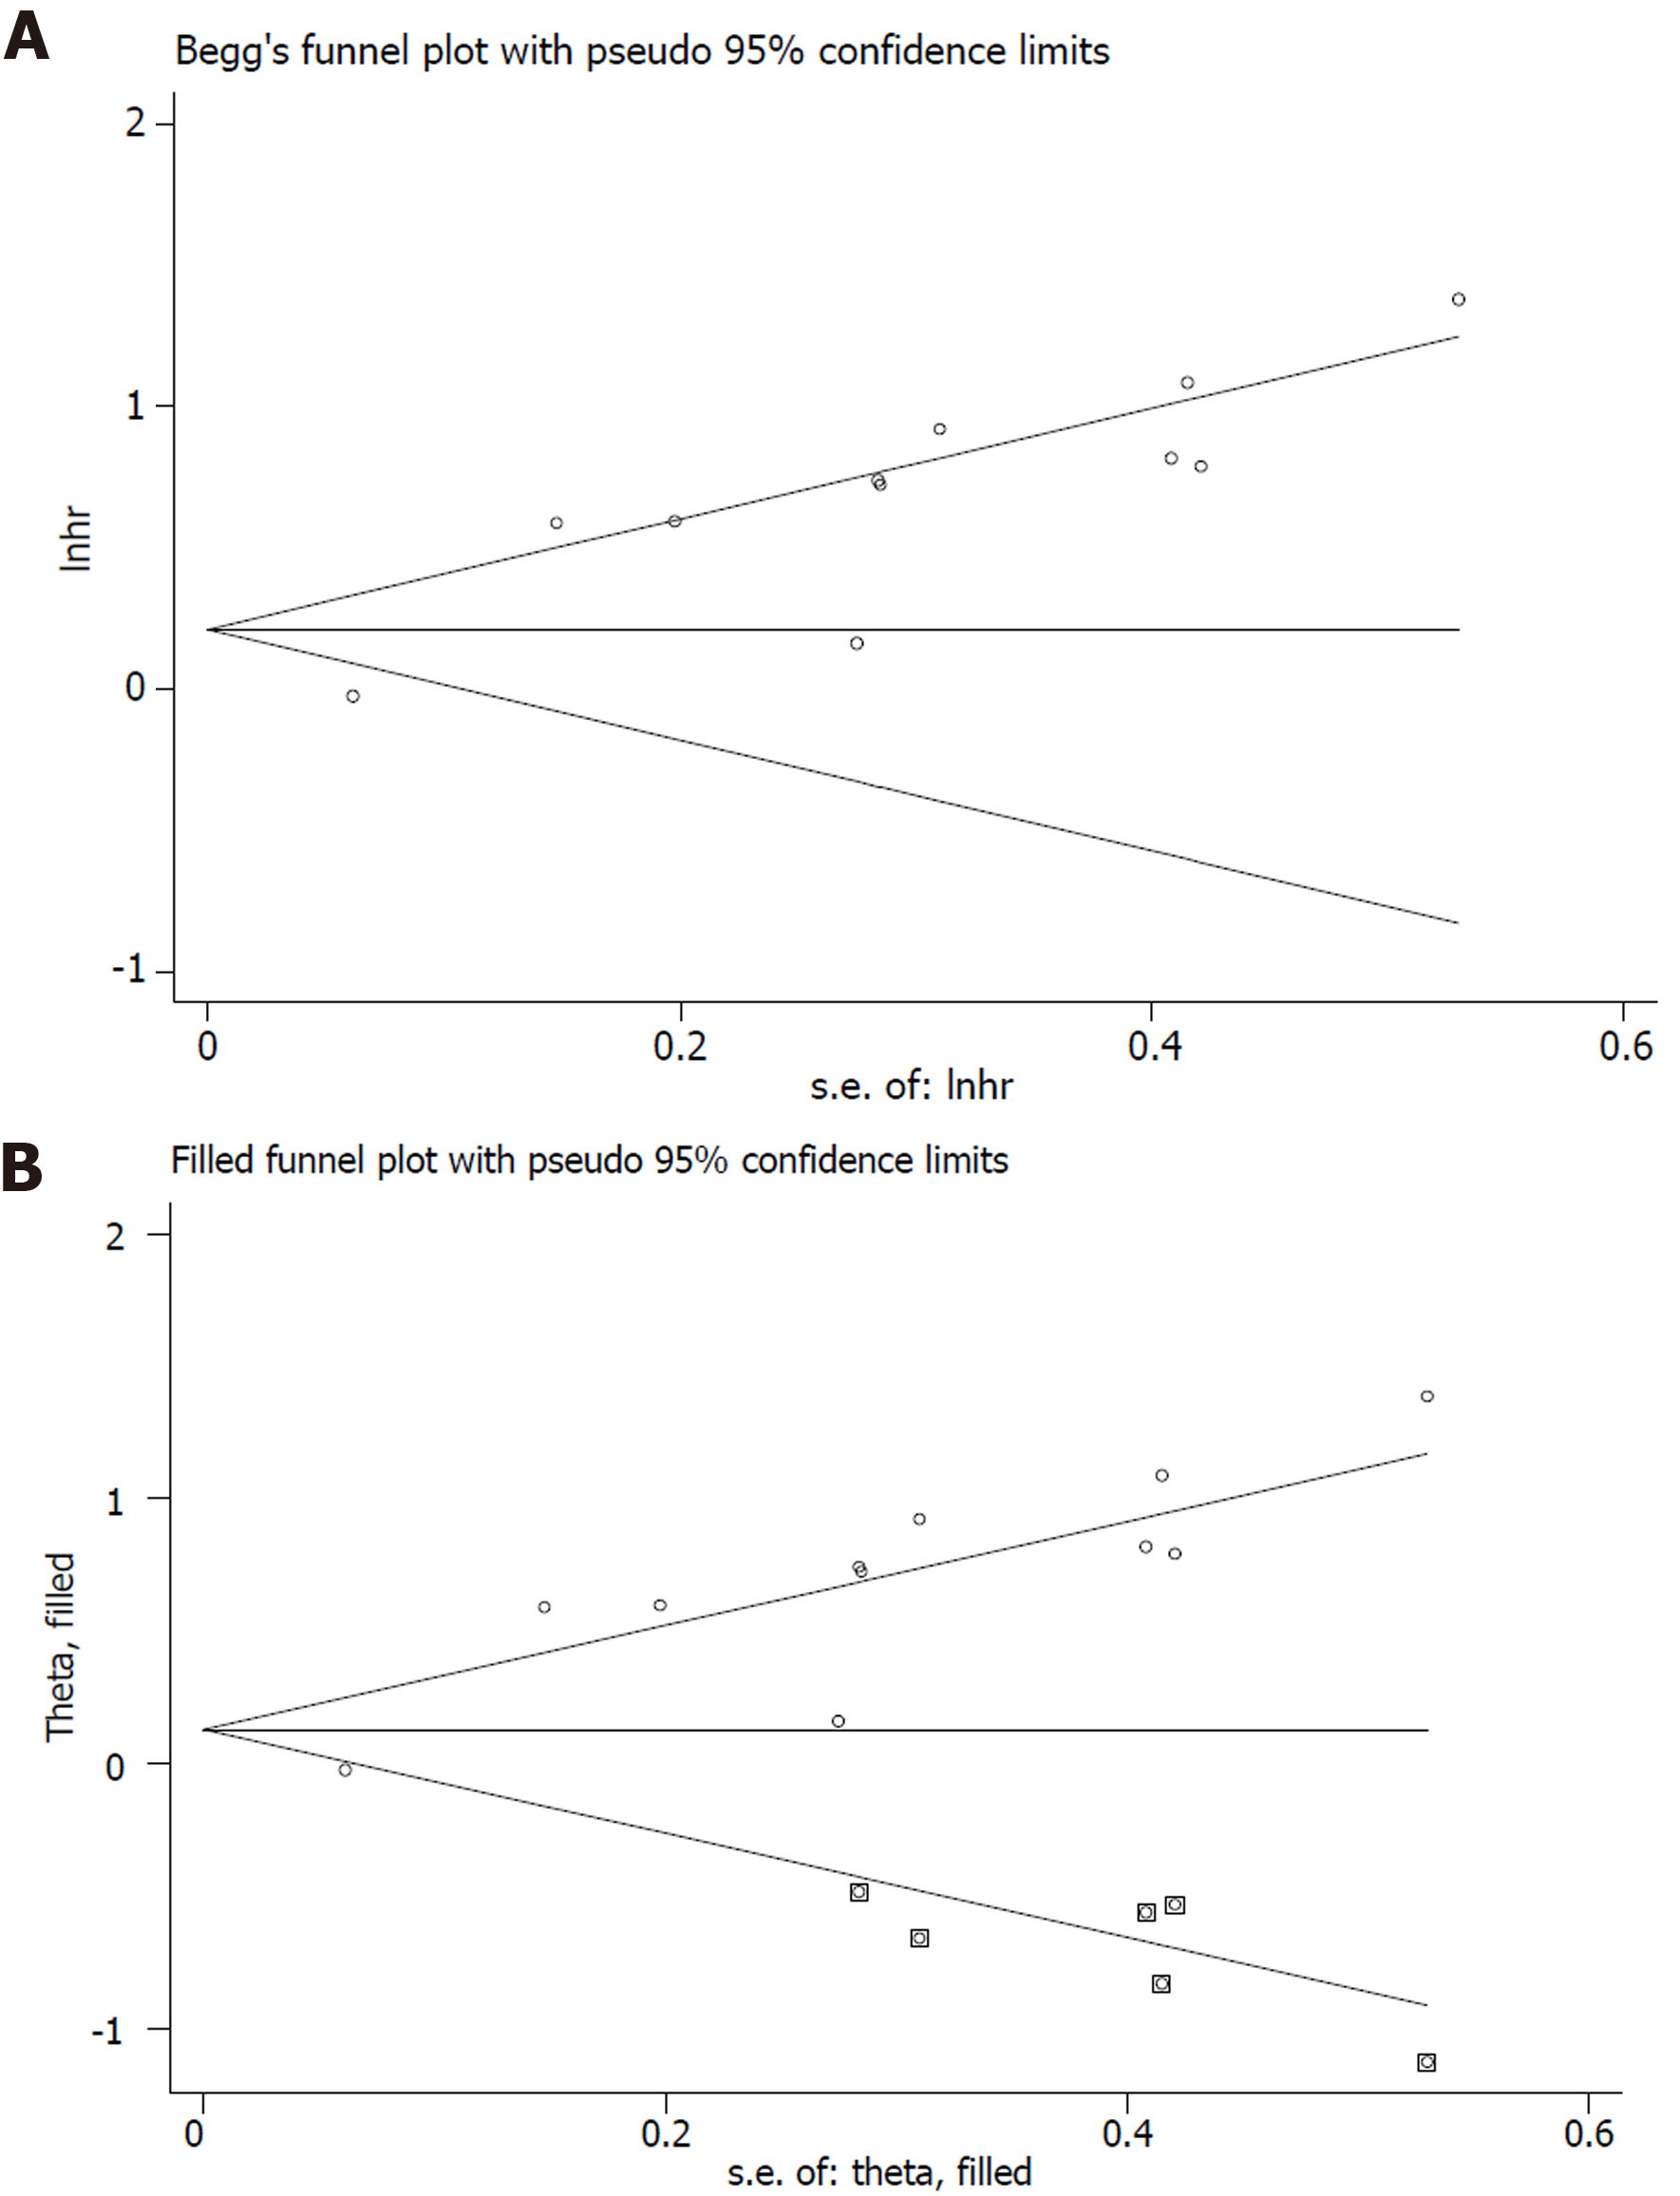
Figure 7 Begg’s analysis.
A: Begg’s funnel plot; B: Trimed Begg’s funnel plot.
- Citation: Peng LP, Li J, Li XF. Prognostic value of neutrophil/lymphocyte, platelet/lymphocyte, lymphocyte/monocyte ratios and Glasgow prognostic score in osteosarcoma: A meta-analysis. World J Clin Cases 2022; 10(7): 2194-2205
- URL: https://www.wjgnet.com/2307-8960/full/v10/i7/2194.htm
- DOI: https://dx.doi.org/10.12998/wjcc.v10.i7.2194


