Copyright
©The Author(s) 2022.
World J Clin Cases. Oct 26, 2022; 10(30): 10906-10920
Published online Oct 26, 2022. doi: 10.12998/wjcc.v10.i30.10906
Published online Oct 26, 2022. doi: 10.12998/wjcc.v10.i30.10906
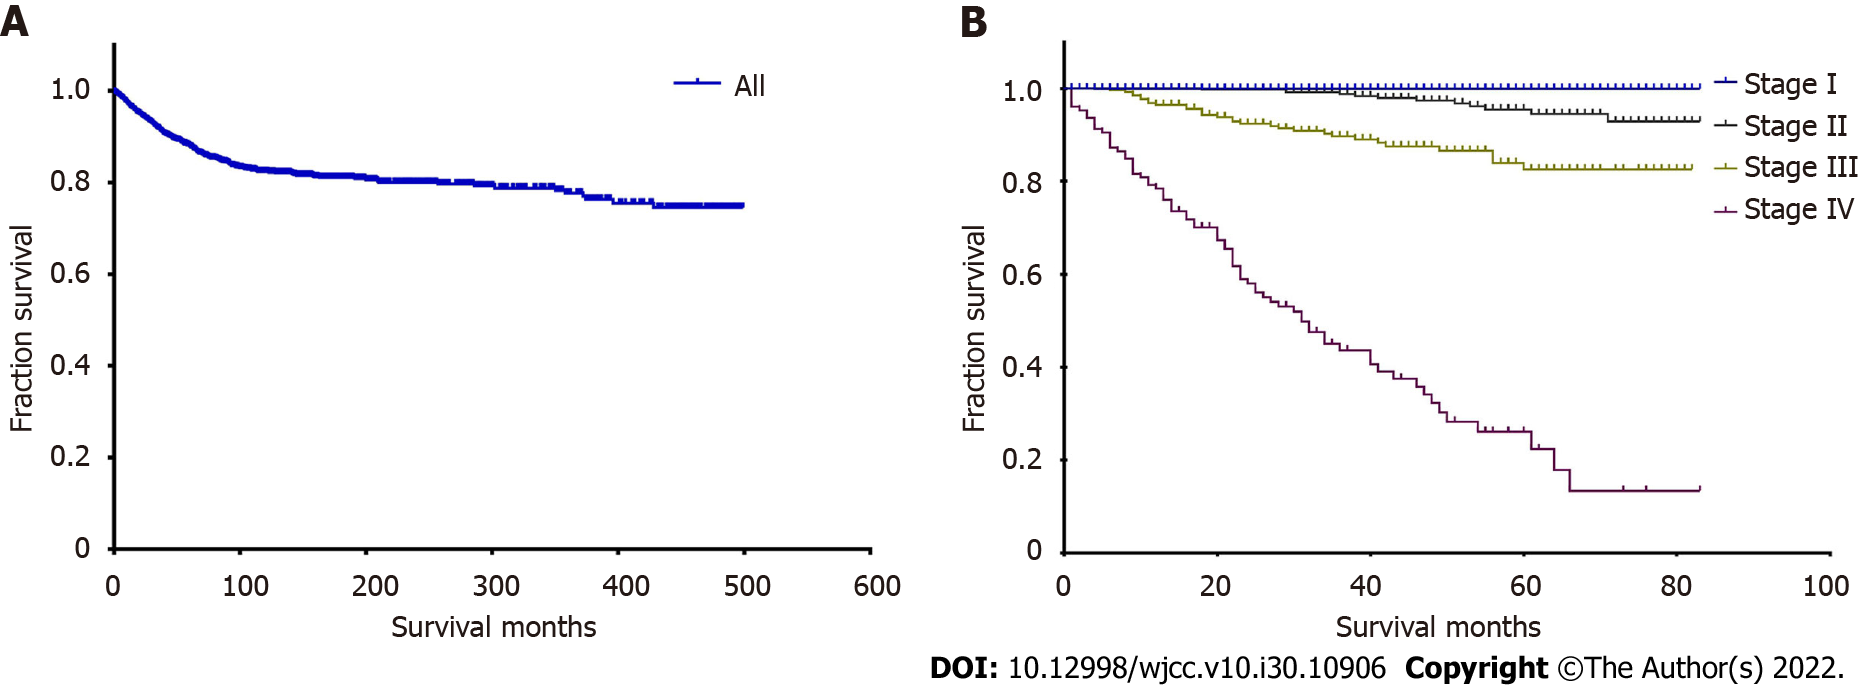
Figure 1 Survival curves for all patients and patients at different disease stages.
A: Survival for all patients; B: Survival for patients at different stages.
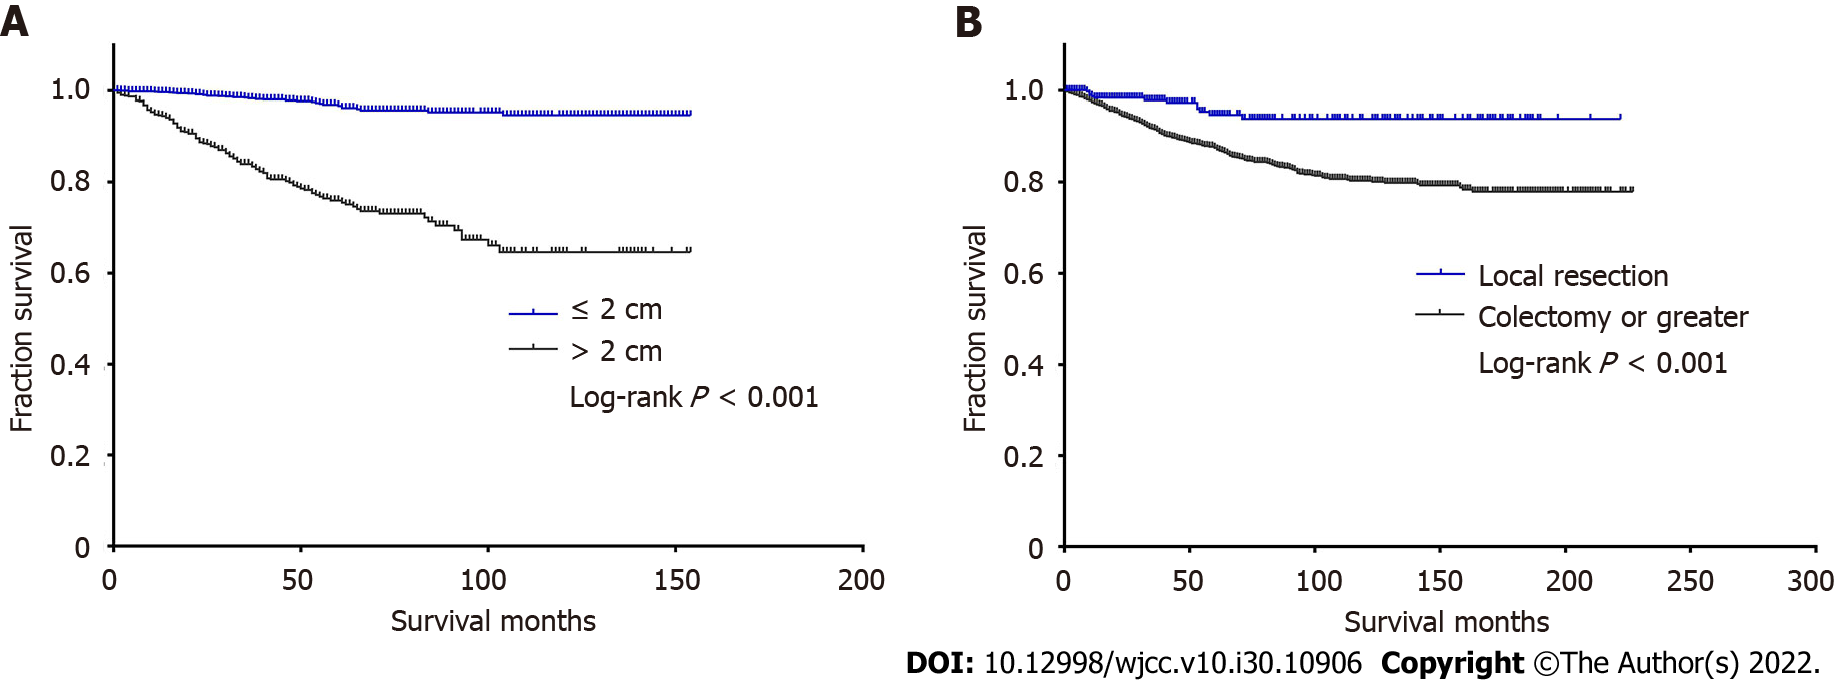
Figure 2 Survival curves by tumor size and surgery type.
A: Survival by tumor size; B: Survival by different surgeries.
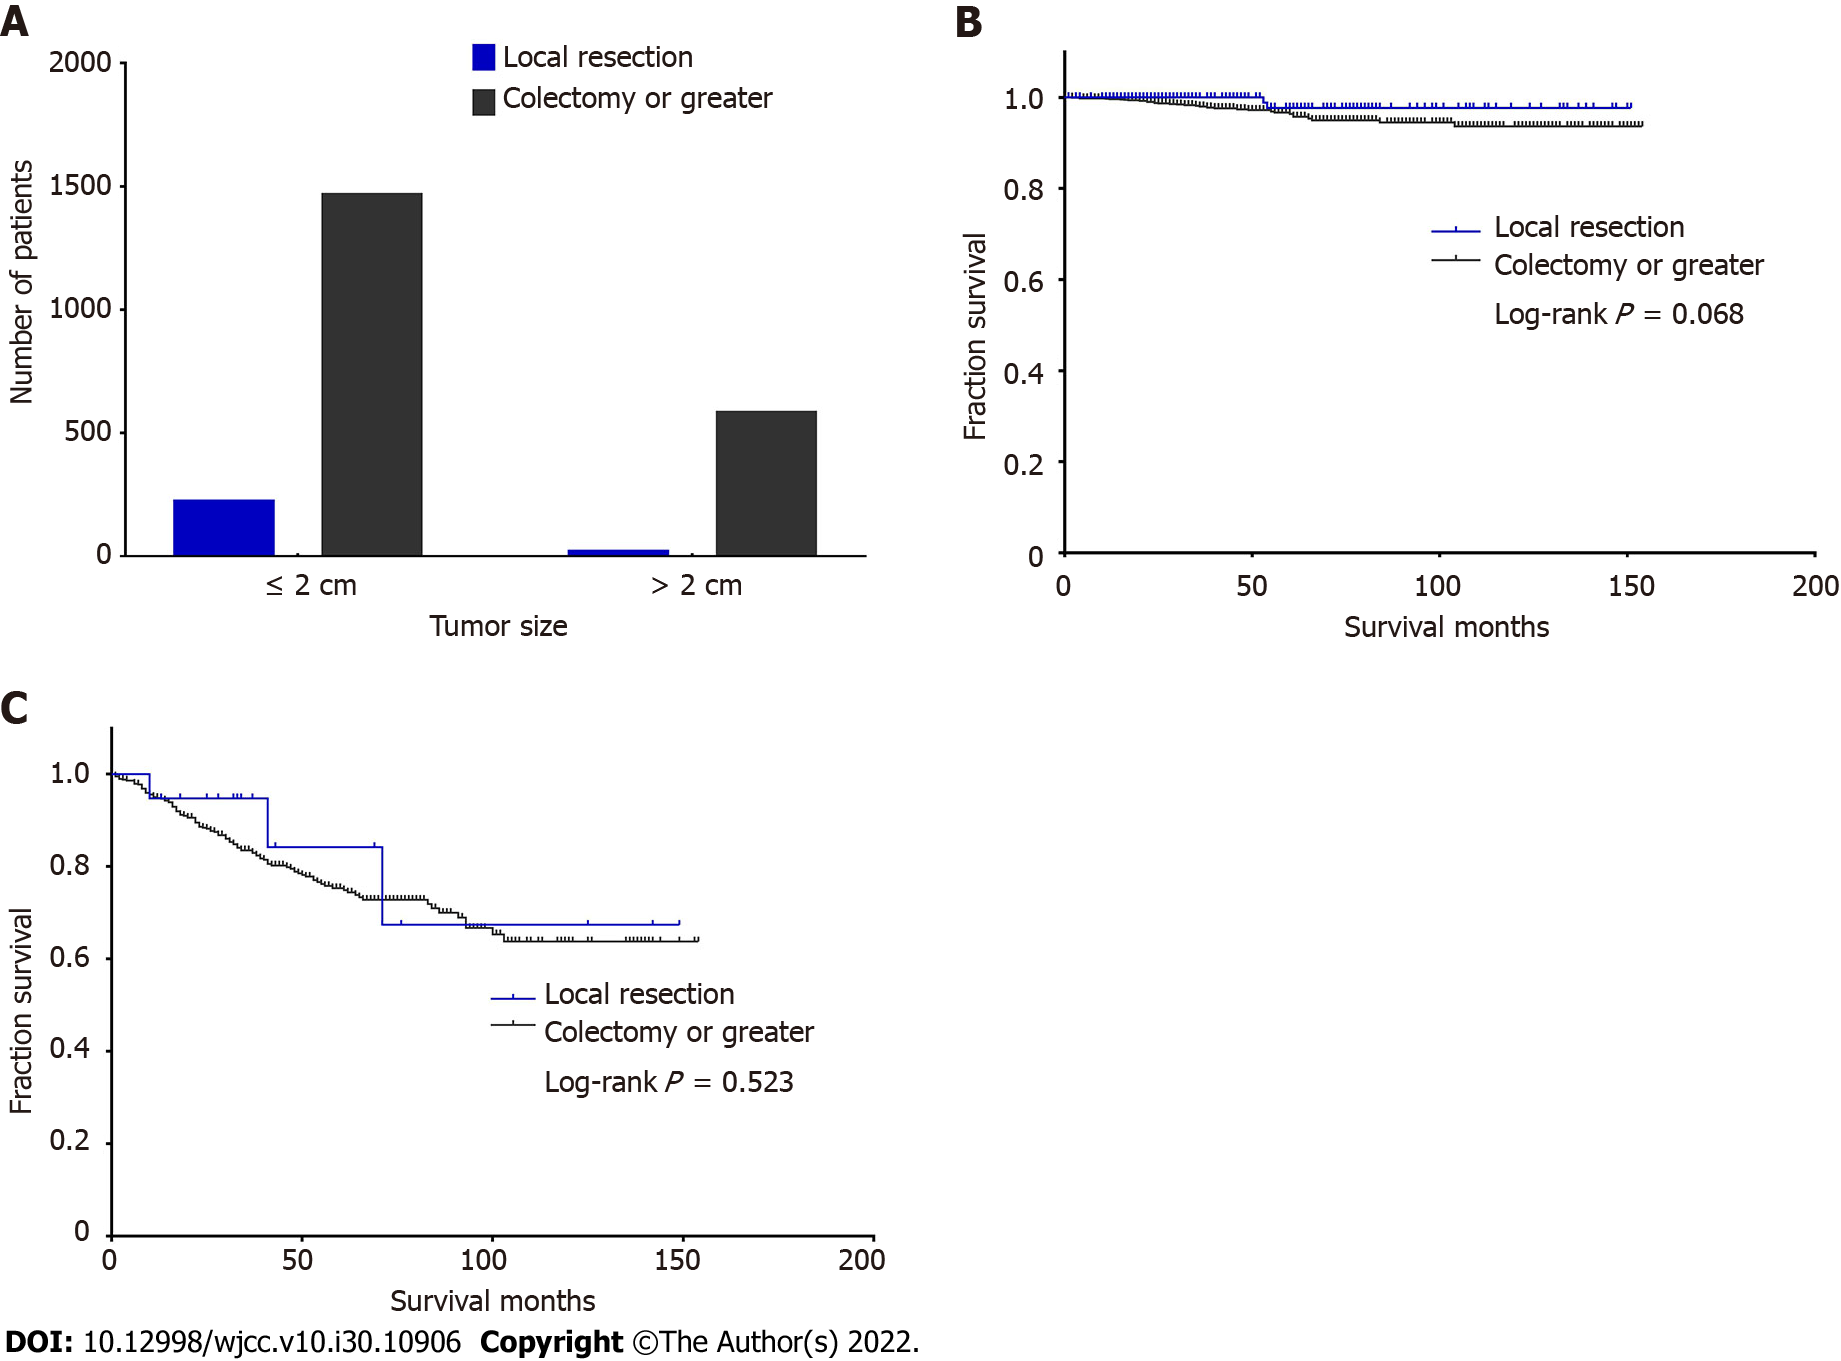
Figure 3 Histogram of different surgery type and survival curves by different surgeries according to tumor size.
A: Histogram of patients undergoing different surgeries; B: Survival curves by different surgeries for patients with tumor size ≤ 2 cm; C: Survival curves by different surgeries for patients with tumor size > 2 cm.
Figure 4 Lymph node status according to tumor size.
The chi-squared test showed significant difference (χ2 = 378.16, P < 0.001).
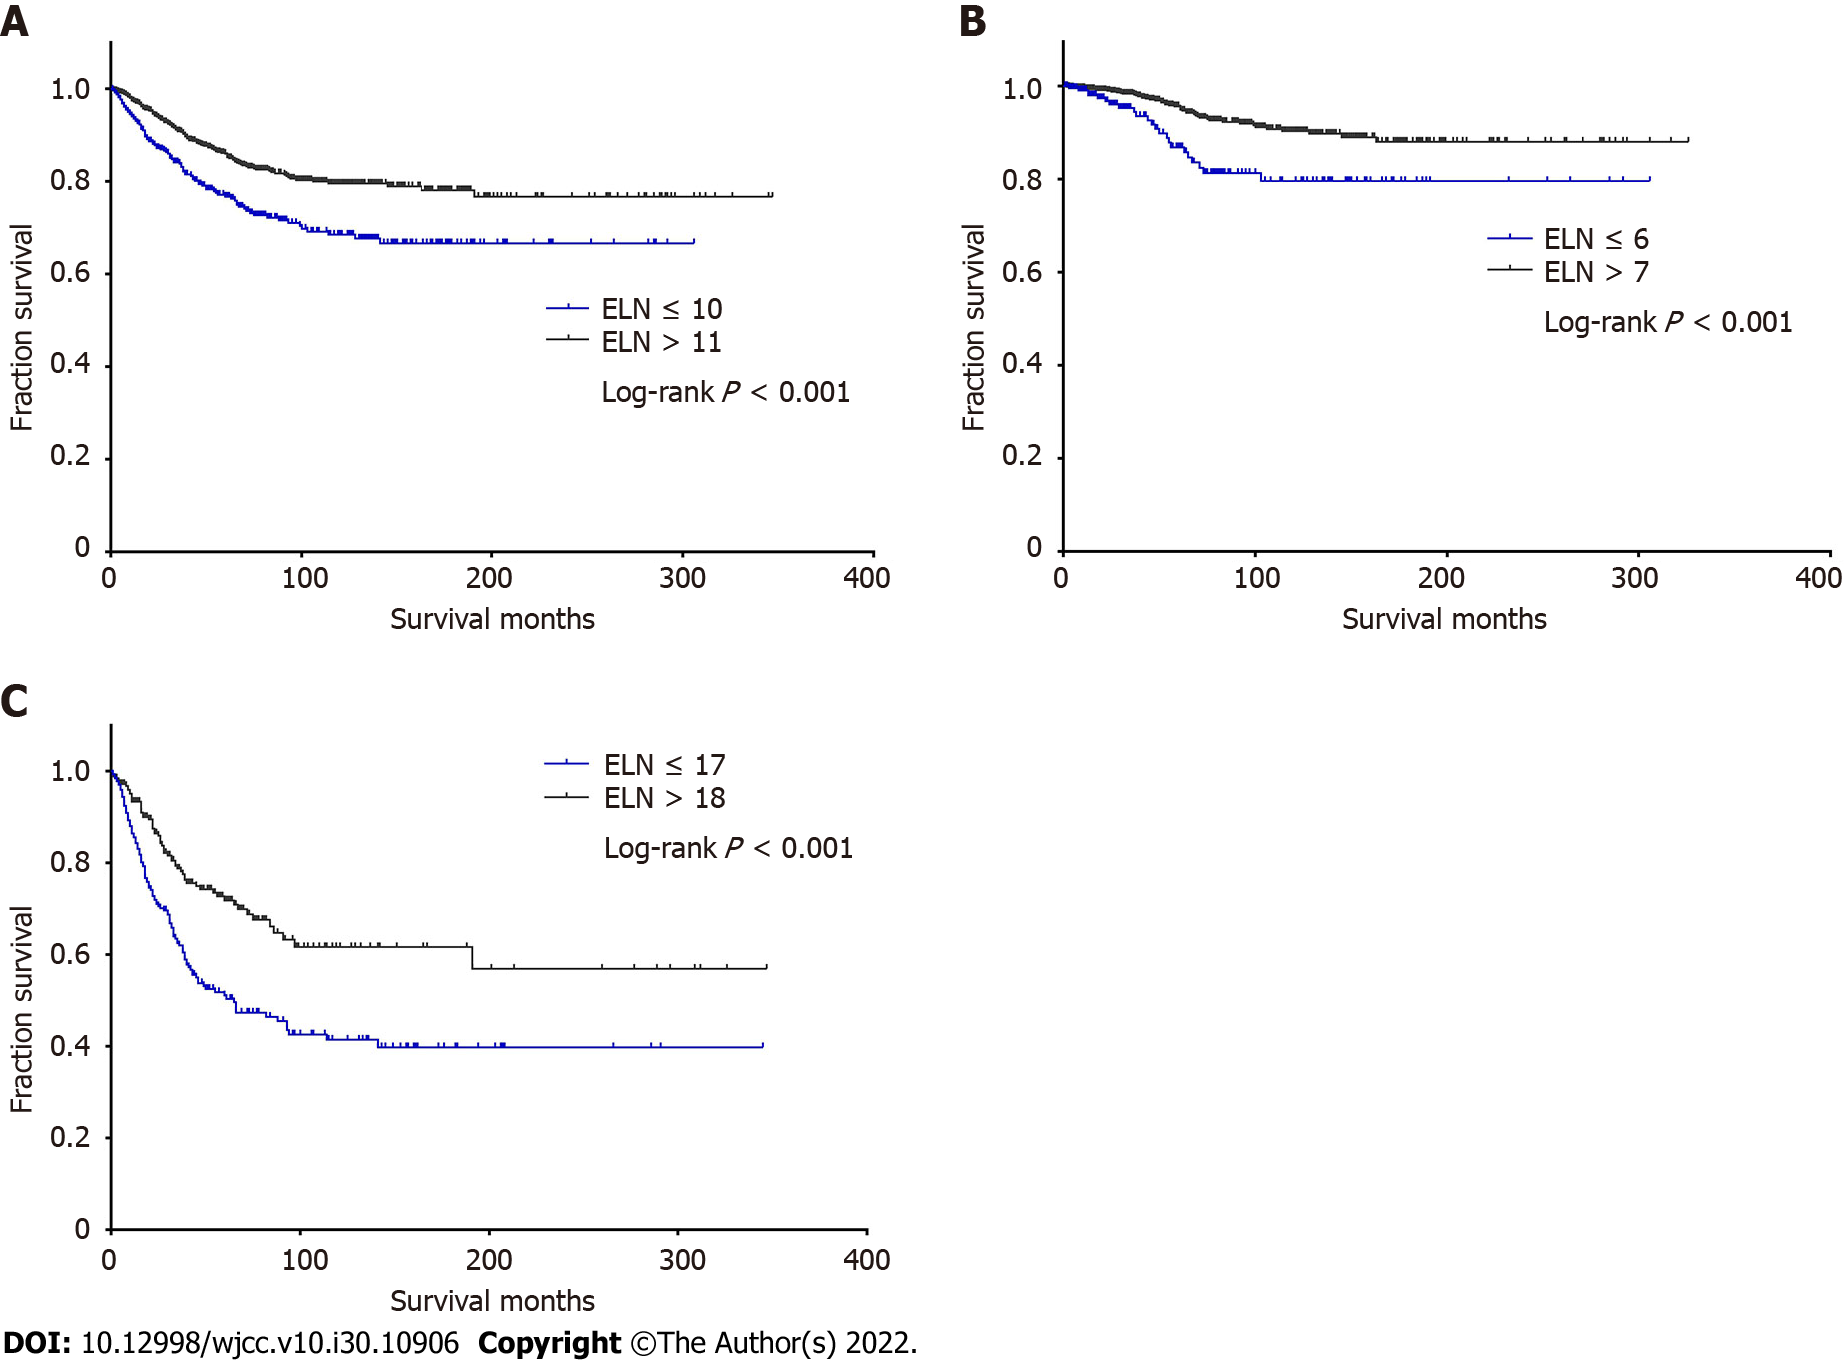
Figure 5 Survival curves by cutoff points of examined lymph nodes.
A: All patients; B: Node-negative patients; C: Node-positive patients. ELN: Examined lymph nodes.
Figure 6 Survival curves by lymph node ratio for node-positive patients.
LNR: Lymph node ratio (the ratio of positive lymph nodes to the total lymph nodes examined).
- Citation: Du R, Xiao JW. Prognostic impact of number of examined lymph nodes on survival of patients with appendiceal neuroendocrine tumors. World J Clin Cases 2022; 10(30): 10906-10920
- URL: https://www.wjgnet.com/2307-8960/full/v10/i30/10906.htm
- DOI: https://dx.doi.org/10.12998/wjcc.v10.i30.10906


