Copyright
©The Author(s) 2022.
World J Clin Cases. Oct 16, 2022; 10(29): 10543-10549
Published online Oct 16, 2022. doi: 10.12998/wjcc.v10.i29.10543
Published online Oct 16, 2022. doi: 10.12998/wjcc.v10.i29.10543
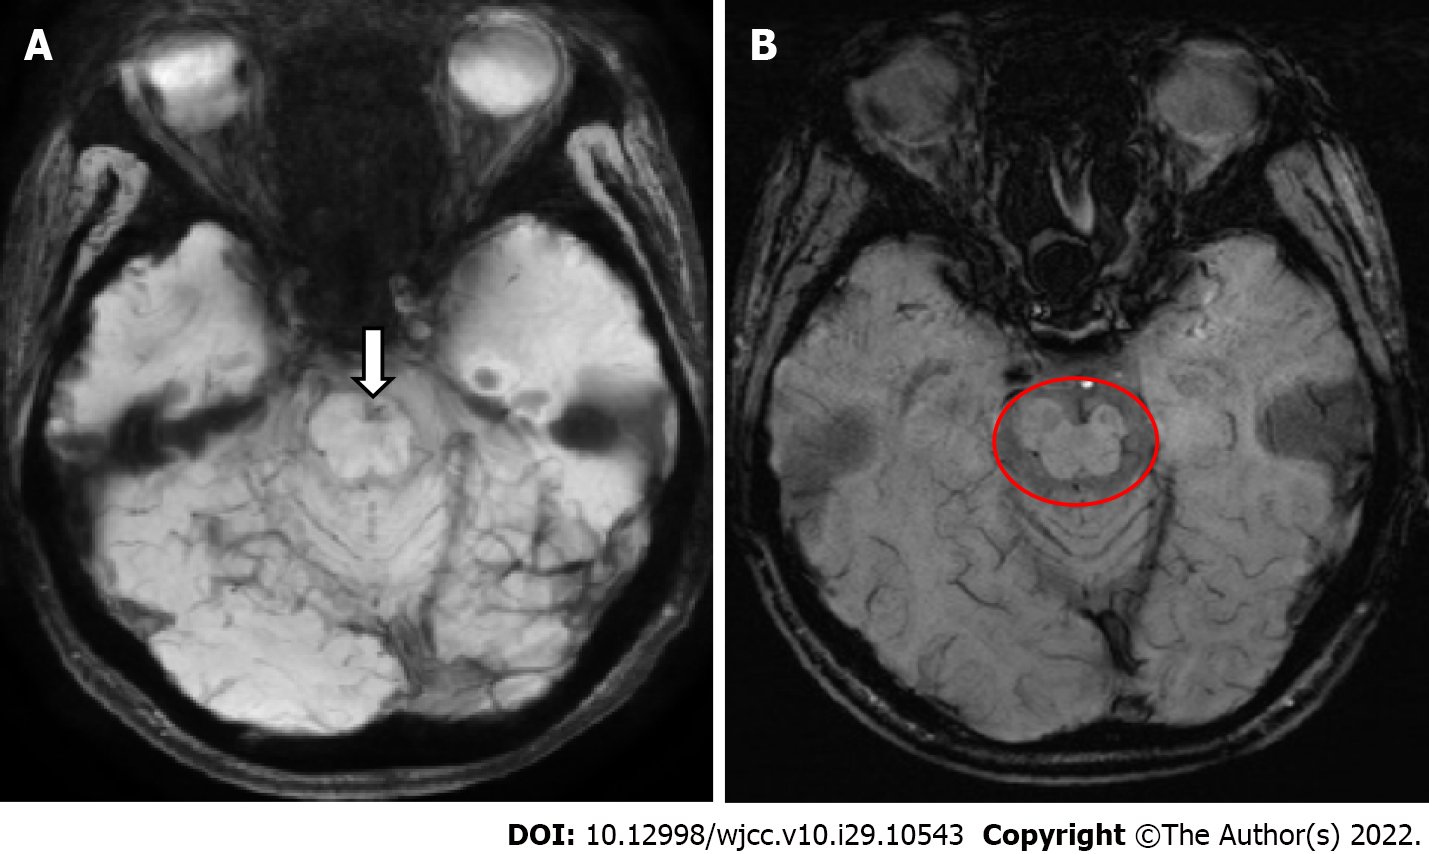
Figure 1 Axial susceptibility weighted imaging showing a subacute infarction in the left pons (A, arrow) and hypotrophy in the left midbrain (B, circle).
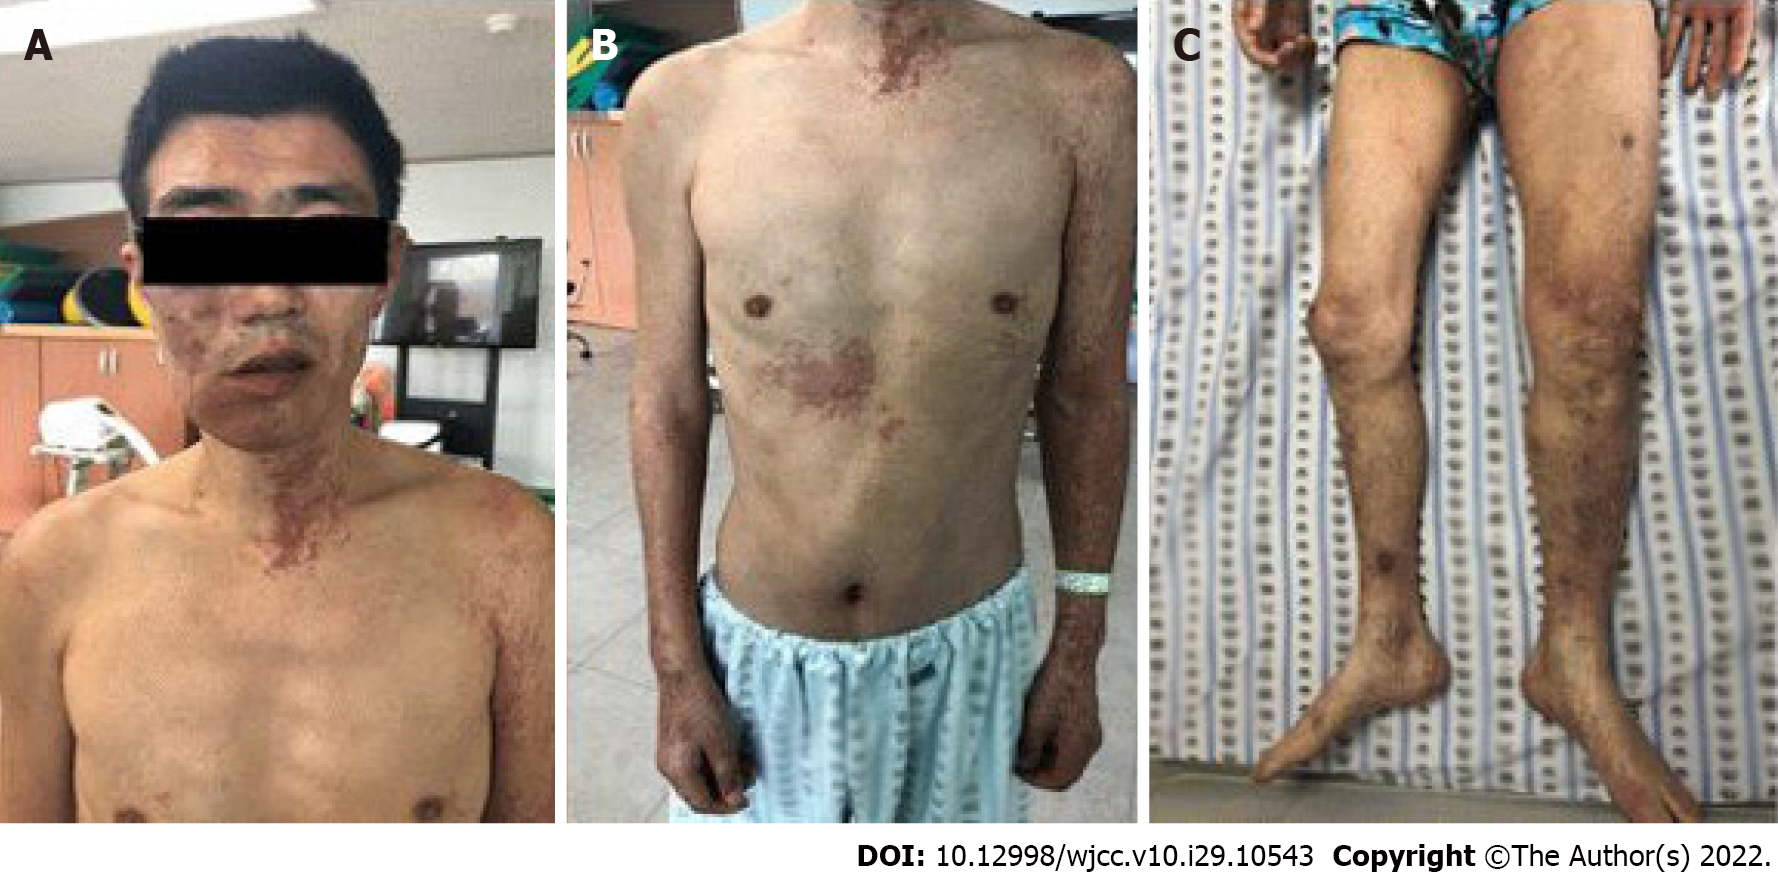
Figure 2 Characteristic manifestations of the patient.
A: Port-wine stain and unilateral soft and skeletal tissue hypertrophy around right chin area; B: Port-wine stains at the left arm, neck, and right trunk; C: Unilateral soft and skeletal tissue hypertrophy and unusual varicosities on the right leg.
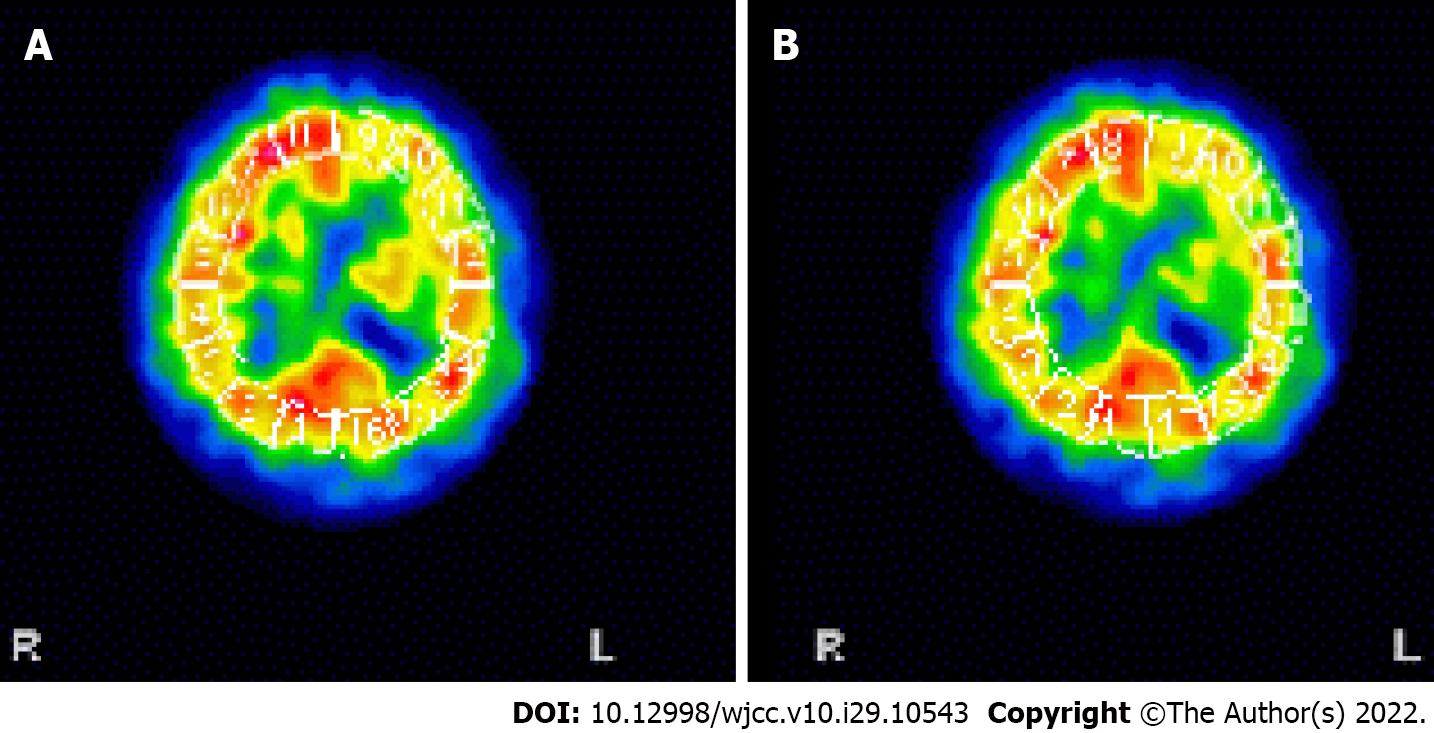
Figure 3 Brain single-photon emission computed tomography (SPECT) showing moderate hypoperfusion in the left frontal and temporal area.
A: SPECT showing hypoperfusion in the left frontal lobe; B: Hypoperfusion in the left temporal lobe.
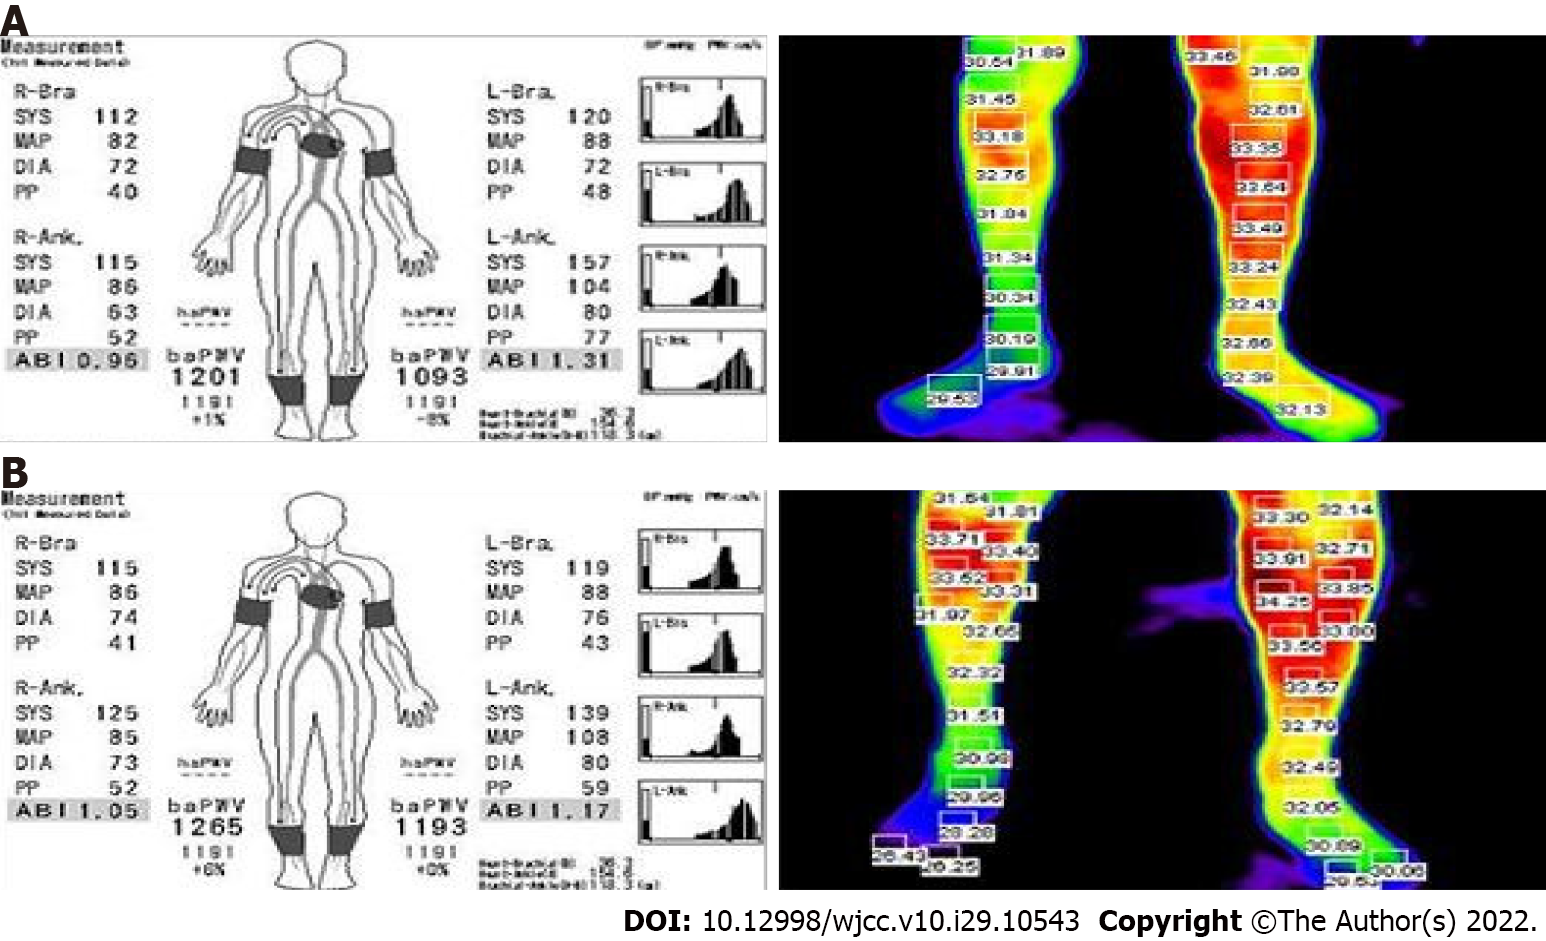
Figure 4 Ankle brachial index and thermography of lower leg before and after exercise.
A: Ankle brachial index ABI (left) and thermography (right) before exercise; B: ABI (left) after exercise showing a 28 mmHg difference of ankle SBP and thermography (right) showing an average elevation of 0.5 °C for surface temperature of right lower extremity.
- Citation: Lee G, Choi T. Klippel-Trenaunay-Weber syndrome with ischemic stroke: A case report. World J Clin Cases 2022; 10(29): 10543-10549
- URL: https://www.wjgnet.com/2307-8960/full/v10/i29/10543.htm
- DOI: https://dx.doi.org/10.12998/wjcc.v10.i29.10543


