Copyright
©The Author(s) 2022.
World J Clin Cases. Aug 6, 2022; 10(22): 7872-7882
Published online Aug 6, 2022. doi: 10.12998/wjcc.v10.i22.7872
Published online Aug 6, 2022. doi: 10.12998/wjcc.v10.i22.7872
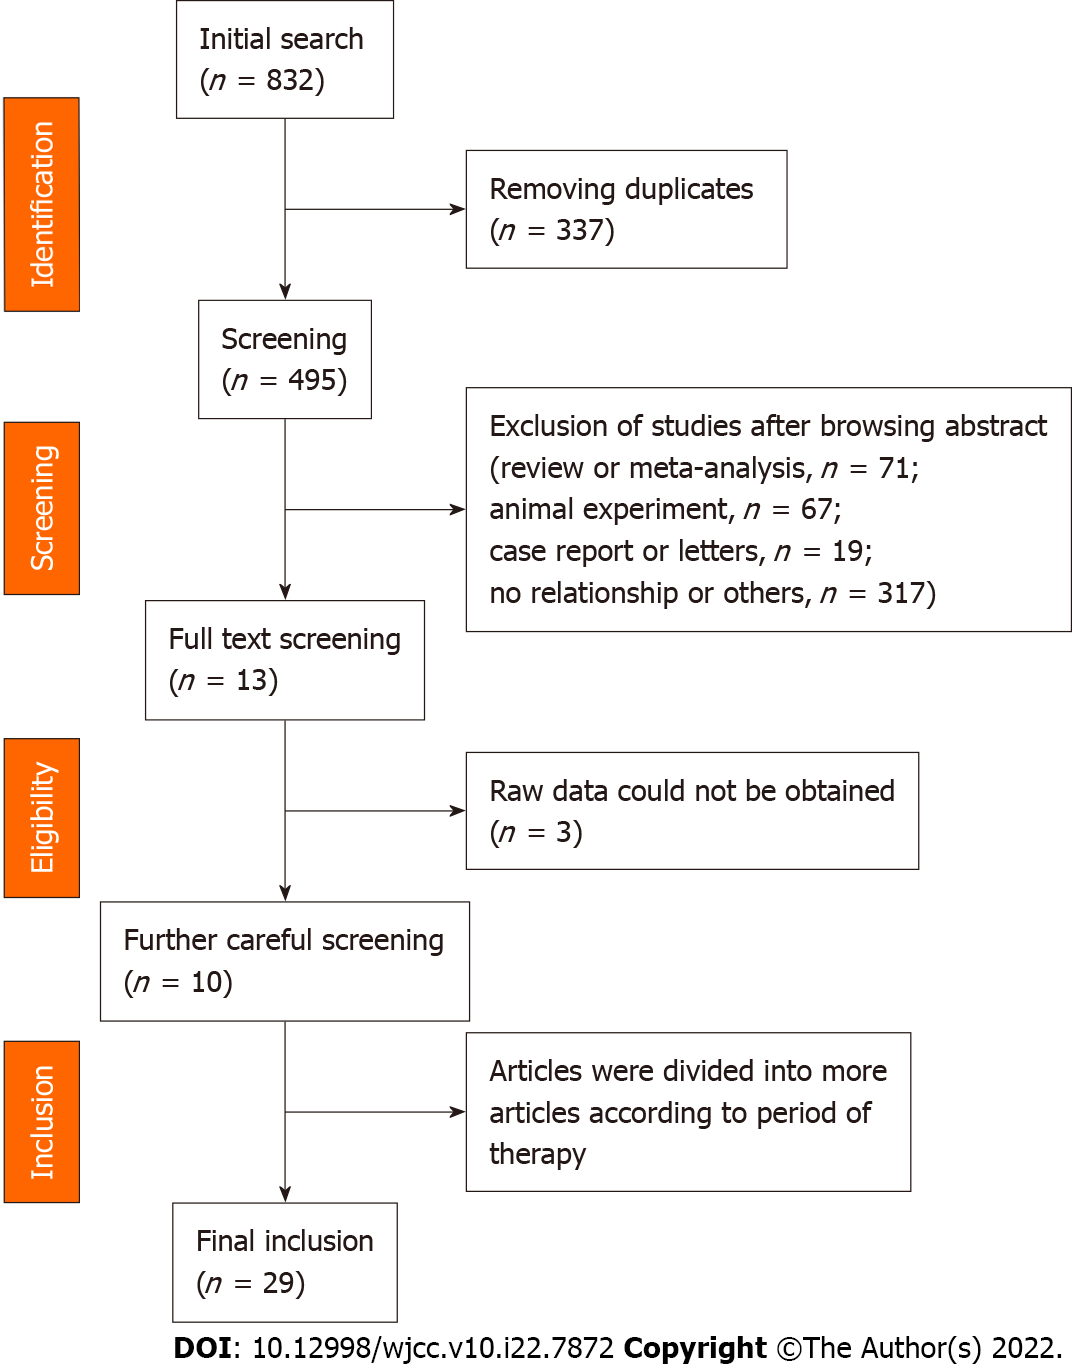
Figure 1 Flow chart.
We searched databases including PubMed, OVID database, Cochrane library, Web of Science, CNKI, Clinicaltrials.gov database and Wanfang database. After screening, 10 studies were included in the meta-analysis. After separating, 29 studies were included in the meta-analysis.
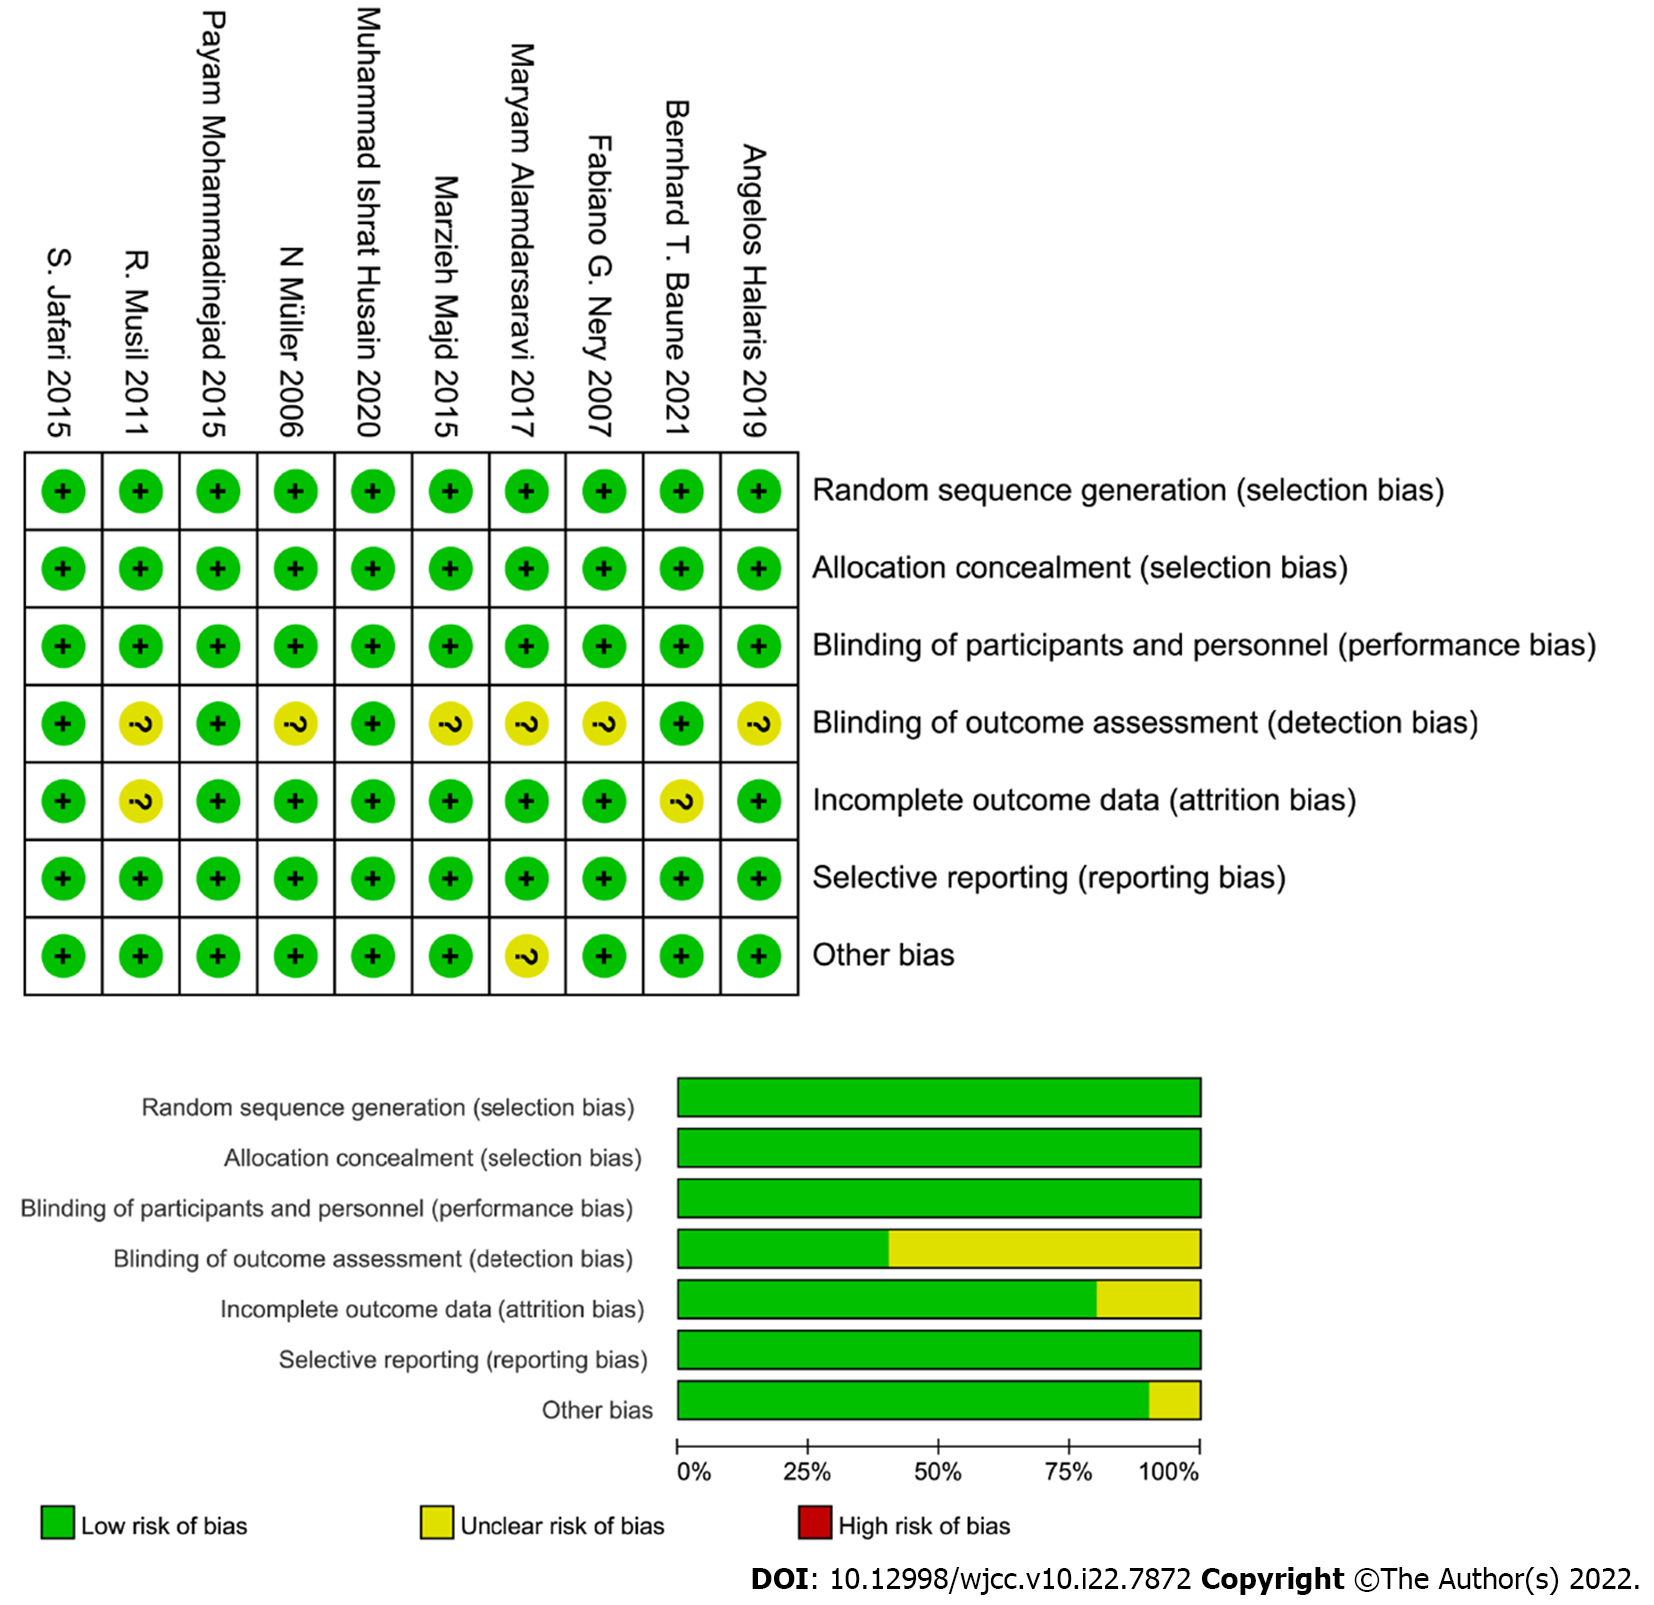
Figure 2 Risk of bias graph and risk of bias summary.
Information containing seven aspects such as random sequence generation (selection bias), allocation concealment (selection bias), blinding of participants and personnel (performance bias), blinding of outcome assessment, incomplete outcome data (attrition bias), selection reporting (reporting bias) and other bias was used to assess the quality of all selected studies.
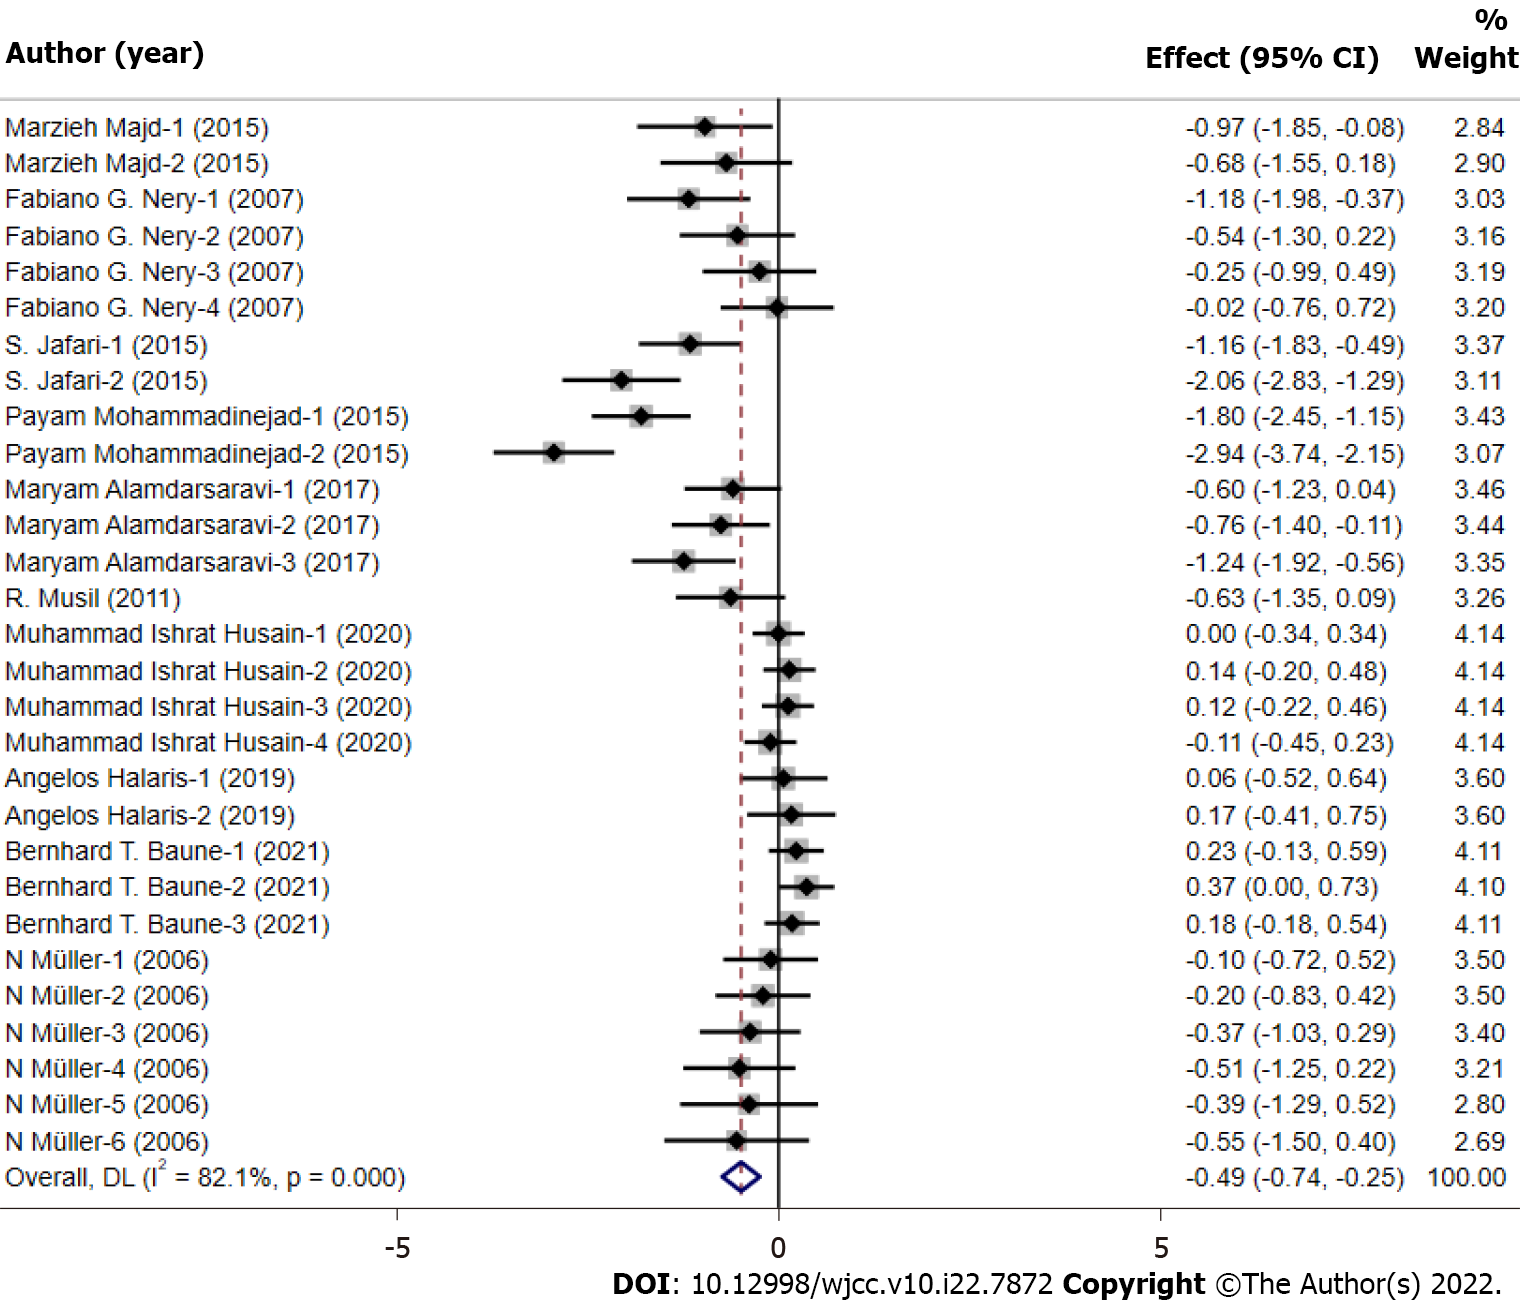
Figure 3 The pooled quantitative synthesis for depression scores in the celecoxib group and control group.
Twenty-nine studies were included in the meta-analysis. With the random effect model, the depression scores were calculated through using standardized mean differences (grey squares with small black squares) with 95%CIs (horizontal lines through gray squares) and pooled-effect sizes (blue diamonds).
Figure 4 Subgroup analysis about the depression scale, depression type and period of therapy.
A: Depression scale; B: Depression type; C: Period of therapy. With the random effect model, the depression scores were calculated through using standardized mean differences (grey squares with small black squares) with 95%CIs (horizontal lines through gray squares) and pooled-effect sizes (blue diamonds).
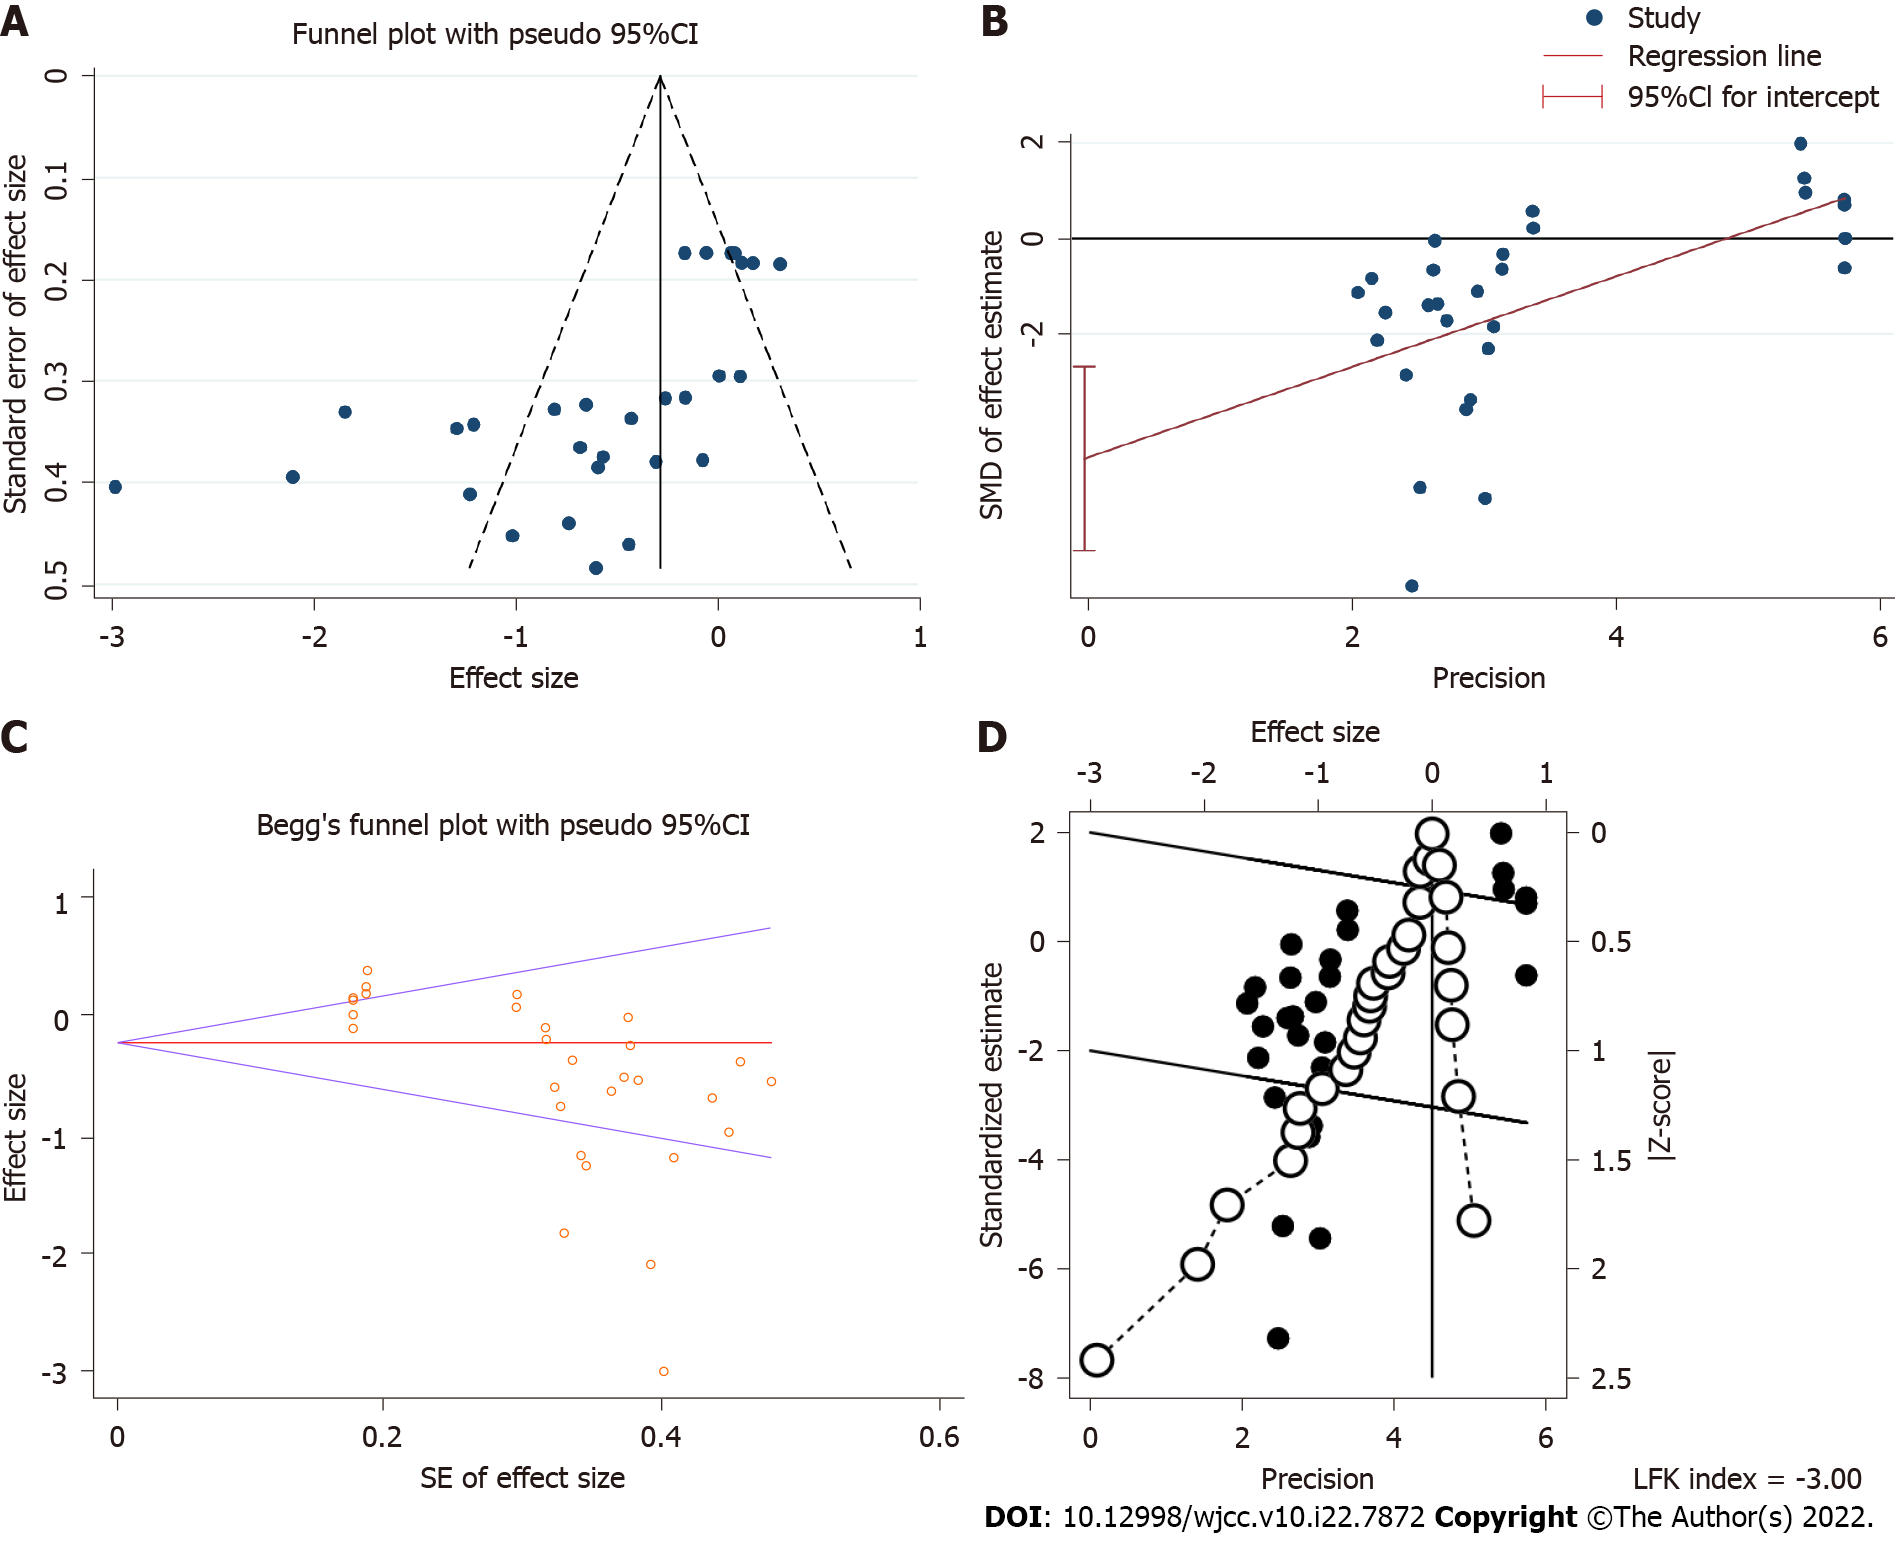
Figure 5 Publication bias.
A: Funnel plot; B: Egger’s test; C: Begg’s test; D: Doi plot. SMD: Standardized mean difference.
- Citation: Wang Z, Wu Q, Wang Q. Effect of celecoxib on improving depression: A systematic review and meta-analysis. World J Clin Cases 2022; 10(22): 7872-7882
- URL: https://www.wjgnet.com/2307-8960/full/v10/i22/7872.htm
- DOI: https://dx.doi.org/10.12998/wjcc.v10.i22.7872


