Copyright
©The Author(s) 2021.
World J Gastrointest Surg. Oct 27, 2021; 13(10): 1258-1266
Published online Oct 27, 2021. doi: 10.4240/wjgs.v13.i10.1258
Published online Oct 27, 2021. doi: 10.4240/wjgs.v13.i10.1258
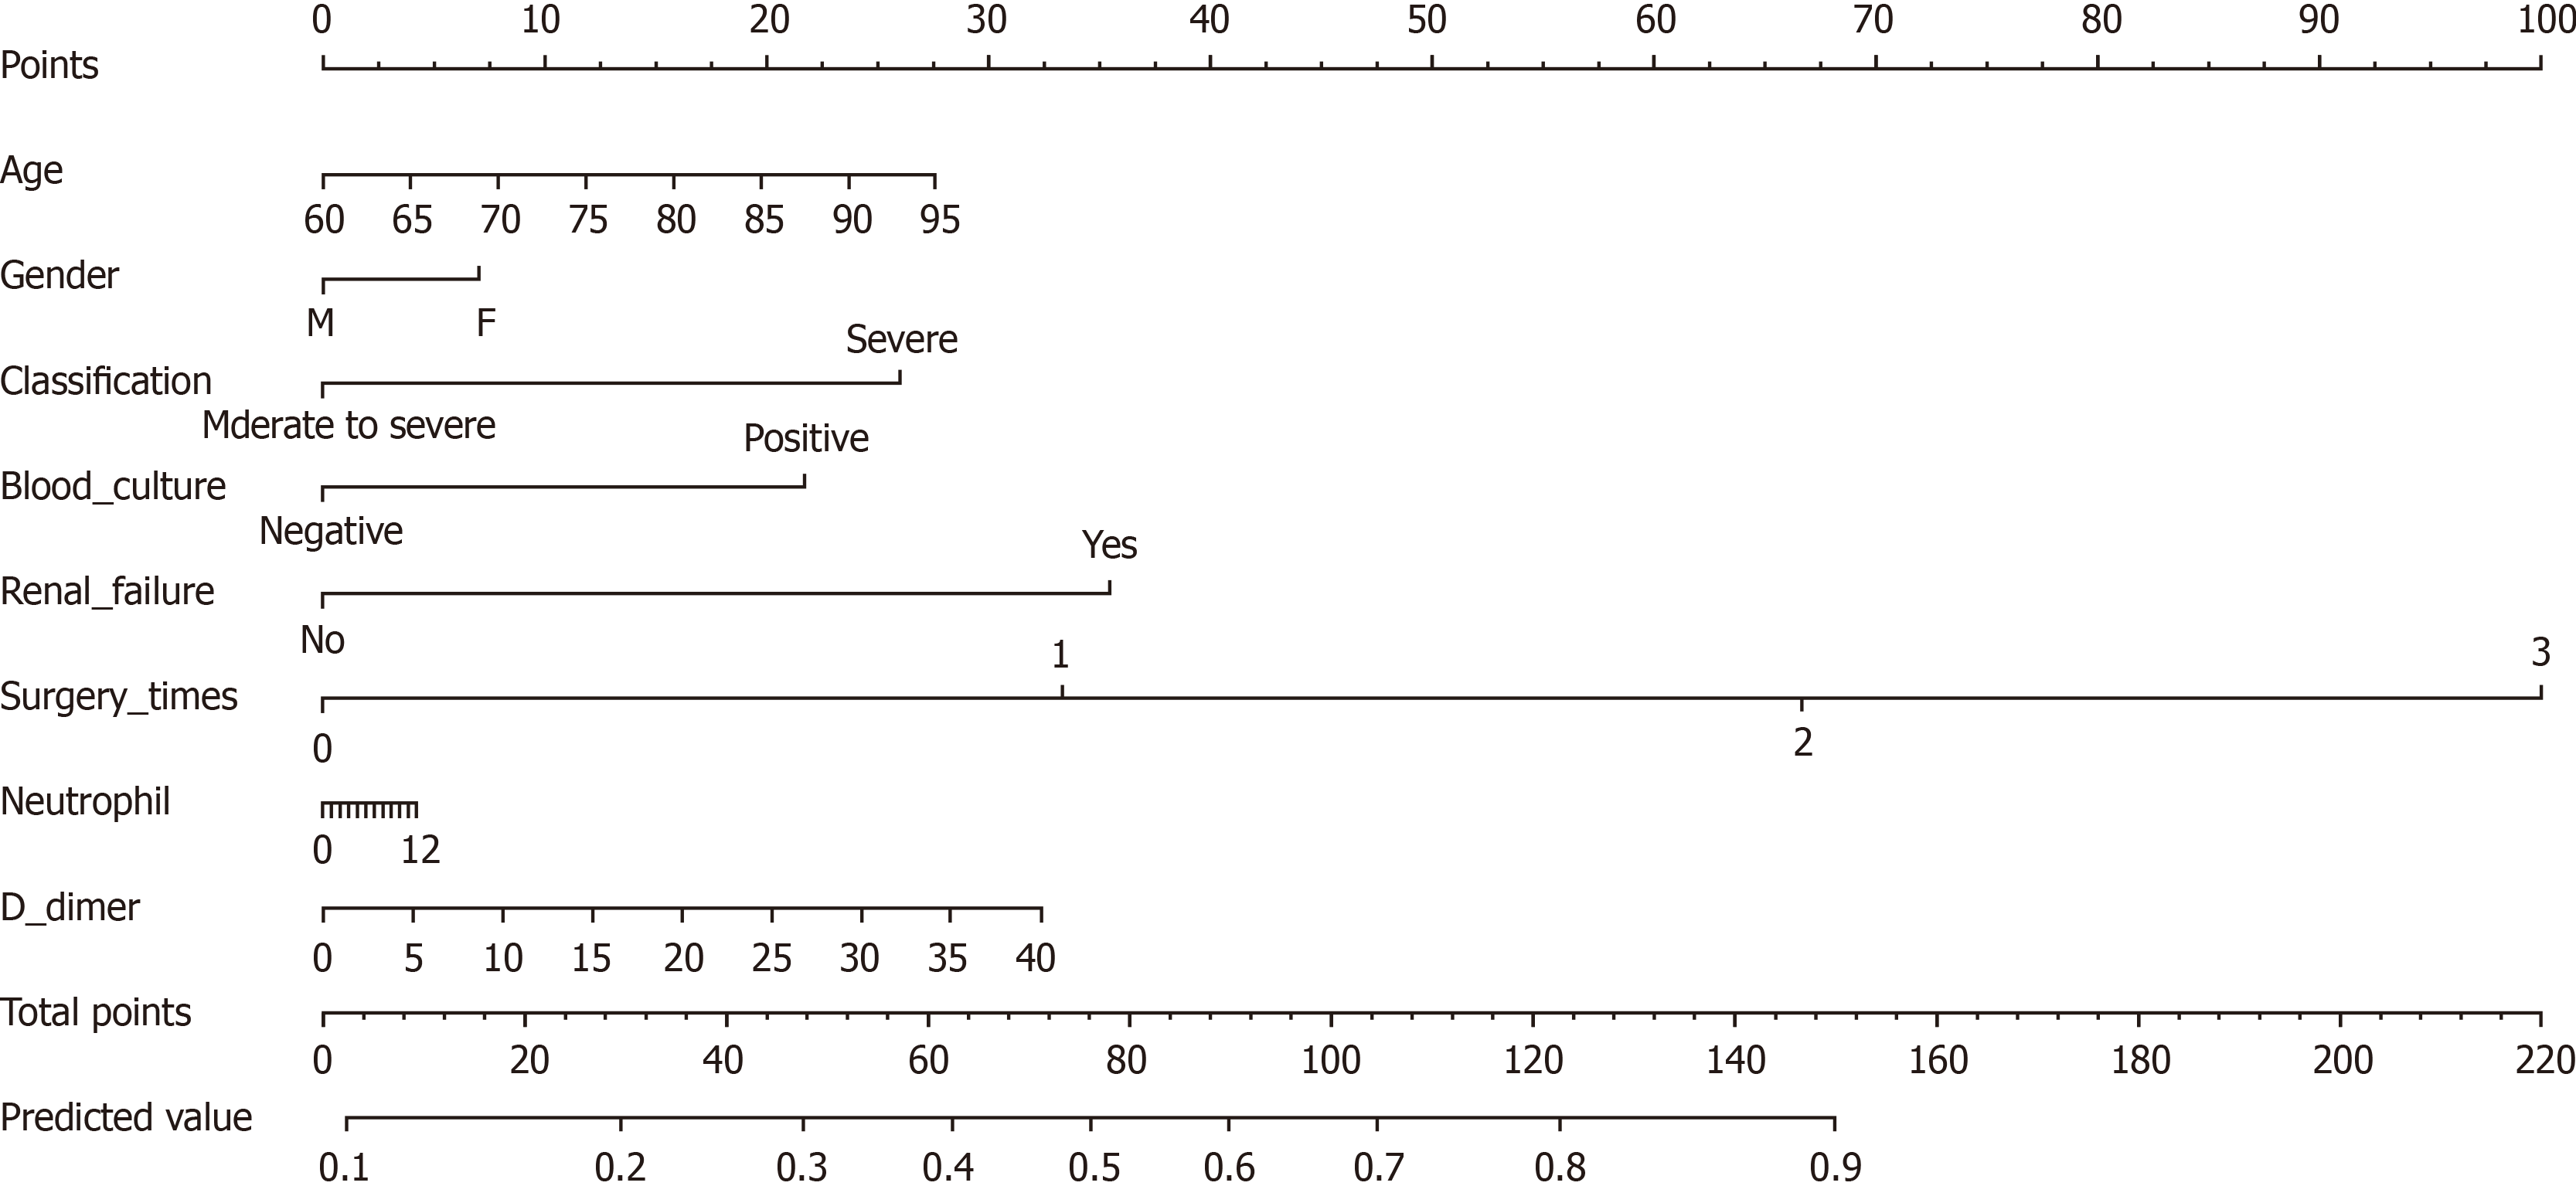
Figure 1 Nomogram for predicting deep vein thrombosis in non-mild acute pancreatitis patients.
The nomogram maps the predicted probability of deep vein thrombosis (DVT) on a scale of 0 to 220. For each covariate, draw a vertical line upwards and record corresponding points. Repeated it and added the points. A total score corresponds to a predicted probability of DVT at the bottom of the nomogram.
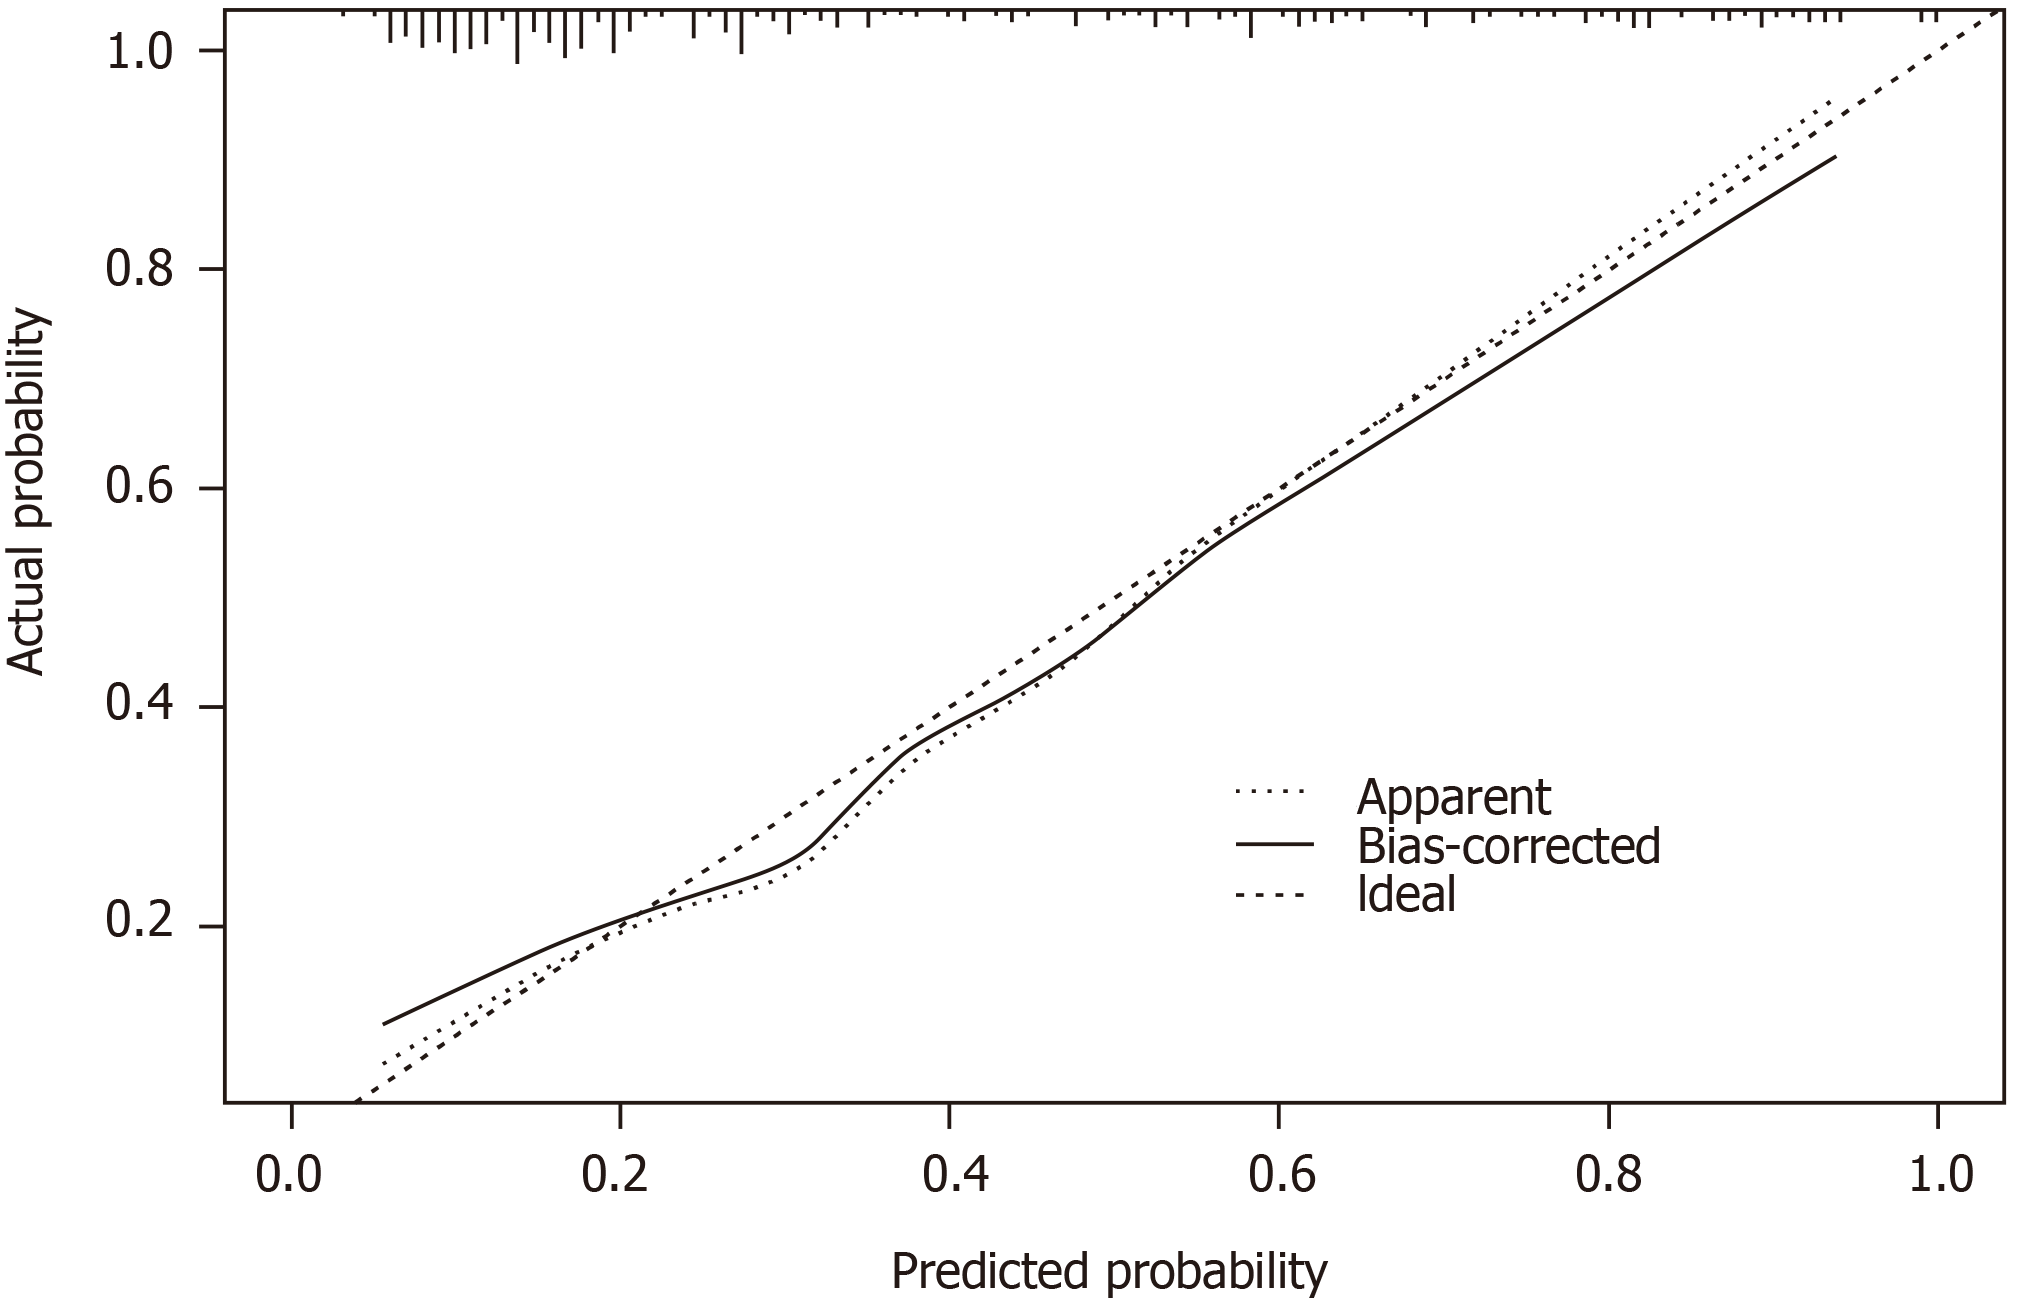
Figure 2 Calibration curve for deep vein thrombosis on the nomogram.
The ideal line represents a perfect match between predicted and observed occurrence of deep vein thrombosis; Apparent line, prediction capability of the model obtained after data analysis; Bias-corrected line, prediction capability of the model obtained after bootstrap correction.
- Citation: Yang DJ, Li M, Yue C, Hu WM, Lu HM. Development and validation of a prediction model for deep vein thrombosis in older non-mild acute pancreatitis patients. World J Gastrointest Surg 2021; 13(10): 1258-1266
- URL: https://www.wjgnet.com/1948-9366/full/v13/i10/1258.htm
- DOI: https://dx.doi.org/10.4240/wjgs.v13.i10.1258


