Copyright
©The Author(s) 2024.
World J Diabetes. Apr 15, 2024; 15(4): 664-674
Published online Apr 15, 2024. doi: 10.4239/wjd.v15.i4.664
Published online Apr 15, 2024. doi: 10.4239/wjd.v15.i4.664
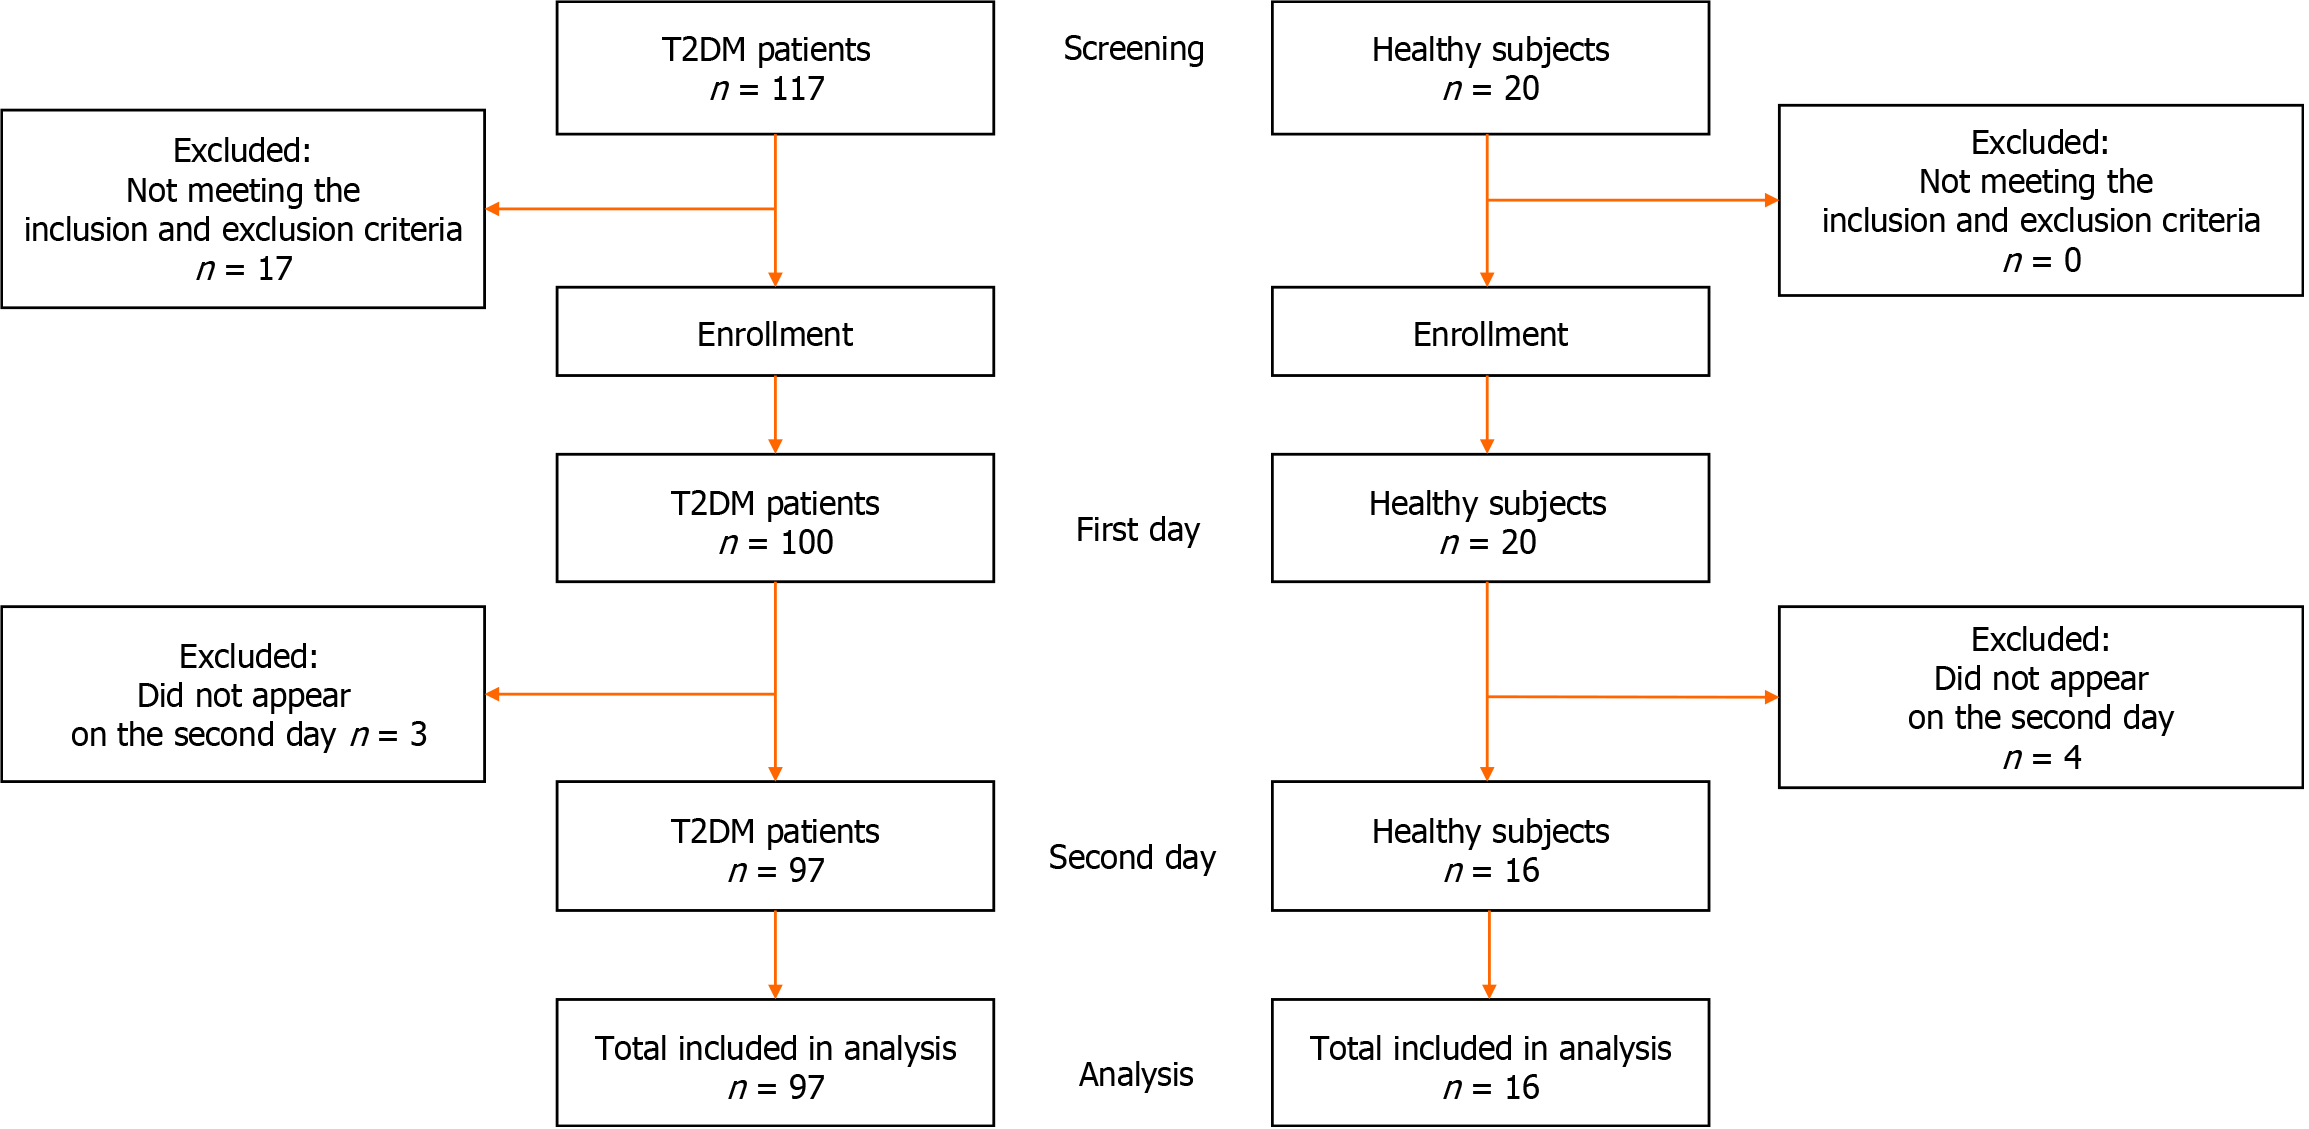
Figure 1 CONSORT flowchart.
T2DM: Type 2 diabetes mellitus.
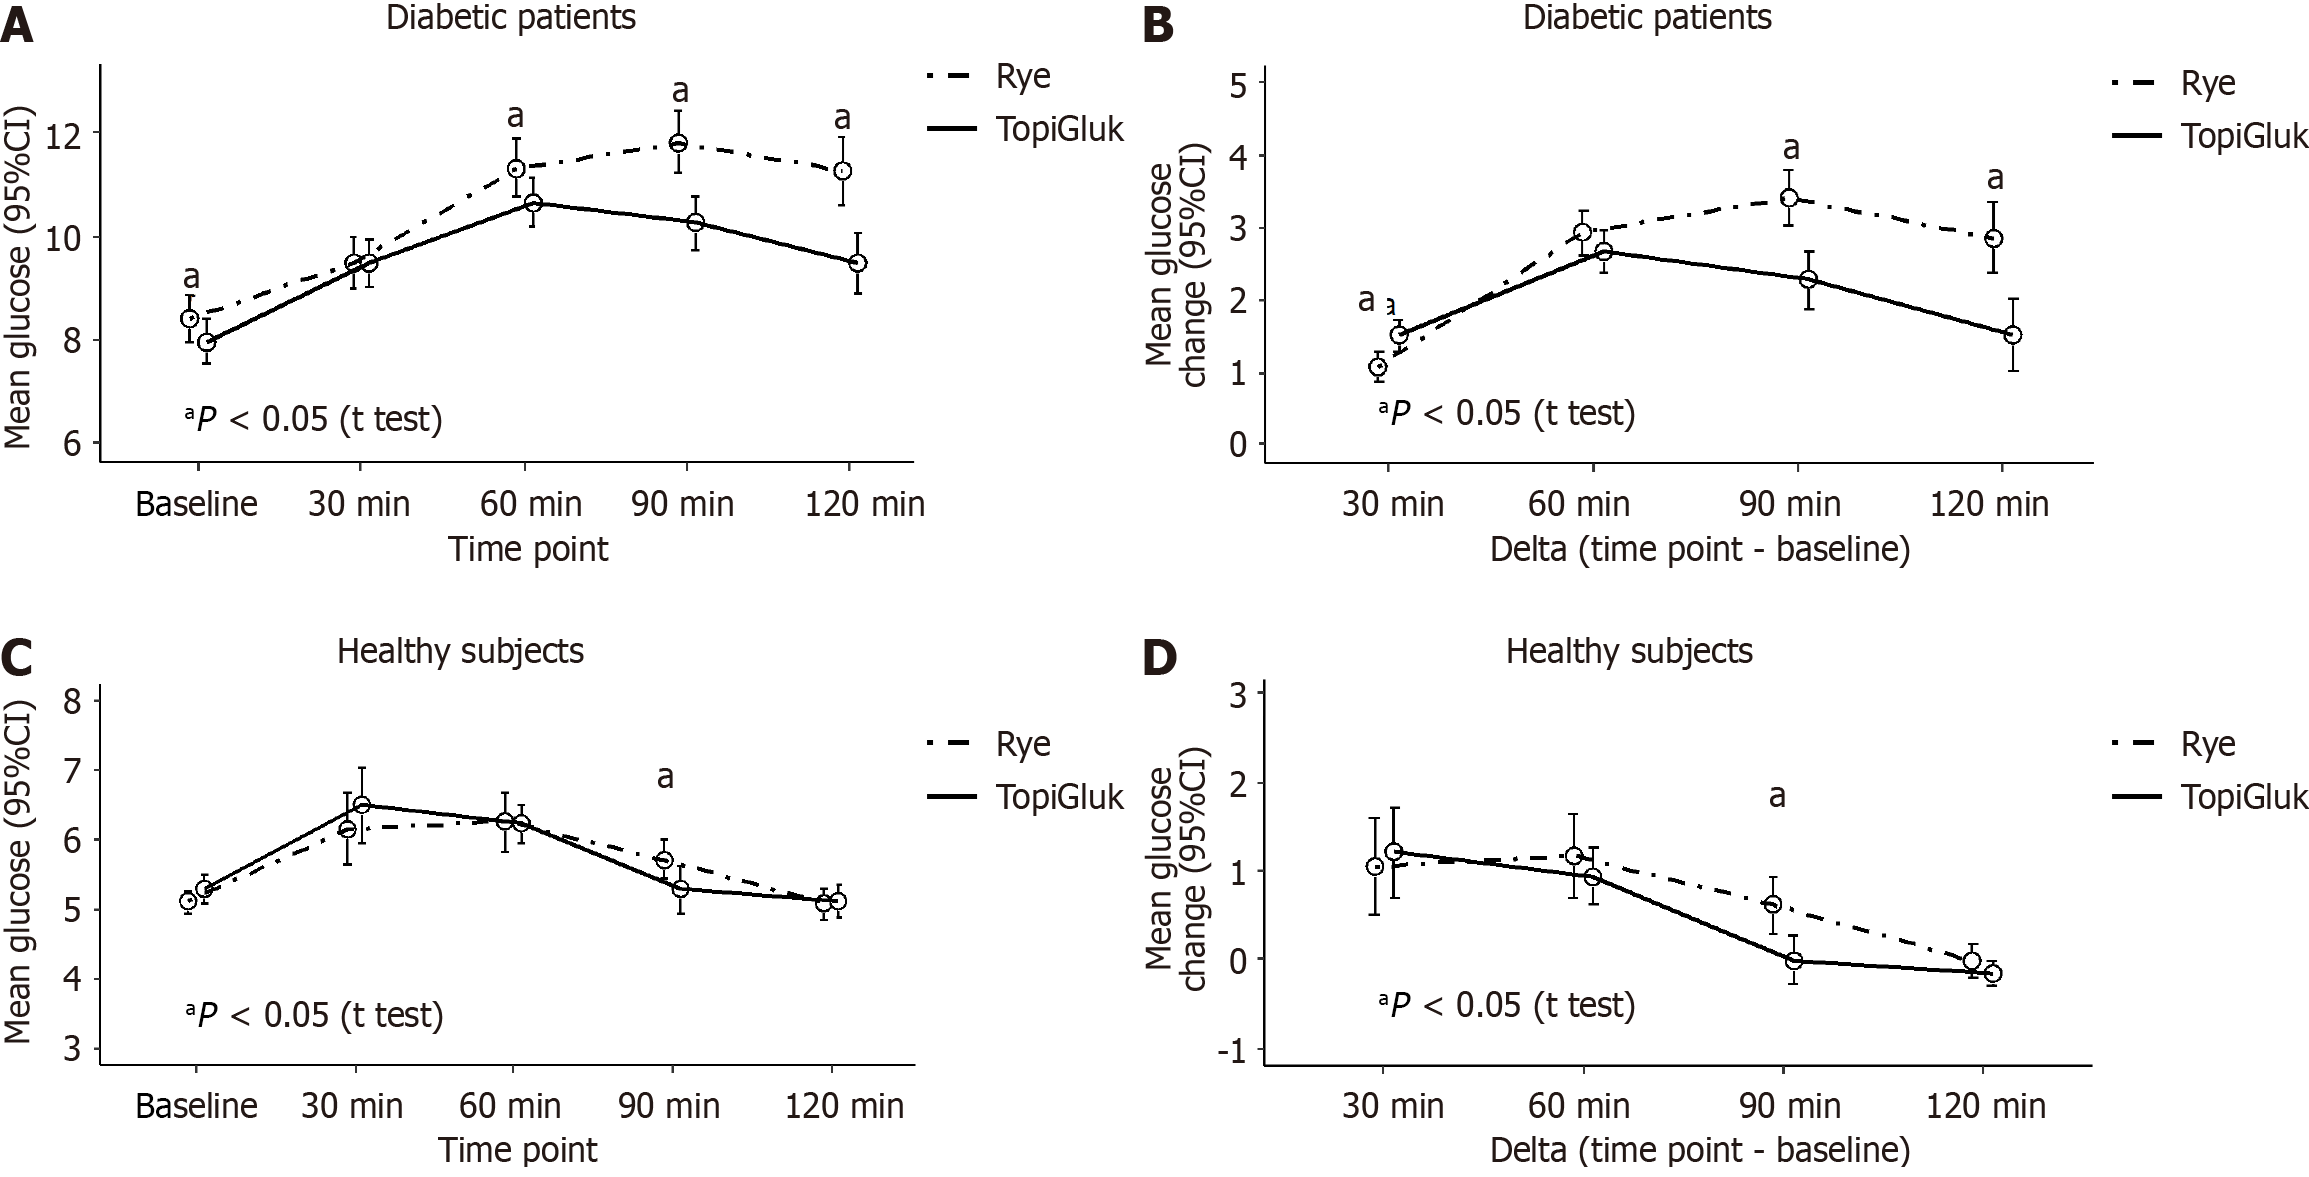
Figure 2 Mean glucose levels and mean glucose change (in mmol/L) after the consumption of rye bread and the special type of bread with TopiGluk® in diabetes mellitus type 2 patients and healthy subjects.
A: Absolute values of glucose in diabetic patients; B: Glucose change from baseline in diabetic patients; C: Absolute values of glucose in healthy subjects; D: Glucose change from baseline in healthy subjects. aP < 0.05.
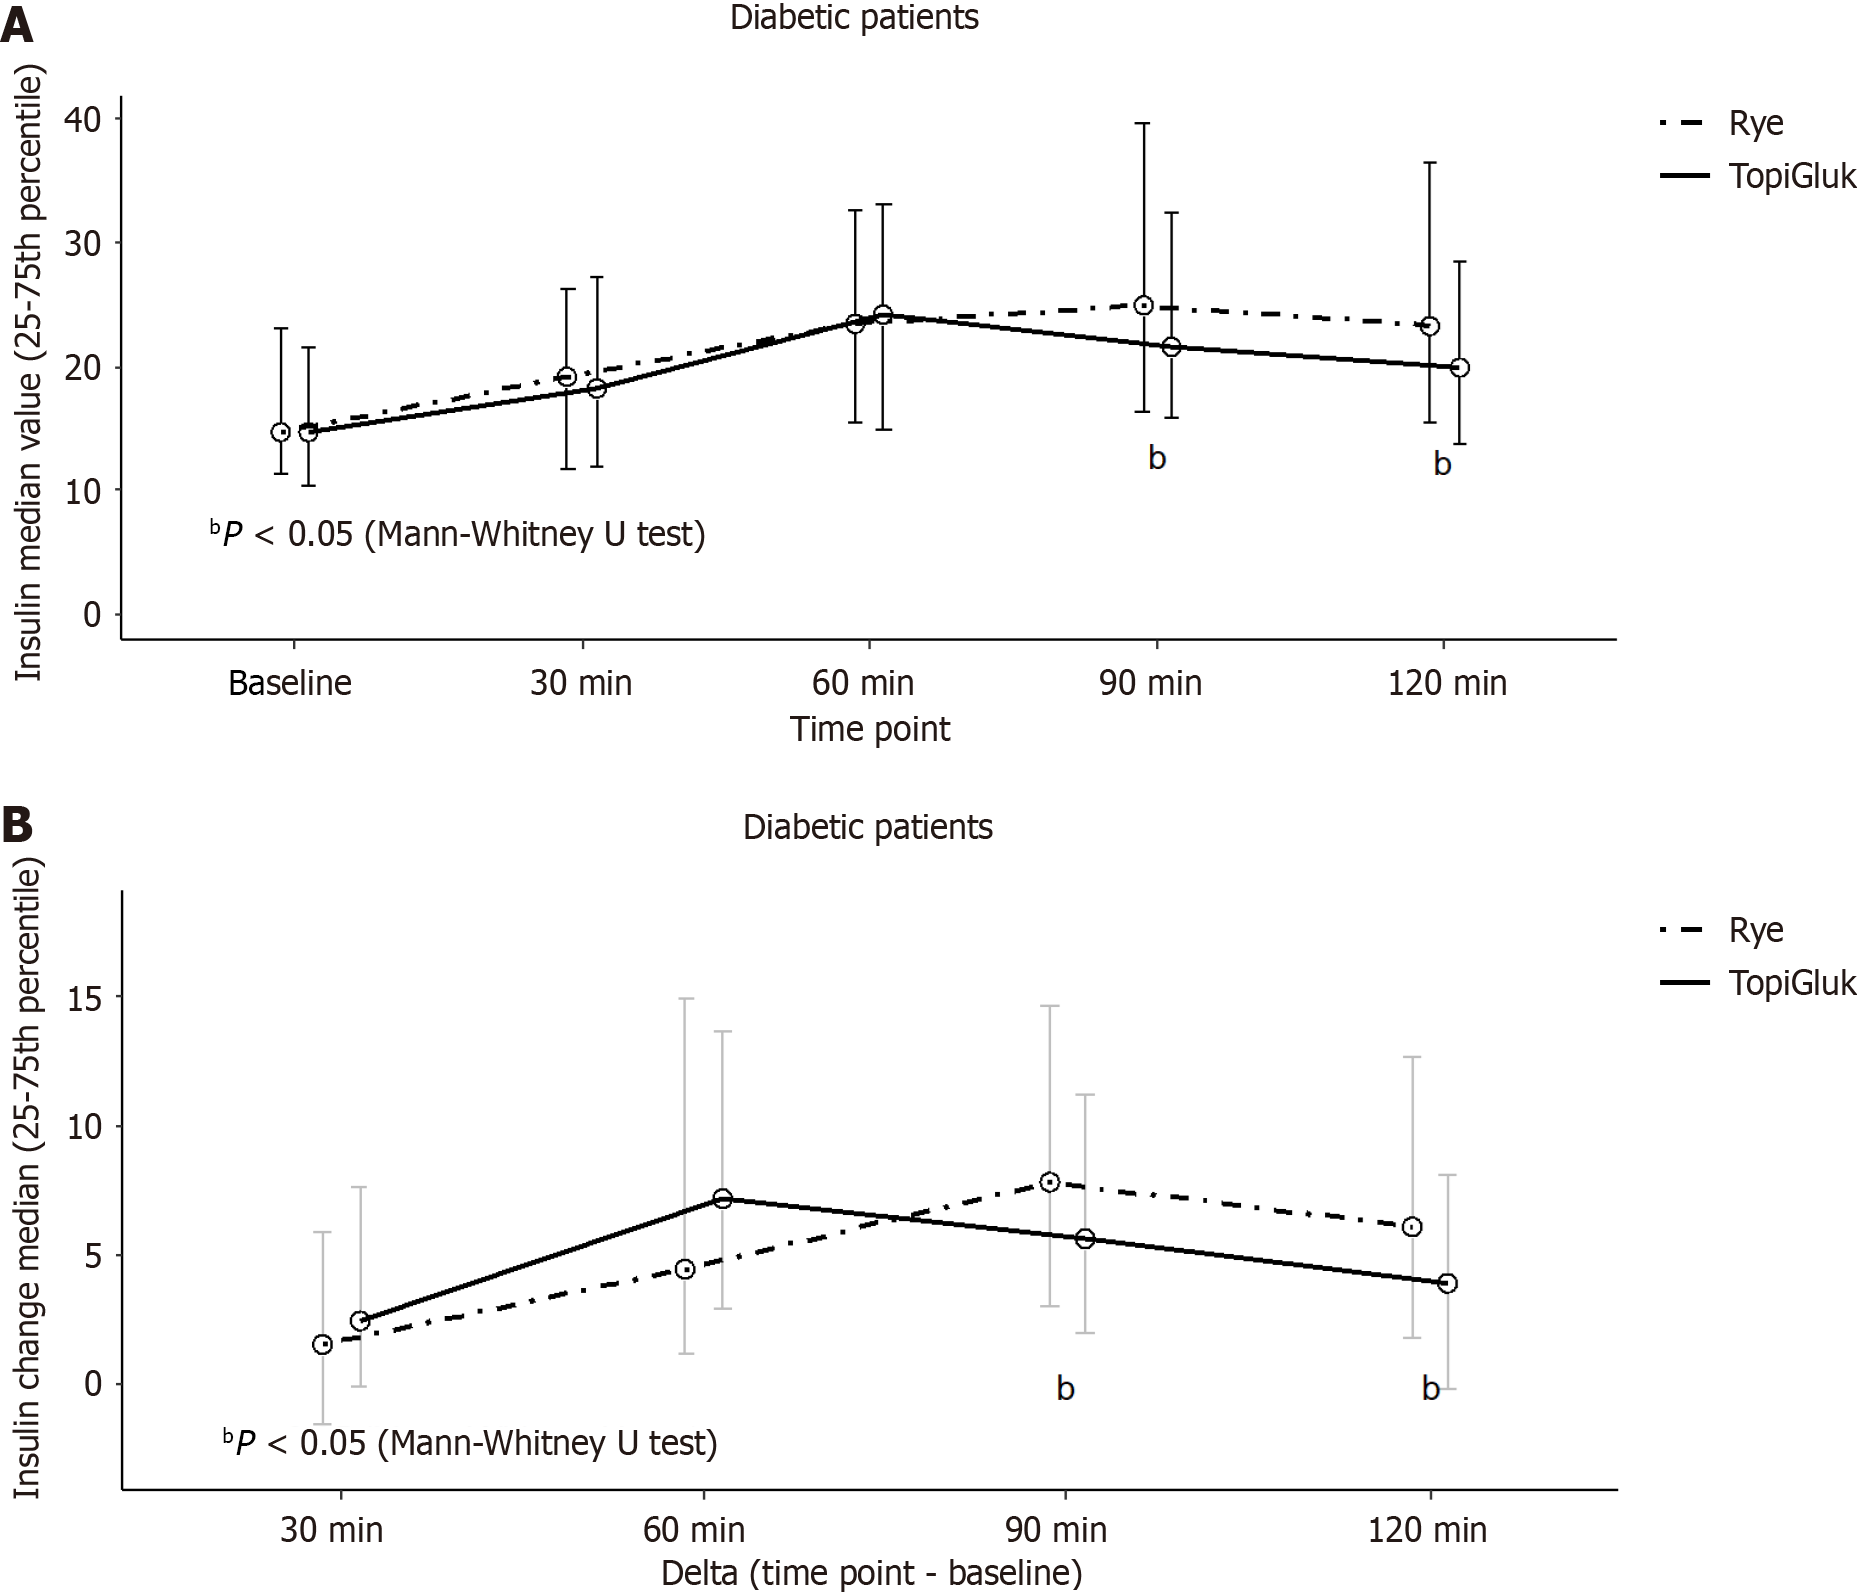
Figure 3 Insulin levels (µIU/L), median (25-75th percentile) and change after the consumption of rye bread and the special type of bread with TopiGluk® in diabetic patients.
A: Absolute values; B: Change compared to baseline. bP < 0.05.
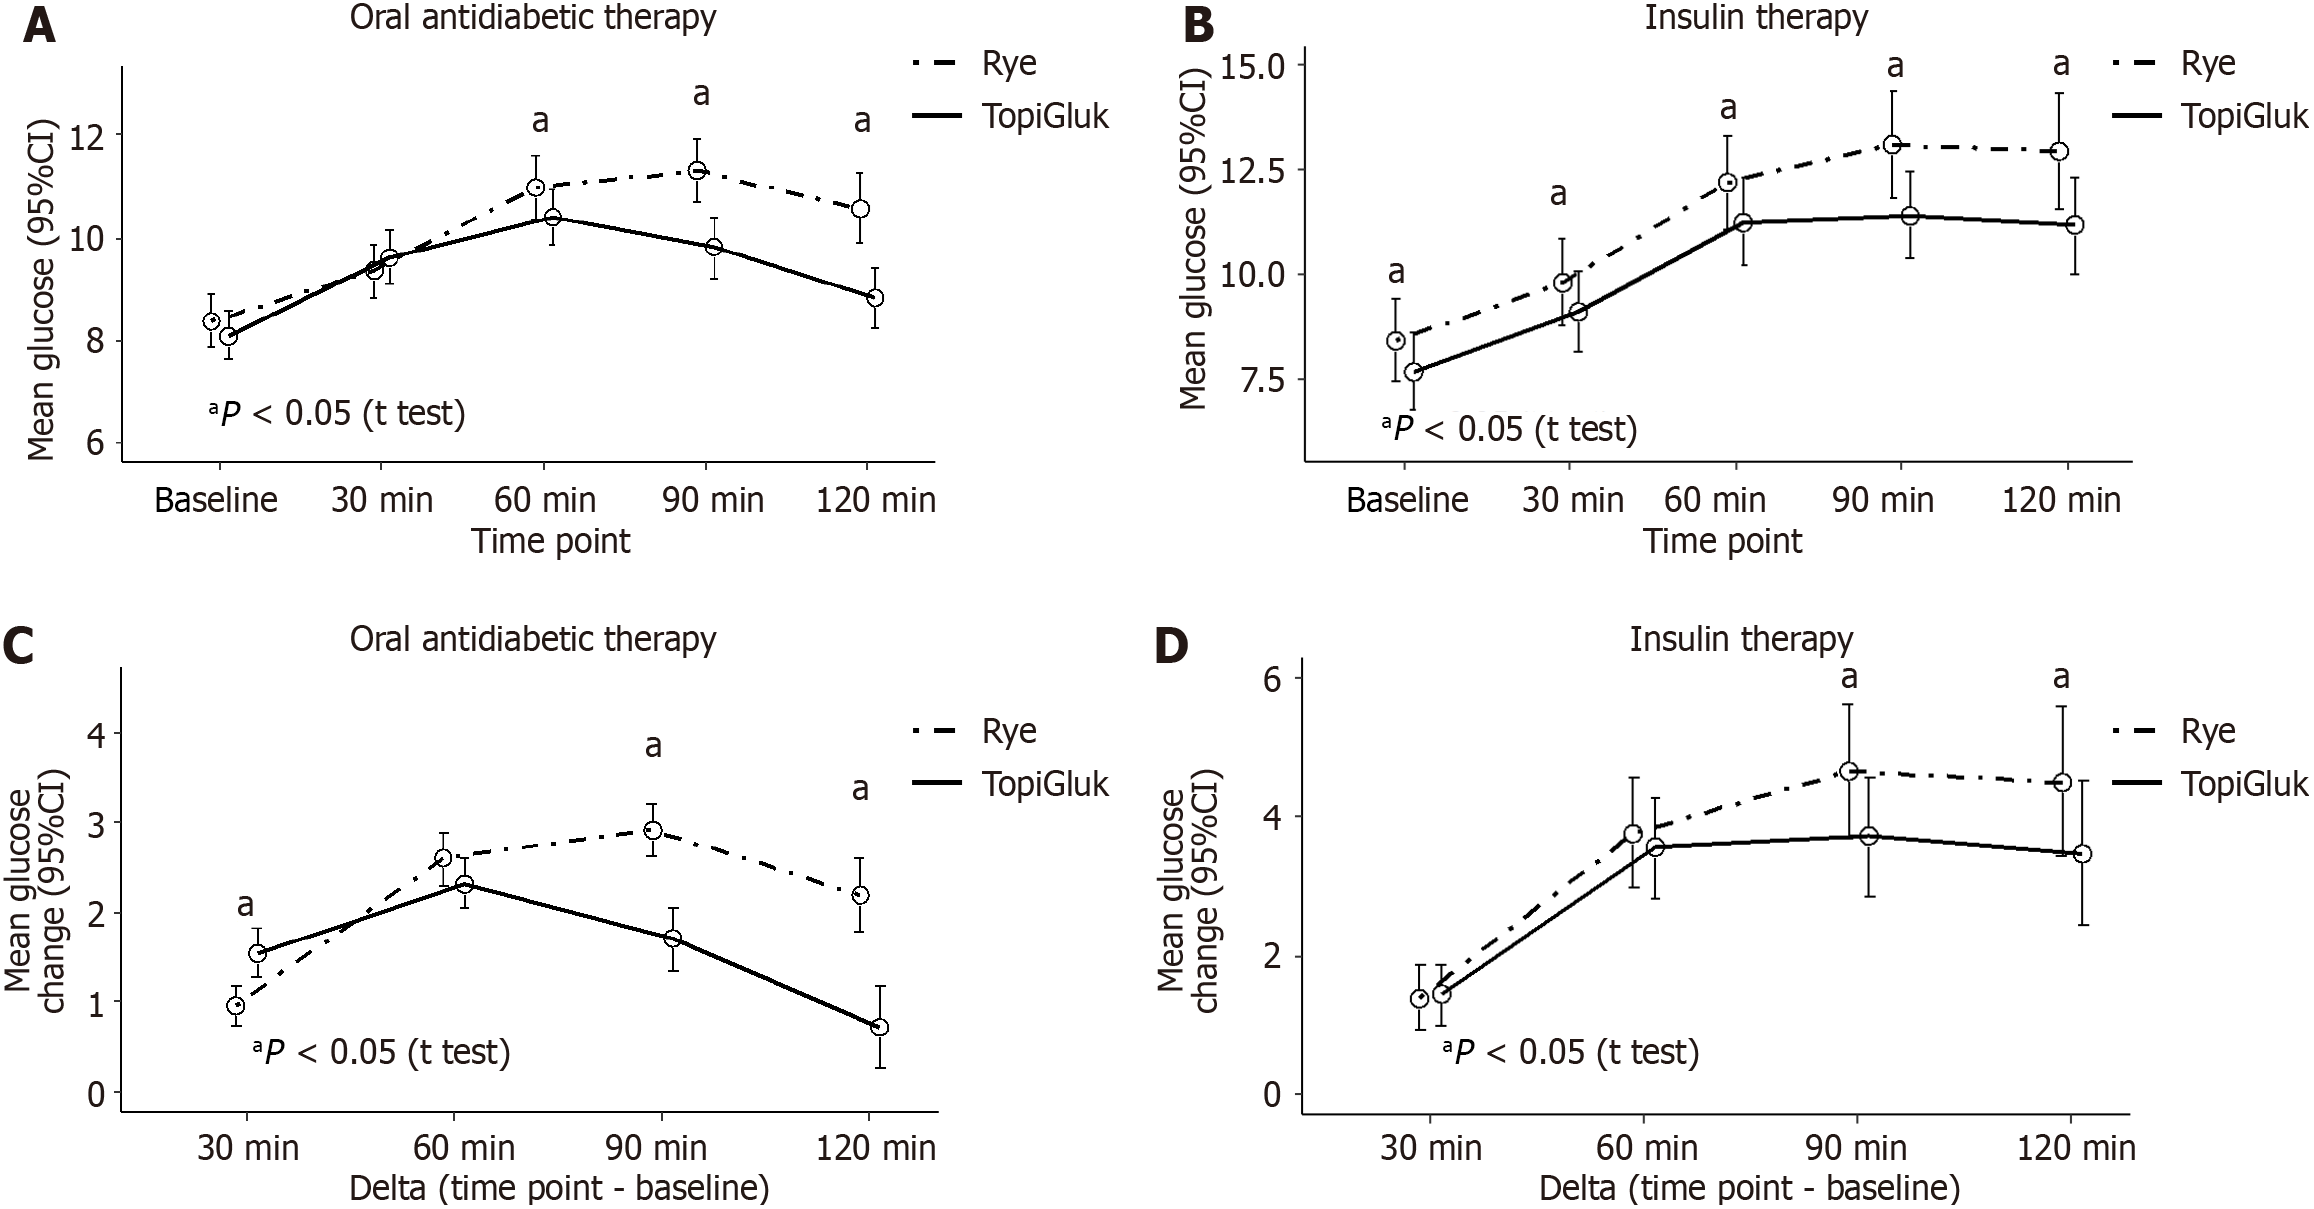
Figure 4 Insulin levels (µIU/L), median (25-75th percentile) and change after the consumption of rye bread and the special type of bread with TopiGluk® in diabetic patients.
A: Absolute values in patients with oral antidiabetic therapy; B: Change compared to baseline in patients with insulin therapy; C: Change compared to baseline in oral antidiabetic therapy patients; D: Change compared to baseline in insulin therapy patients. aP < 0.05.
- Citation: Gostiljac DM, Popovic SS, Dimitrijevic-Sreckovic V, Ilic SM, Jevtovic JA, Nikolic DM, Soldatovic IA. Effect of special types of bread with select herbal components on postprandial glucose levels in diabetic patients. World J Diabetes 2024; 15(4): 664-674
- URL: https://www.wjgnet.com/1948-9358/full/v15/i4/664.htm
- DOI: https://dx.doi.org/10.4239/wjd.v15.i4.664


