Published online Mar 15, 2023. doi: 10.4251/wjgo.v15.i3.546
Peer-review started: November 20, 2022
First decision: December 10, 2022
Revised: December 23, 2022
Accepted: February 23, 2023
Article in press: February 23, 2023
Published online: March 15, 2023
Processing time: 114 Days and 13.6 Hours
Mitophagy plays essential role in the development and progression of colorectal cancer (CRC). However, the effect of mitophagy-related genes in CRC remains largely unknown.
To develop a mitophagy-related gene signature to predict the survival, immune infiltration and chemotherapy response of CRC patients.
Non-negative matrix factorization was used to cluster CRC patients from Gene Expression Omnibus database (GSE39582, GSE17536, and GSE37892) based on mitophagy-related gene expression. The CIBERSORT method was applied for the evaluation of the relative infiltration levels of immune cell types. The performance signature in predicting chemotherapeutic sensitivity was generated using data from the Genomics of Drug Sensitivity in Cancer database.
Three clusters with different clinicopathological features and prognosis were identified. Higher enrichment of activated B cells and CD4+ T cells were observed in cluster III patients with the most favorable prognosis. Next, a risk model based on mitophagy-related genes was developed. Patients in training and validation sets were categorized into low-risk and high-risk subgroups. Low risk patients showed significantly better prognosis, higher enrichment of immune activating cells and greater response to chemotherapy (oxaliplatin, irinotecan, and 5-fluorouracil) compared to high-risk patients. Further experiments identified CXCL3 as novel regulator of cell proliferation and mitophagy.
We revealed the biological roles of mitophagy-related genes in the immune infiltration, and its ability to predict patients’ prognosis and response to chemotherapy in CRC. These interesting findings would provide new insight into the therapeutic management of CRC patients.
Core Tip: We for the first time revealed the biological roles of mitophagy-related genes in the immune infiltration, and its prediction of patients’ prognosis and chemotherapy response in colorectal cancer. These novel findings would provide new insight into the therapeutic management of colorectal cancer patients.
- Citation: Weng JS, Huang JP, Yu W, Xiao J, Lin F, Lin KN, Zang WD, Ye Y, Lin JP. Mitophagy-related gene signature predicts prognosis, immune infiltration and chemotherapy sensitivity in colorectal cancer. World J Gastrointest Oncol 2023; 15(3): 546-561
- URL: https://www.wjgnet.com/1948-5204/full/v15/i3/546.htm
- DOI: https://dx.doi.org/10.4251/wjgo.v15.i3.546
Colorectal cancer (CRC) is one of the most common malignant diseases in the world[1]. Though the past decades have witnessed a great improvement in treatment programs, the 5-year survival for patients with CRC after tumor resection remains poor and approximately 50% of patients will develop distant metastasis[2]. Thus, effective prognostic markers and novel potential therapeutic targets are necessary to help individualize therapy for CRC patients in clinical practice.
AS a specific type of autophagy, mitophagy is essential in eliminating damaged or excessive mitochondria through autophagolysosomes[3,4]. The process of mitophagy is frequently activated under oxidative and energetic stress, which occur frequently during cancer initiation and progression[5-7]. Previous studies have reported the correlation between mitophagy dysregulation and colorectal cancer formation and invasion. Yin et al[8] revealed that the mitophagy protein PTEN induced putative kinase 1 suppresses CRC cell proliferation by rewiring metabolism via activating p53 and reducing acetyl-CoA production. In addition, induction of mitophagy was shown to contribute to drug resistance in CRC stem cells[9]. A recent study showed that in intestinal epithelial cells, adaptive immunity could be activated by mitophagy during CRC initiation, confirming the correlation between mitophagy and anti-tumor immunity in colorectal cancer[10]. Therefore, targeting mitophagy in CRC cells represents a promising anticancer strategy. Therefore, we aimed to reveal the underlying association between mitophagy and prognosis, immune infiltration and the response to chemotherapy in CRC patients by analyzing the transcriptomics of mitophagy-associated genes in CRC comprehensively.
In this study, we analyzed three datasets (GSE39582, GSE17536, and GSE37892) from the GEO database to elucidate the pattern of mitophagy in CRC. Three mitophagy-related phenotypes in CRC were identified. A prognostic signature was established to quantify the death risk, immune infiltrating characteristics and therapeutic response. Our findings may provide new insights for treatment strategies in CRC based on the mitophagy-related gene signatures.
GSE39582, GSE17538, and GSE37892 microarray datasets were retrieved from the GEO database, whose website is https://www.ncbi.nlm.nih.gov/geo/. The three abovementioned datasets were generated using the Affymetrix HG-U133 plus 2.0 platform and the Robust Multichip Average method was used to perform data normalization. When multiple datasets were combined as a whole cohort, the ComBat method was used to remove the batch effects. This method was executed in the SVA R package (version 3.2.1).
The inclusion criteria for dataset selection were: (1) All datasets were generated using the Affymetrix platform (Affymetrix HG-U133 plus 2.0); (2) sample size > 100; (3) patients were pathologically diagnosed with colorectal cancer; (4) basic clinical information for patients was available for analysis; and (5) patients had complete follow-up information. Based on the inclusion criteria, the CRC datasets GSE39582, GSE17538 and GSE37892 were included in this study. The three datasets were combined together and randomly separated into training sets and validation sets at a ratio of 1:1.
the Gene Set Enrichment Analysis (http://www.gsea-msigdb.org/gsea/index.jsp) and h GeneCards (https://www.genecards.org/) were utilized to generate a total of 51 genes related to mitophagy. The gene list is shown in Supplementary Table 1.
We performed consensus clustering “Nonnegative Matrix Factorization (NMF)” with the nrun parameter being set to 50 for CRC patients classification based on the expression levels of mitophagy-related genes[11,12]. This procedure was performed using the “NMF” package in R (version 0.24.0).
Based on gene expression data, Gene set variation analysis (GSVA) has been widely used to evaluate the activity of signaling pathways via the unsupervised method. The “GSVA” R package (version 1.42.0) was used to quantify the activity of the signaling pathways in each patient. For GSVA processing, the MSigDB database (https://www.gsea-msigdb.org/gsea/index.jsp) was used to download gene set information.
We performed a CIBERSORT deconvolution approach to evaluate the relative abundance of 22 tumor-infiltrating immune cells, which included naïve B cells, naïve T cells, memory B cells, activated CD4+ memory T cells, plasma cells, resting CD4+ memory T cells, CD8+ T cells, regulatory T cells (Tregs), CD4+ T cells, activated NK cells, follicular helper T cells, resting NK cells, gamma delta T cells, activated mast cells, activated dendritic cells, monocytes, M2 macrophages, M0 macrophages, resting mast cells, M1 macrophages, resting dendritic cells, neutrophils, and eosinophils in each CRC sample[13].
To develop the mitophagy-related prognostic gene signature, we overlapped differentially expressed genes (DEGs) of each cluster identified by “NMF” function to explore the mitophagy related gene expression pattern. The DEGs were identified by lusing LIMMA package (version 3.26.9). Then univariate Cox regression analysis was adopted to identify those significantly associated with overall survival. Next, the least absolute shrinkage and selection operator method (LASSO) Cox regression model was carried out at 10-fold cross-validation to identify the most meaningful mitophagy related genes[14]. The LASSO Cox model was perfomed by lusing glmnet package (version 2.0.5). Finally, the gene signature was established based on selected 36 target genes to calculate risk_score, which was calculated as follows: Risk_score = Σ (Expi × coefi).
Based on the median value of individual risk score, the patients in the training and validation sets were categorized into low and high-risk groups and a Kaplan-Meier survival analysis was conducted to analyze survival difference. The subsequent survival receiver operator characteristic (ROC) as utilized for the evaluation of the prognostic accuracy of the gene signature.
We trained our prognostic signature in pharmacogenomics database (Genomics of Drug Sensitivity in Cancer, https://www.cancerrxgene.org/) to compare the difference of chemotherapeutic sensitivities between low and high-risk patients. The R package “pRRophetic” (version 0.5) was used to conduct the prediction procedure and a ridge regression model was used to estimate the IC50 value of each chemotherapeutic drug.
All statistical analysis was performed based on R (version 4.1.2). A Wilcoxon rank-sum test was carried out for data displaying a skewed distribution. A Student’s t-test was performed for data with a normal distribution to compare the differences between groups. A Kruskal-Wallis test was adopted to compare the differences between the three groups. A P value < 0.05 was considered to be significant statistically.
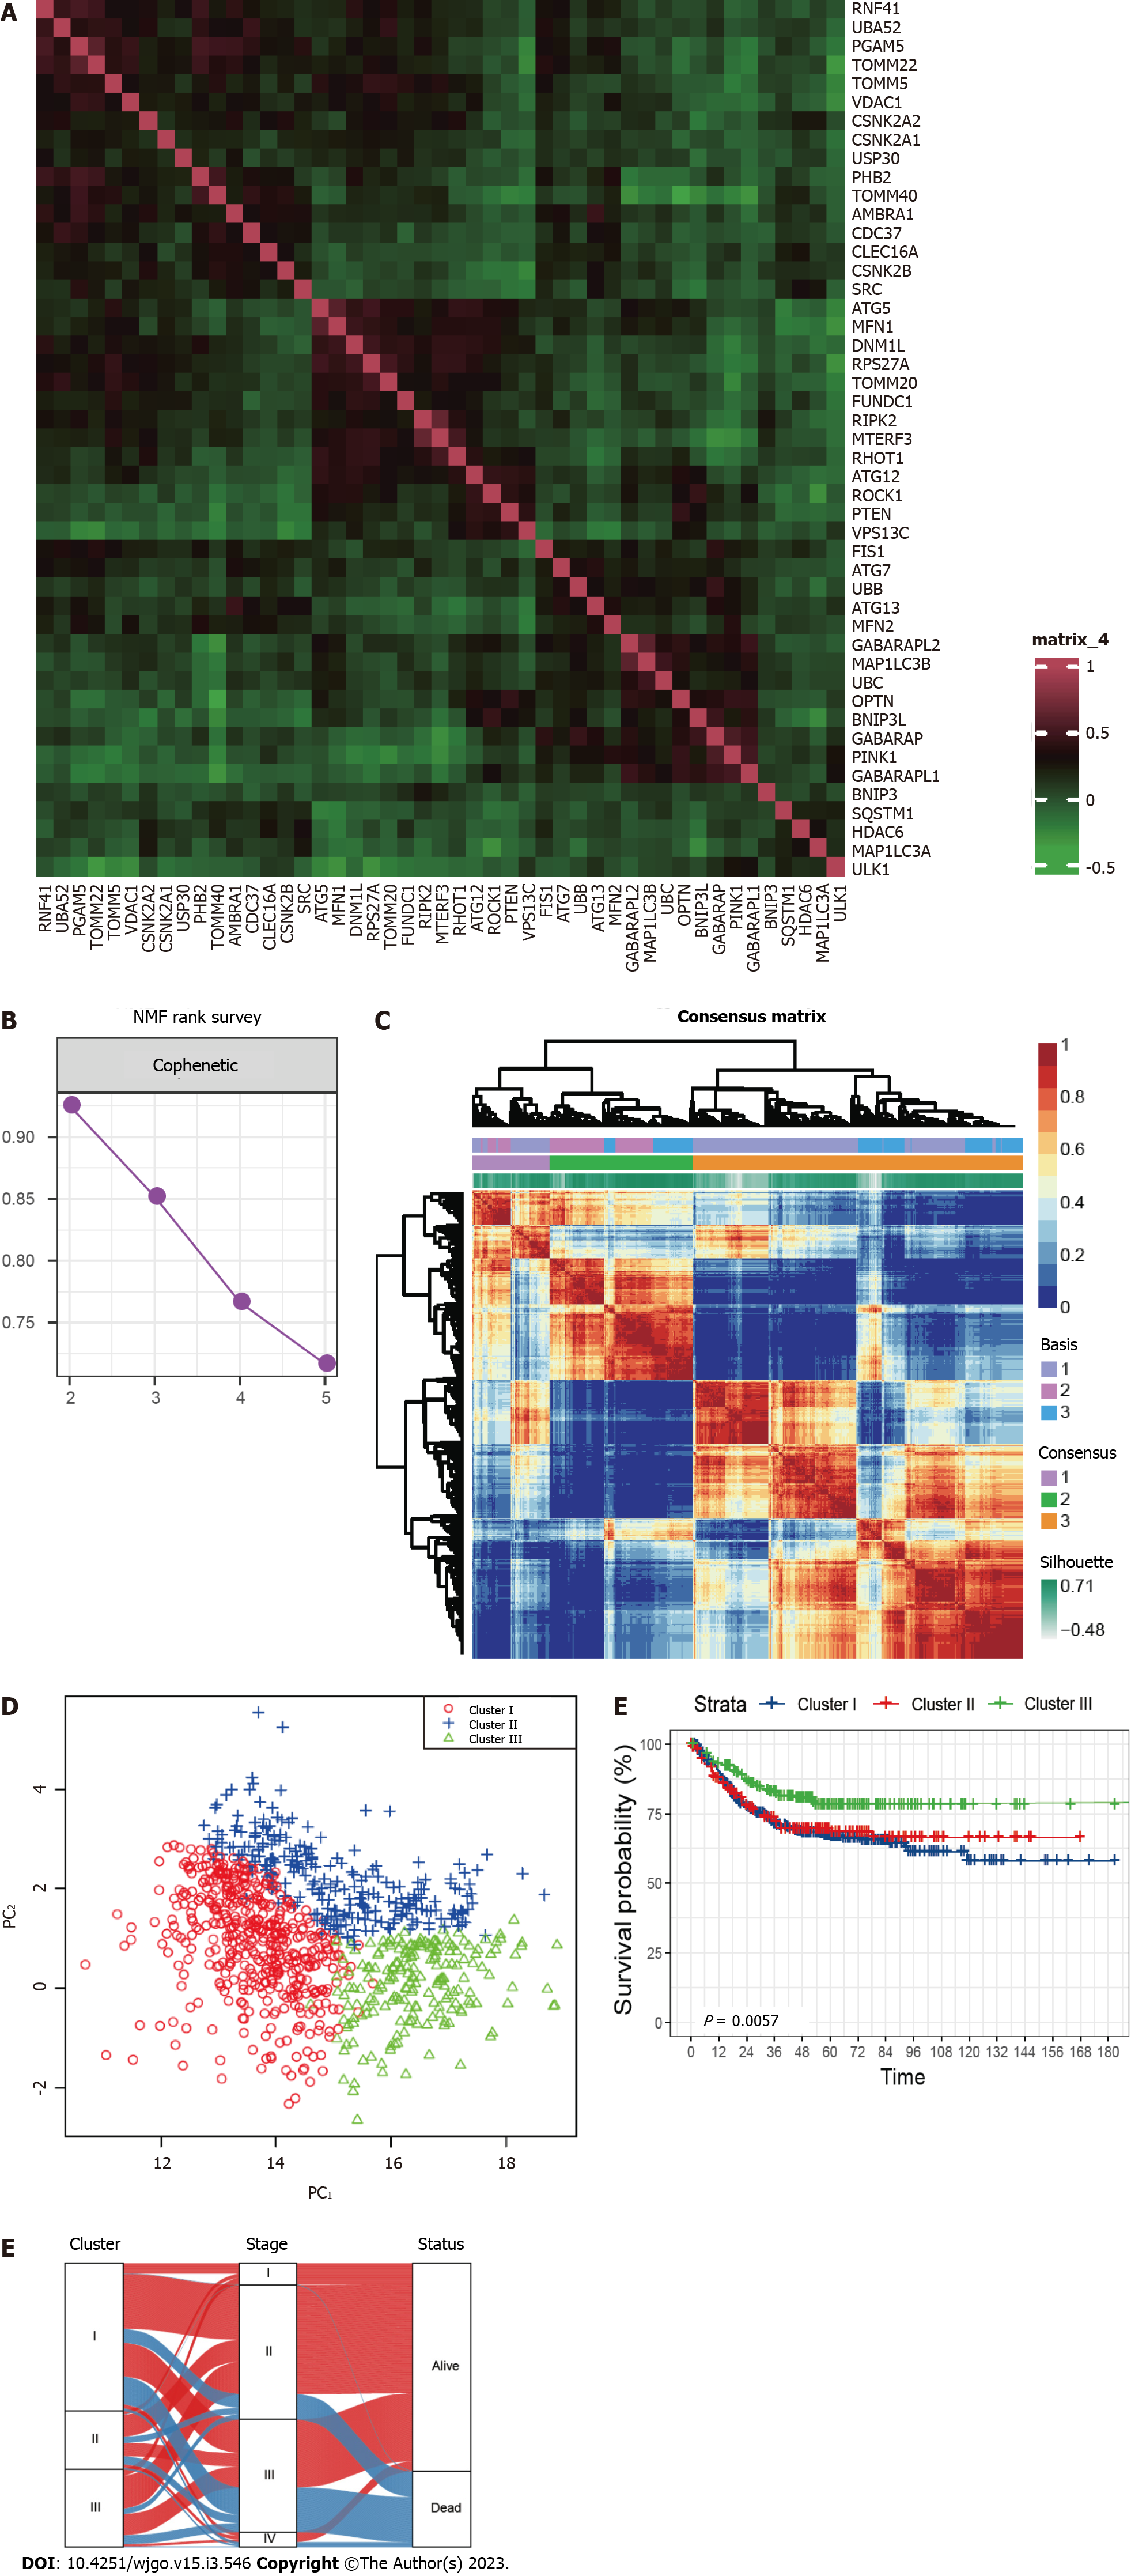
A total of 836 CRC patients from the three GEO datasets were identified in this study. The expression correlation among mitophagy-related genes was shown in Figure 1A and survival analysis found that 18 of them were prognostic for CRC (Supplementary Table 2). To further characterize the expression profiling patterns mediated by mitophagy in CRC, we used the “NMF” method and stratified patients into three clusters based on the optimal clustering number (Figure 1B and C). 435 samples were grouped in cluster I, 172 samples in cluster II, and 229 samples in cluster III. The three clusters could be notably discriminated according to PCA analysis (Figure 1D). Survival analysis showed that patients in cluster III exhibited the best prognosis (Figure 1E; P = 0.0057). Further correlation analysis did not observe significant connection between Cluster III and early stage of CRC, suggesting that this identified molecular cluster may be an independent prognostic factor (Figure 1F).
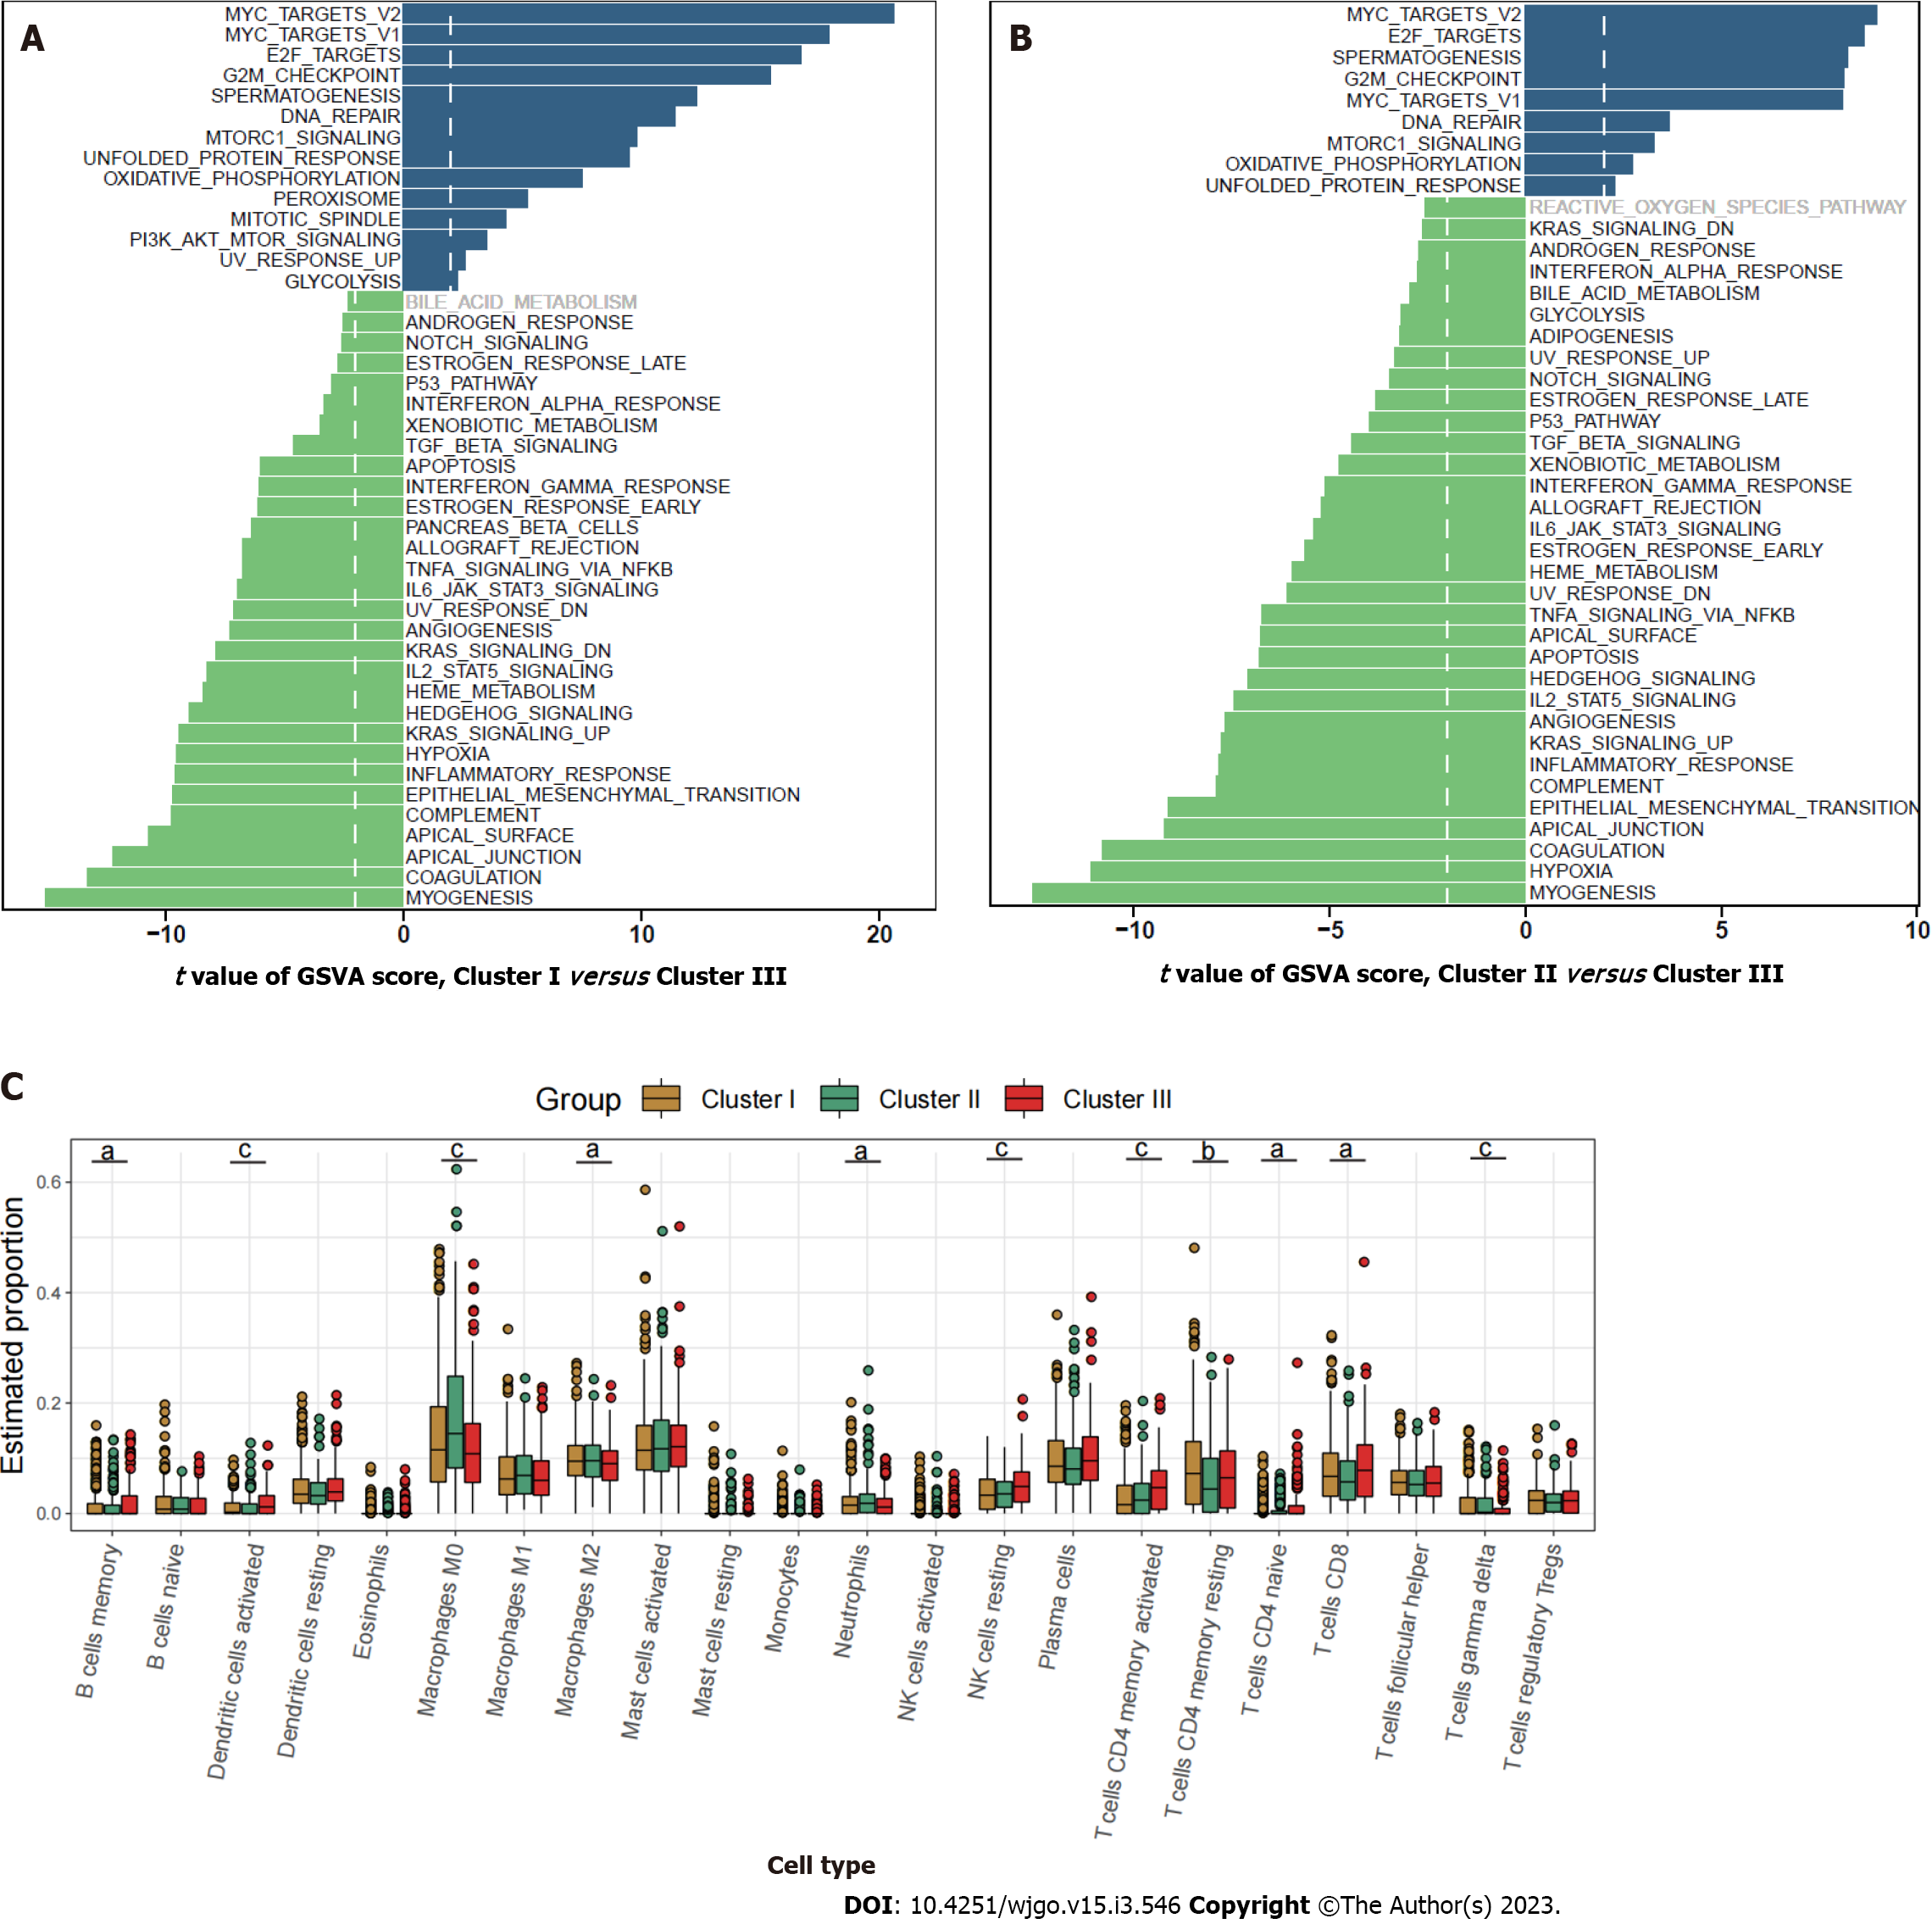
Pathway enrichment analysis based on GSVA showed that the metastasis related pathways, such as epithelial mesenchymal transition, KRAS signaling, myogenesis, coagulation, and angiogenesis were mainly enriched in cluster I and cluster II compared to cluster III (Figure 2A and B). To further characterize the immune infiltration among the three clusters, we employed CIBERSORT[15] analyses and found that activated dendritic cells, memory B cells, and activated memory CD4+ T cells (Figure 2C) were predominantly enriched in cluster III.
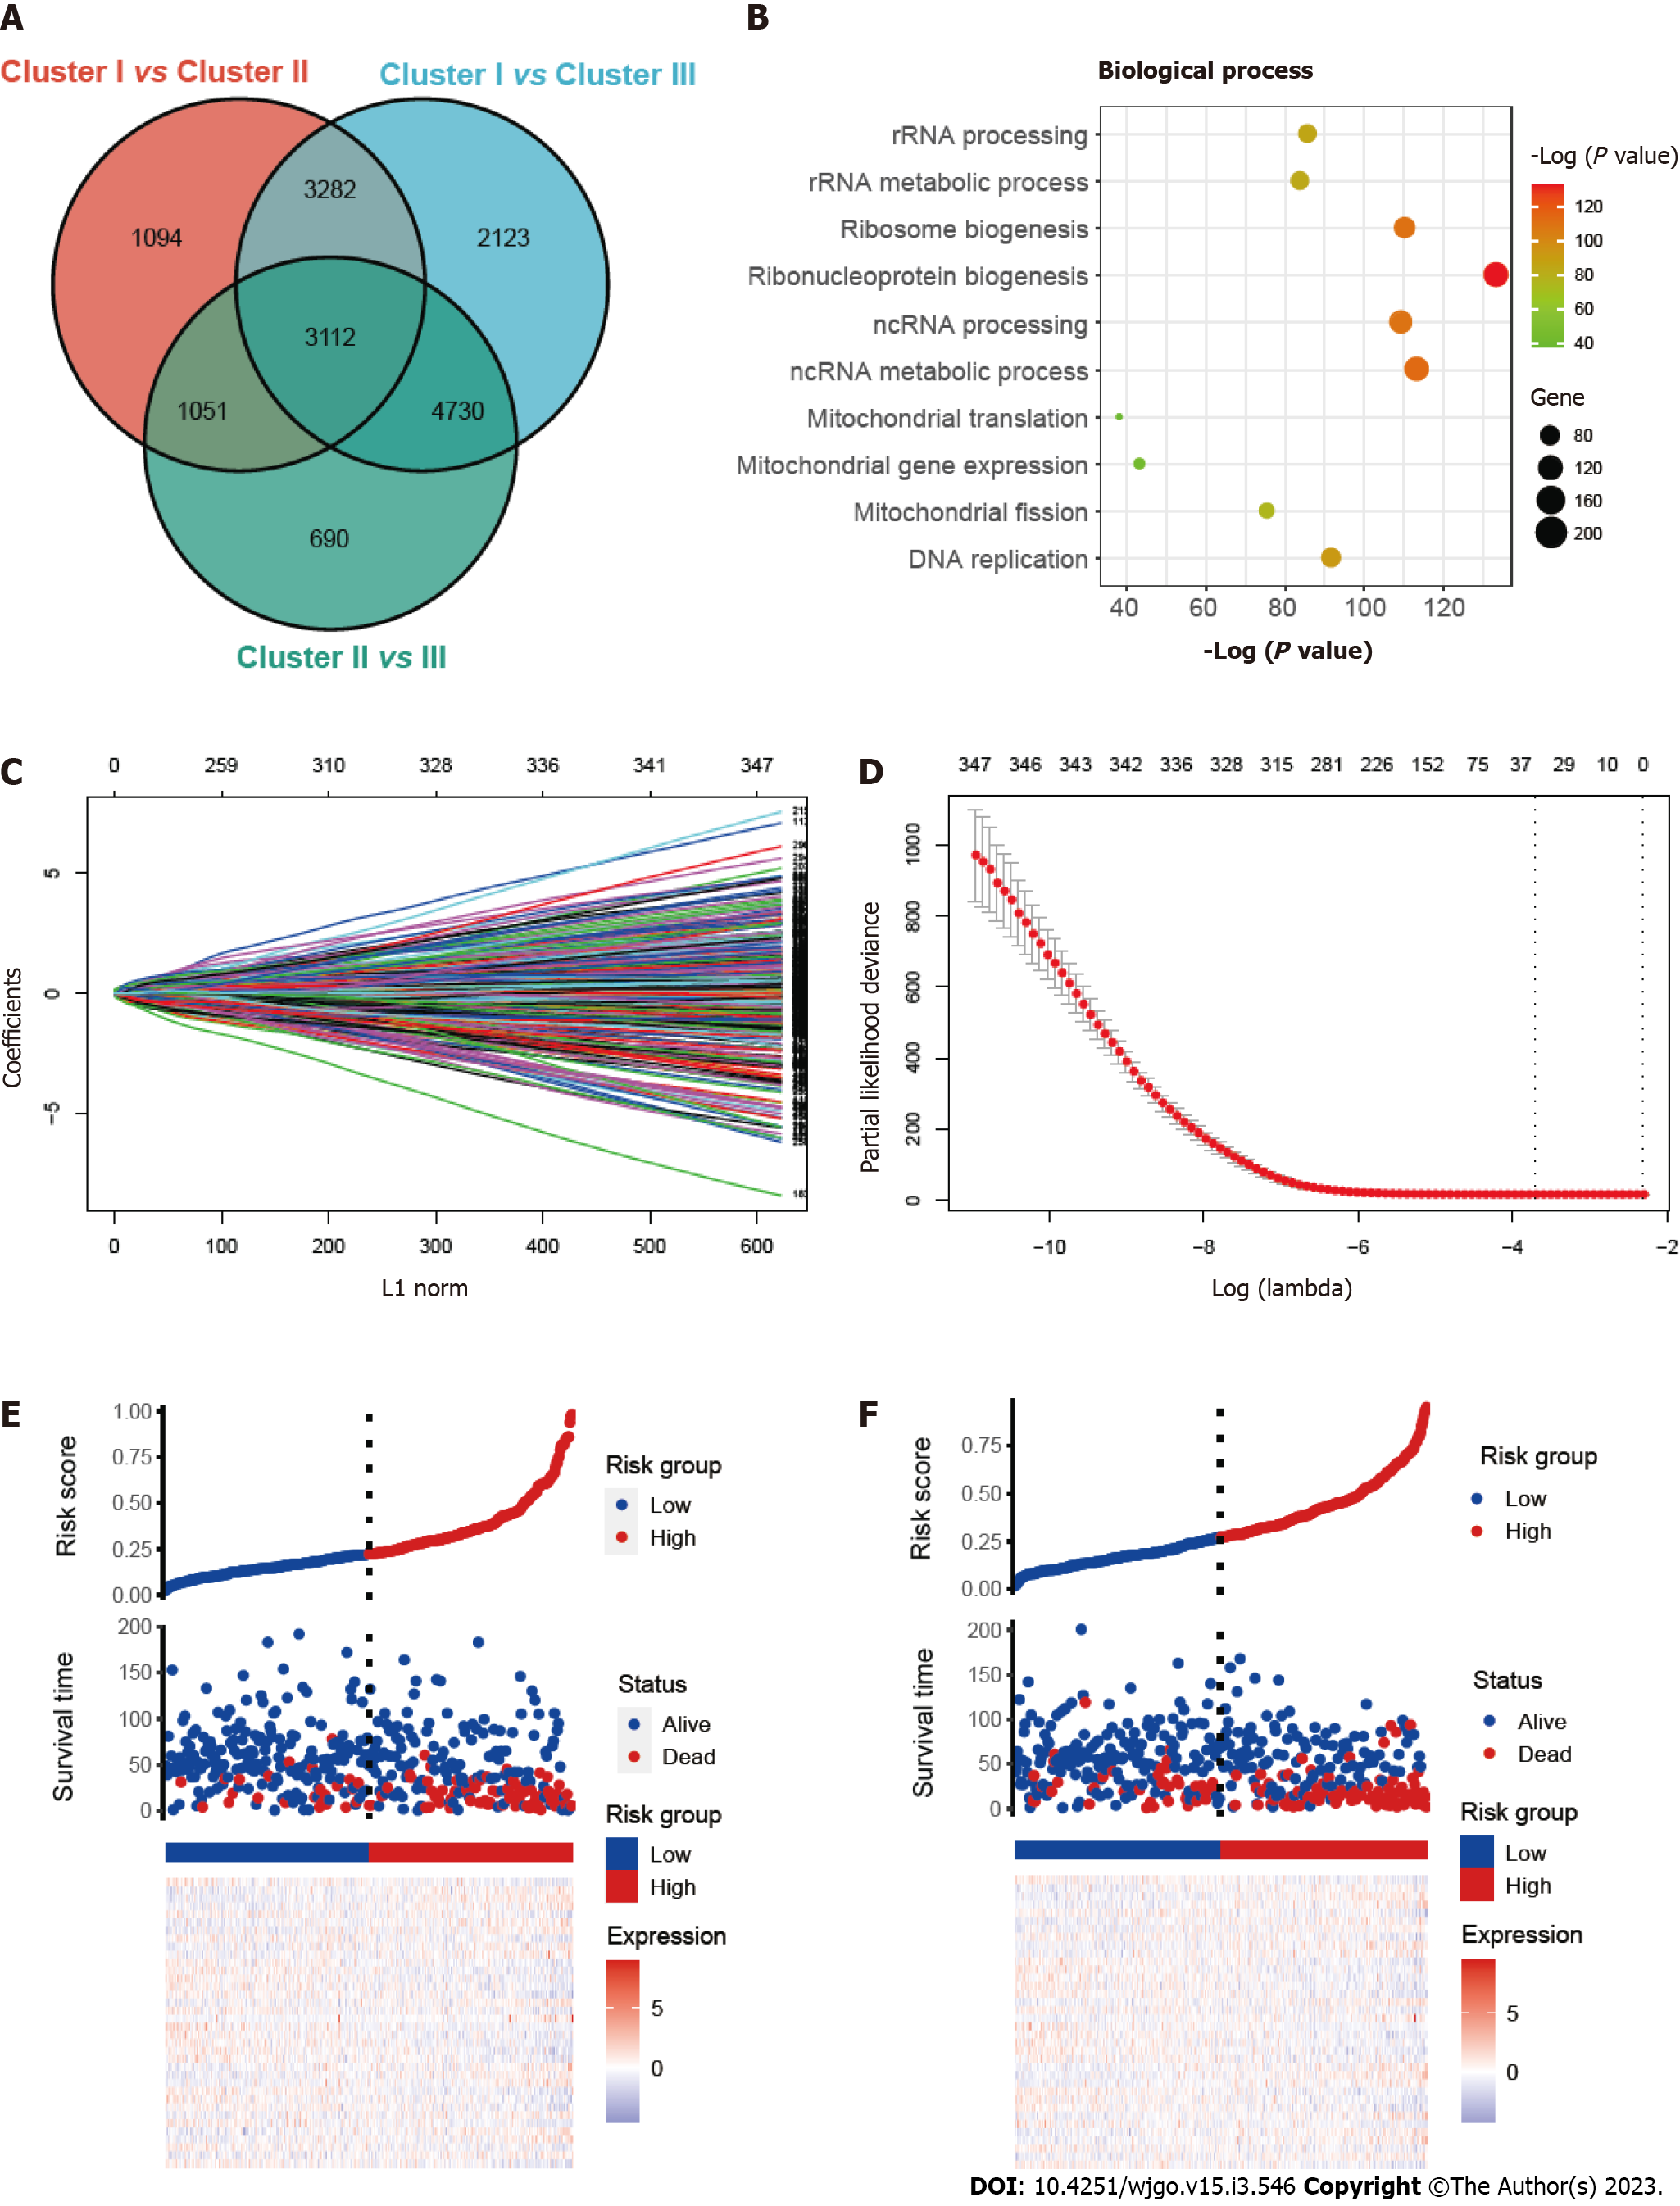
To investigate the prognostic prediction of mitophagy-related genes, we overlapped the DEGs of three clusters and obtained a total of 3112 genes (Figure 3A). Further GO enrichment indicated that these genes were associated with mitochondrial biological function, including mitochondrial gene expression (Figure 3B). Next, univariate Cox analysis was performed and we found 347 prognostic genes with a P value < 0.001 (Supplementary Table 3). The least absolute shrinkage and selection operator (LASSO) regression model was applied to the training set and the minimize λ method resulted in 36 mitophagy-related DEGs (Figure 3C and D). The risk score of each patient was then calculated for the training set based on the established formula. The coefficients of the selected 36 mitophagy-related DEGs were shown in Table S4. Basing on the median risk score, we separated the patients in the training set into low-risk (n = 209) or high-risk (n = 209) groups. The distribution patterns of risk scores and patients’ survival status were shown in Figure 3E and it was noticed that the risk of death increased gradually with the incremental risk scores. The same analyses were then conducted in the validation set and a similar distribution was found (Figure 3F).
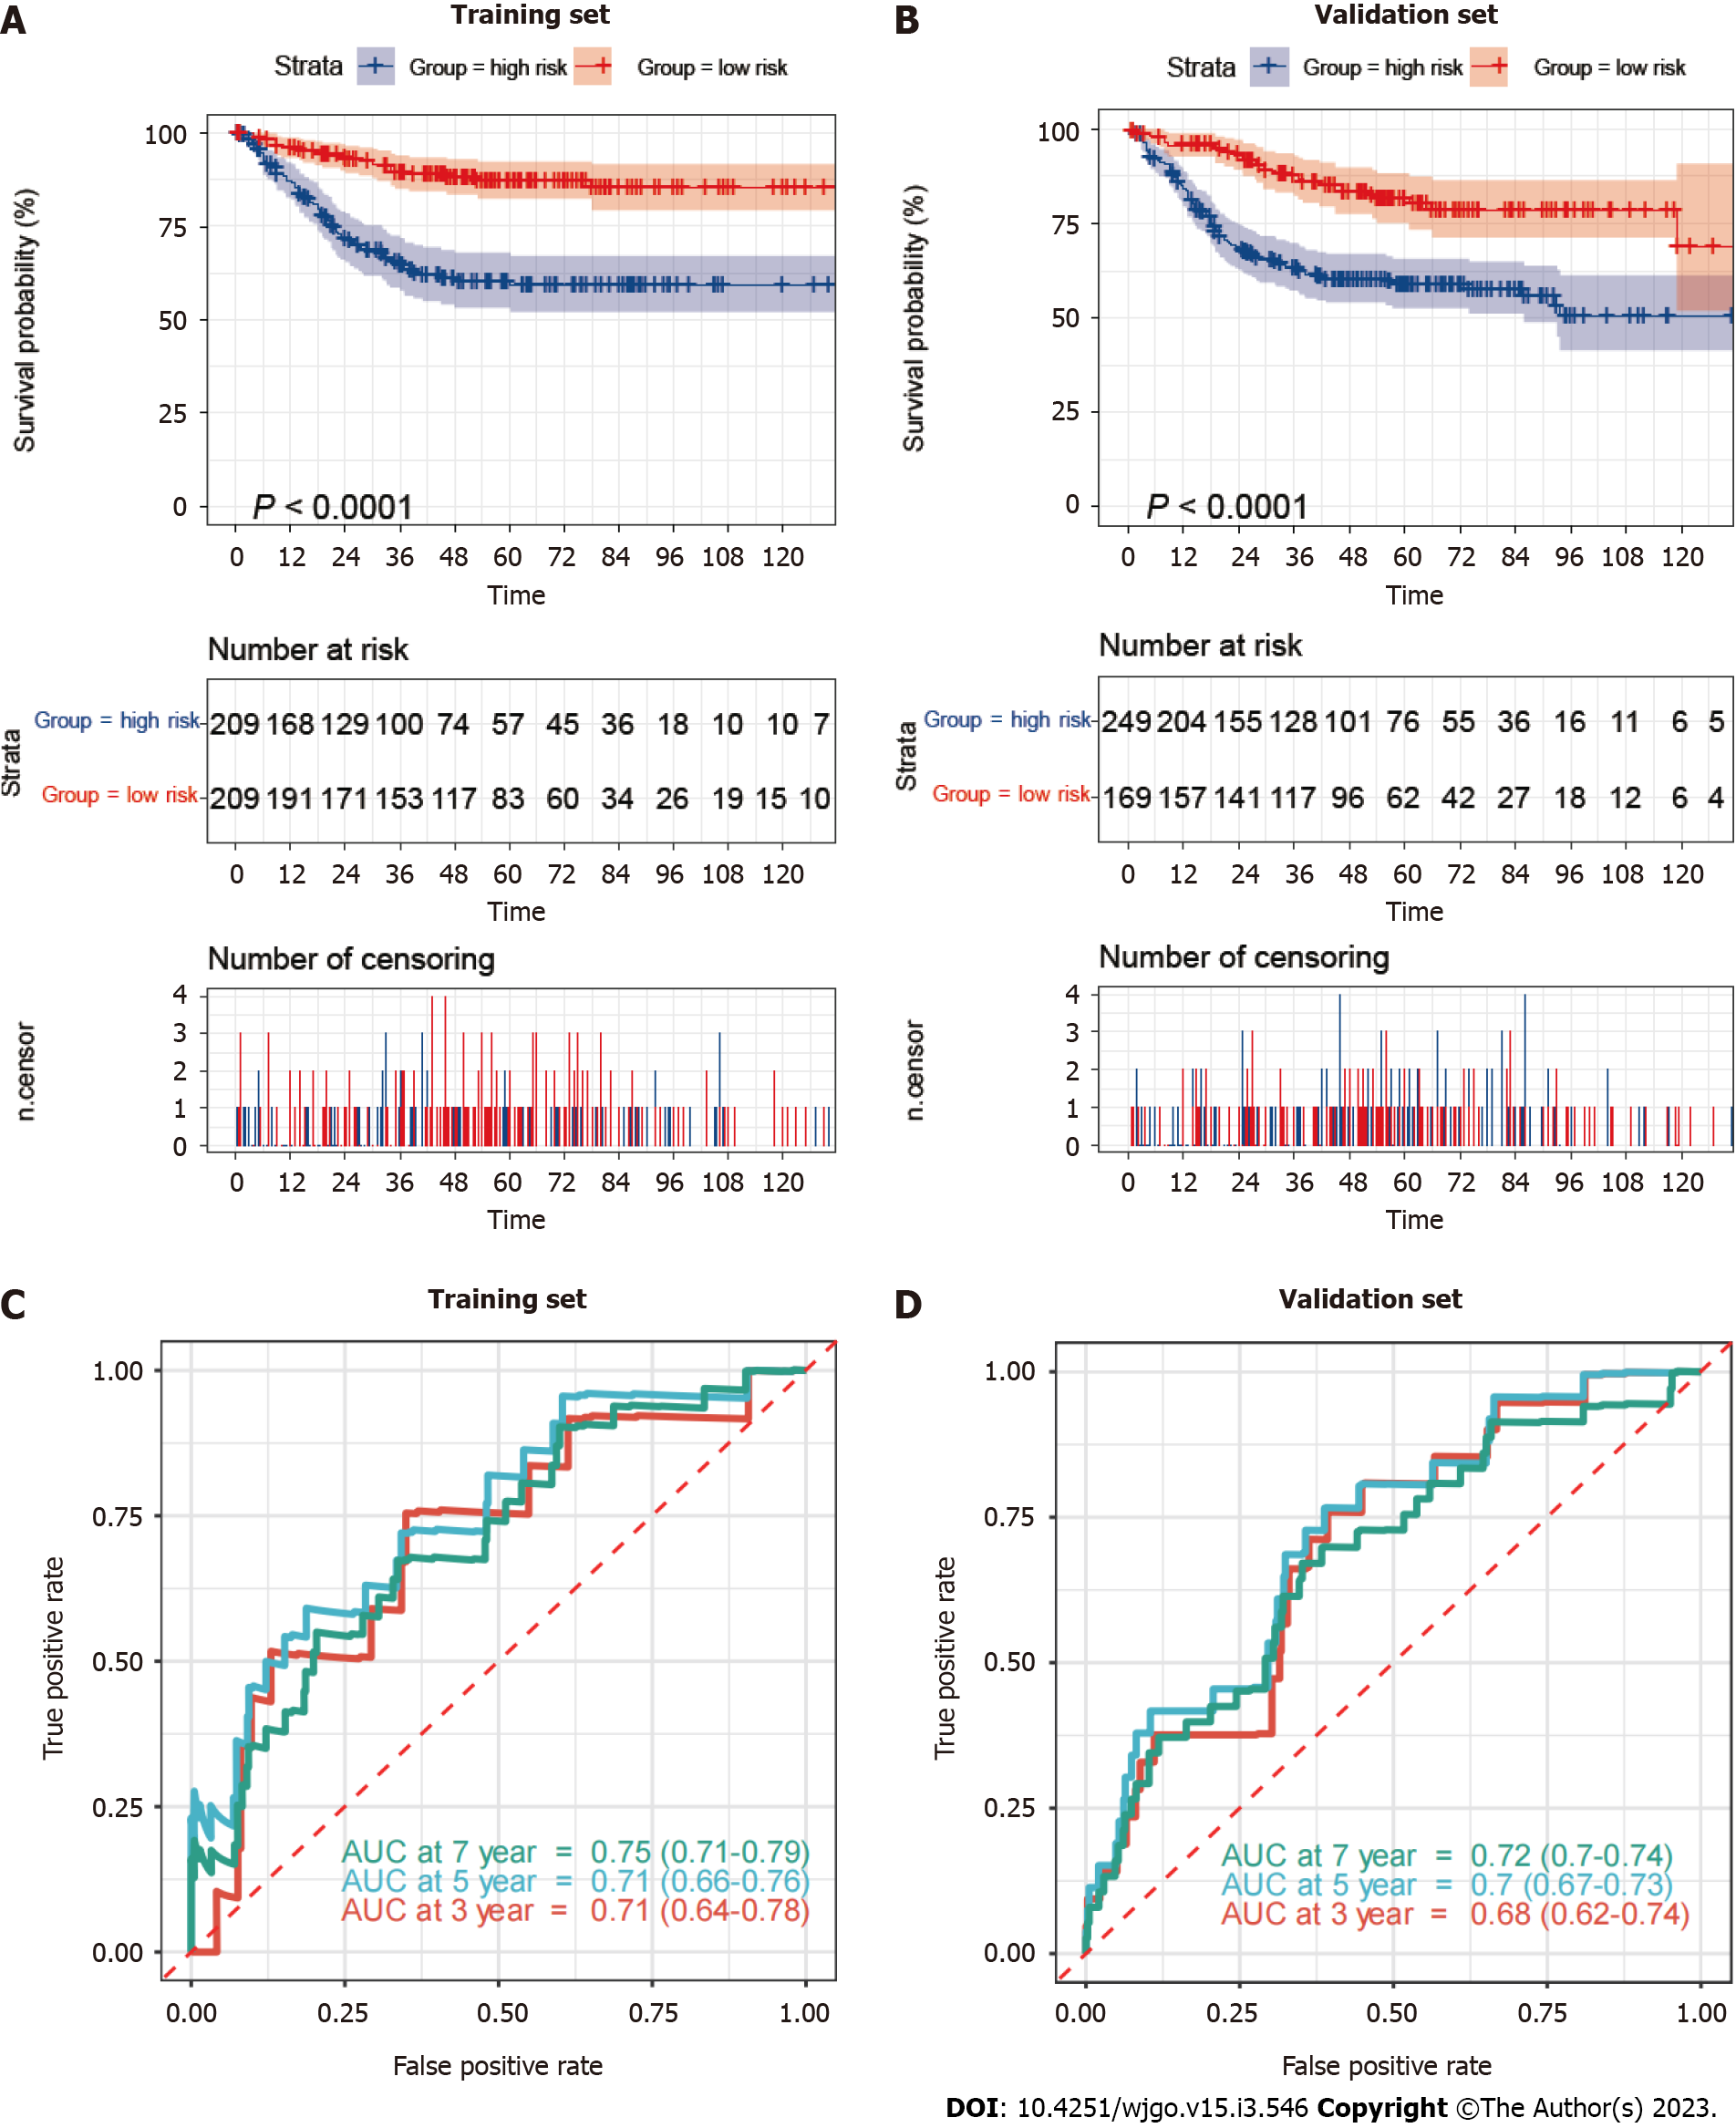
Based on the median mitophagy risk score, we explored patients’ survival rates between the low- and high-risk groups. We observed that high-risk patients showed a significantly worse survival rate than low risk patients in both training (Figure 4A) and validation sets (Figure 4B). Next, we calculated the area under the curve (AUC) values of survival rates in two cohorts. The results showed that the 5-year AUC values all reached 0.7 in the training (Figure 4C) and validation sets (Figure 4D).
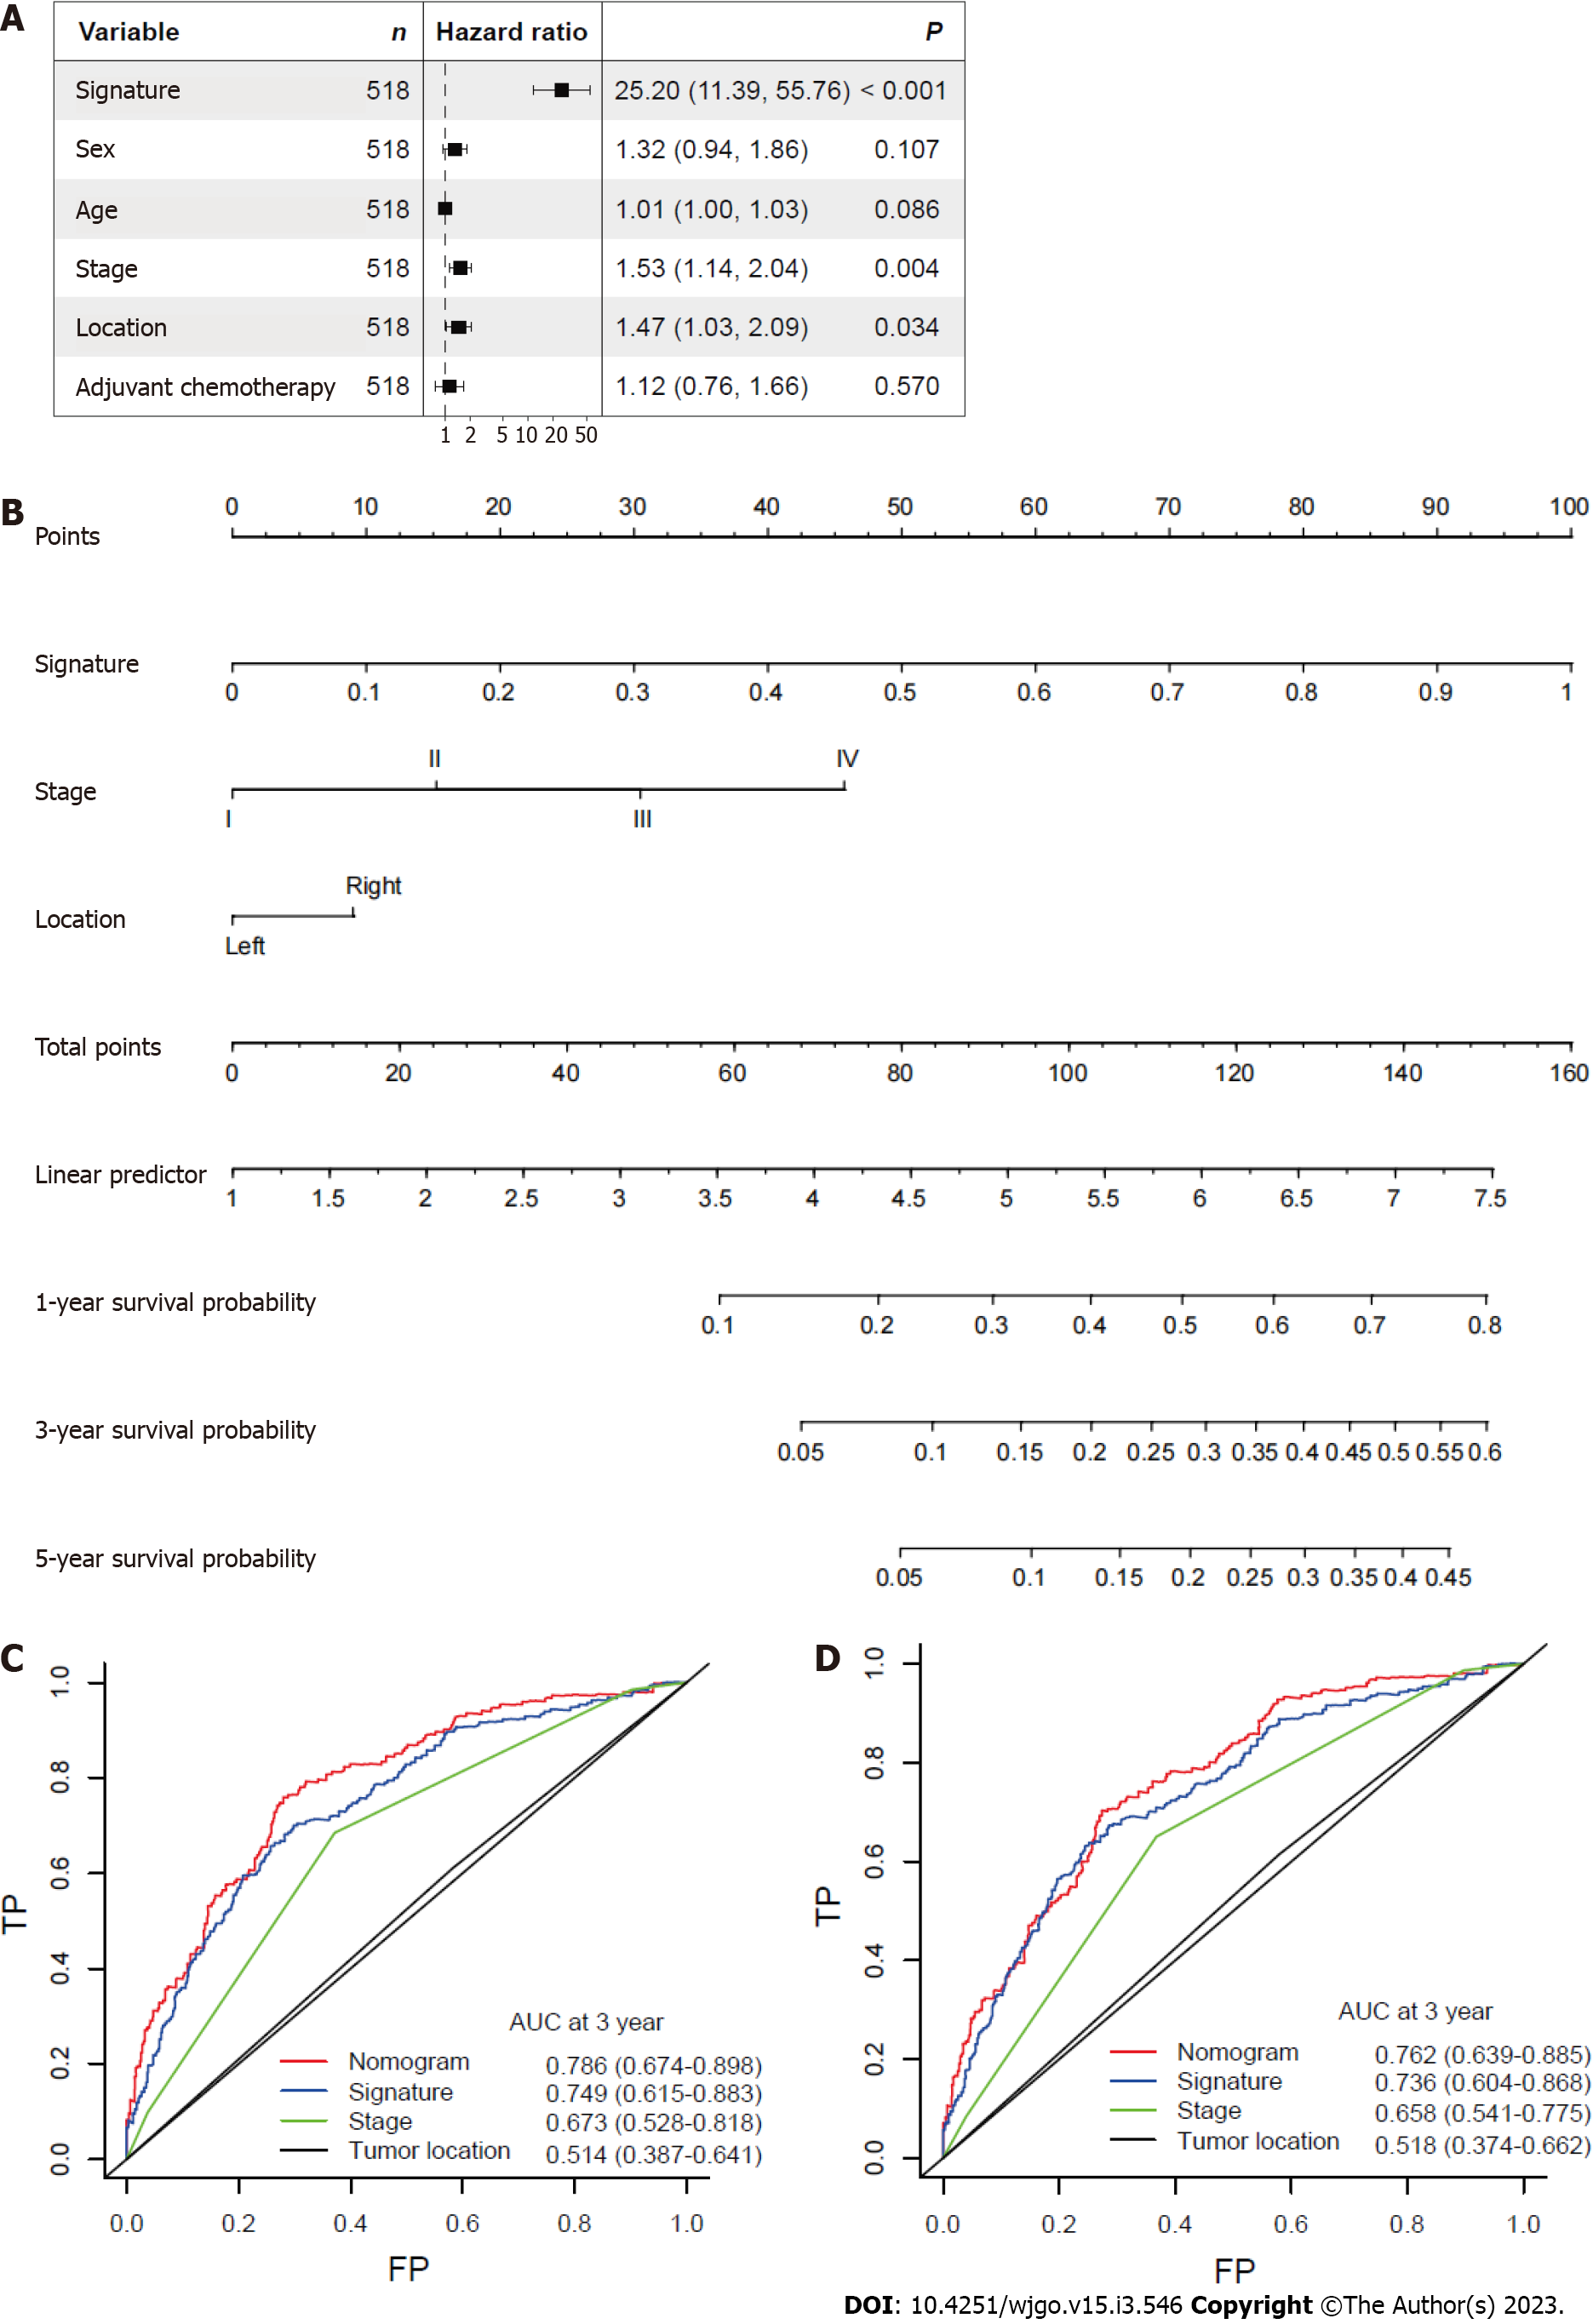
After other clinicopathological parameters were adjusted, the mitophagy-related gene signature remained an independent prognostic factor in the whole cohort (Figure 5A). To further facilitate the clinical use of prognostic signatures, a nomogram was developed based on the multivariate result (Figure 5B). The mitophagy-related gene signature, TNM stage and tumor location were integrated into nomogram. The developed nomogram exhibited outstanding prognostic accuracy and displayed superior performance compared to any other factors alone in predicting survival (Figure 5C and D).
To further externally validate the prognostic and predictive value of the establised mitophagy-related gene signature, CRC patients were identified from TCGA database. Consistent with the result in training and internal validation sets, the risk of death increased gradually with the incremental risk scores in TCGA cohort (Supplementary Figure 1A). By applying the prognostic signature in TCGA cohort, it was found that patients were successfully separated into two groups with significantly different overall survival (Supplementary Figure 1B). In addition, survival ROC showed that the developed mitophagy-related gene signature performed good in predicting prognosis (5-year AUC = 0.72, Supplementary Figure 1C).
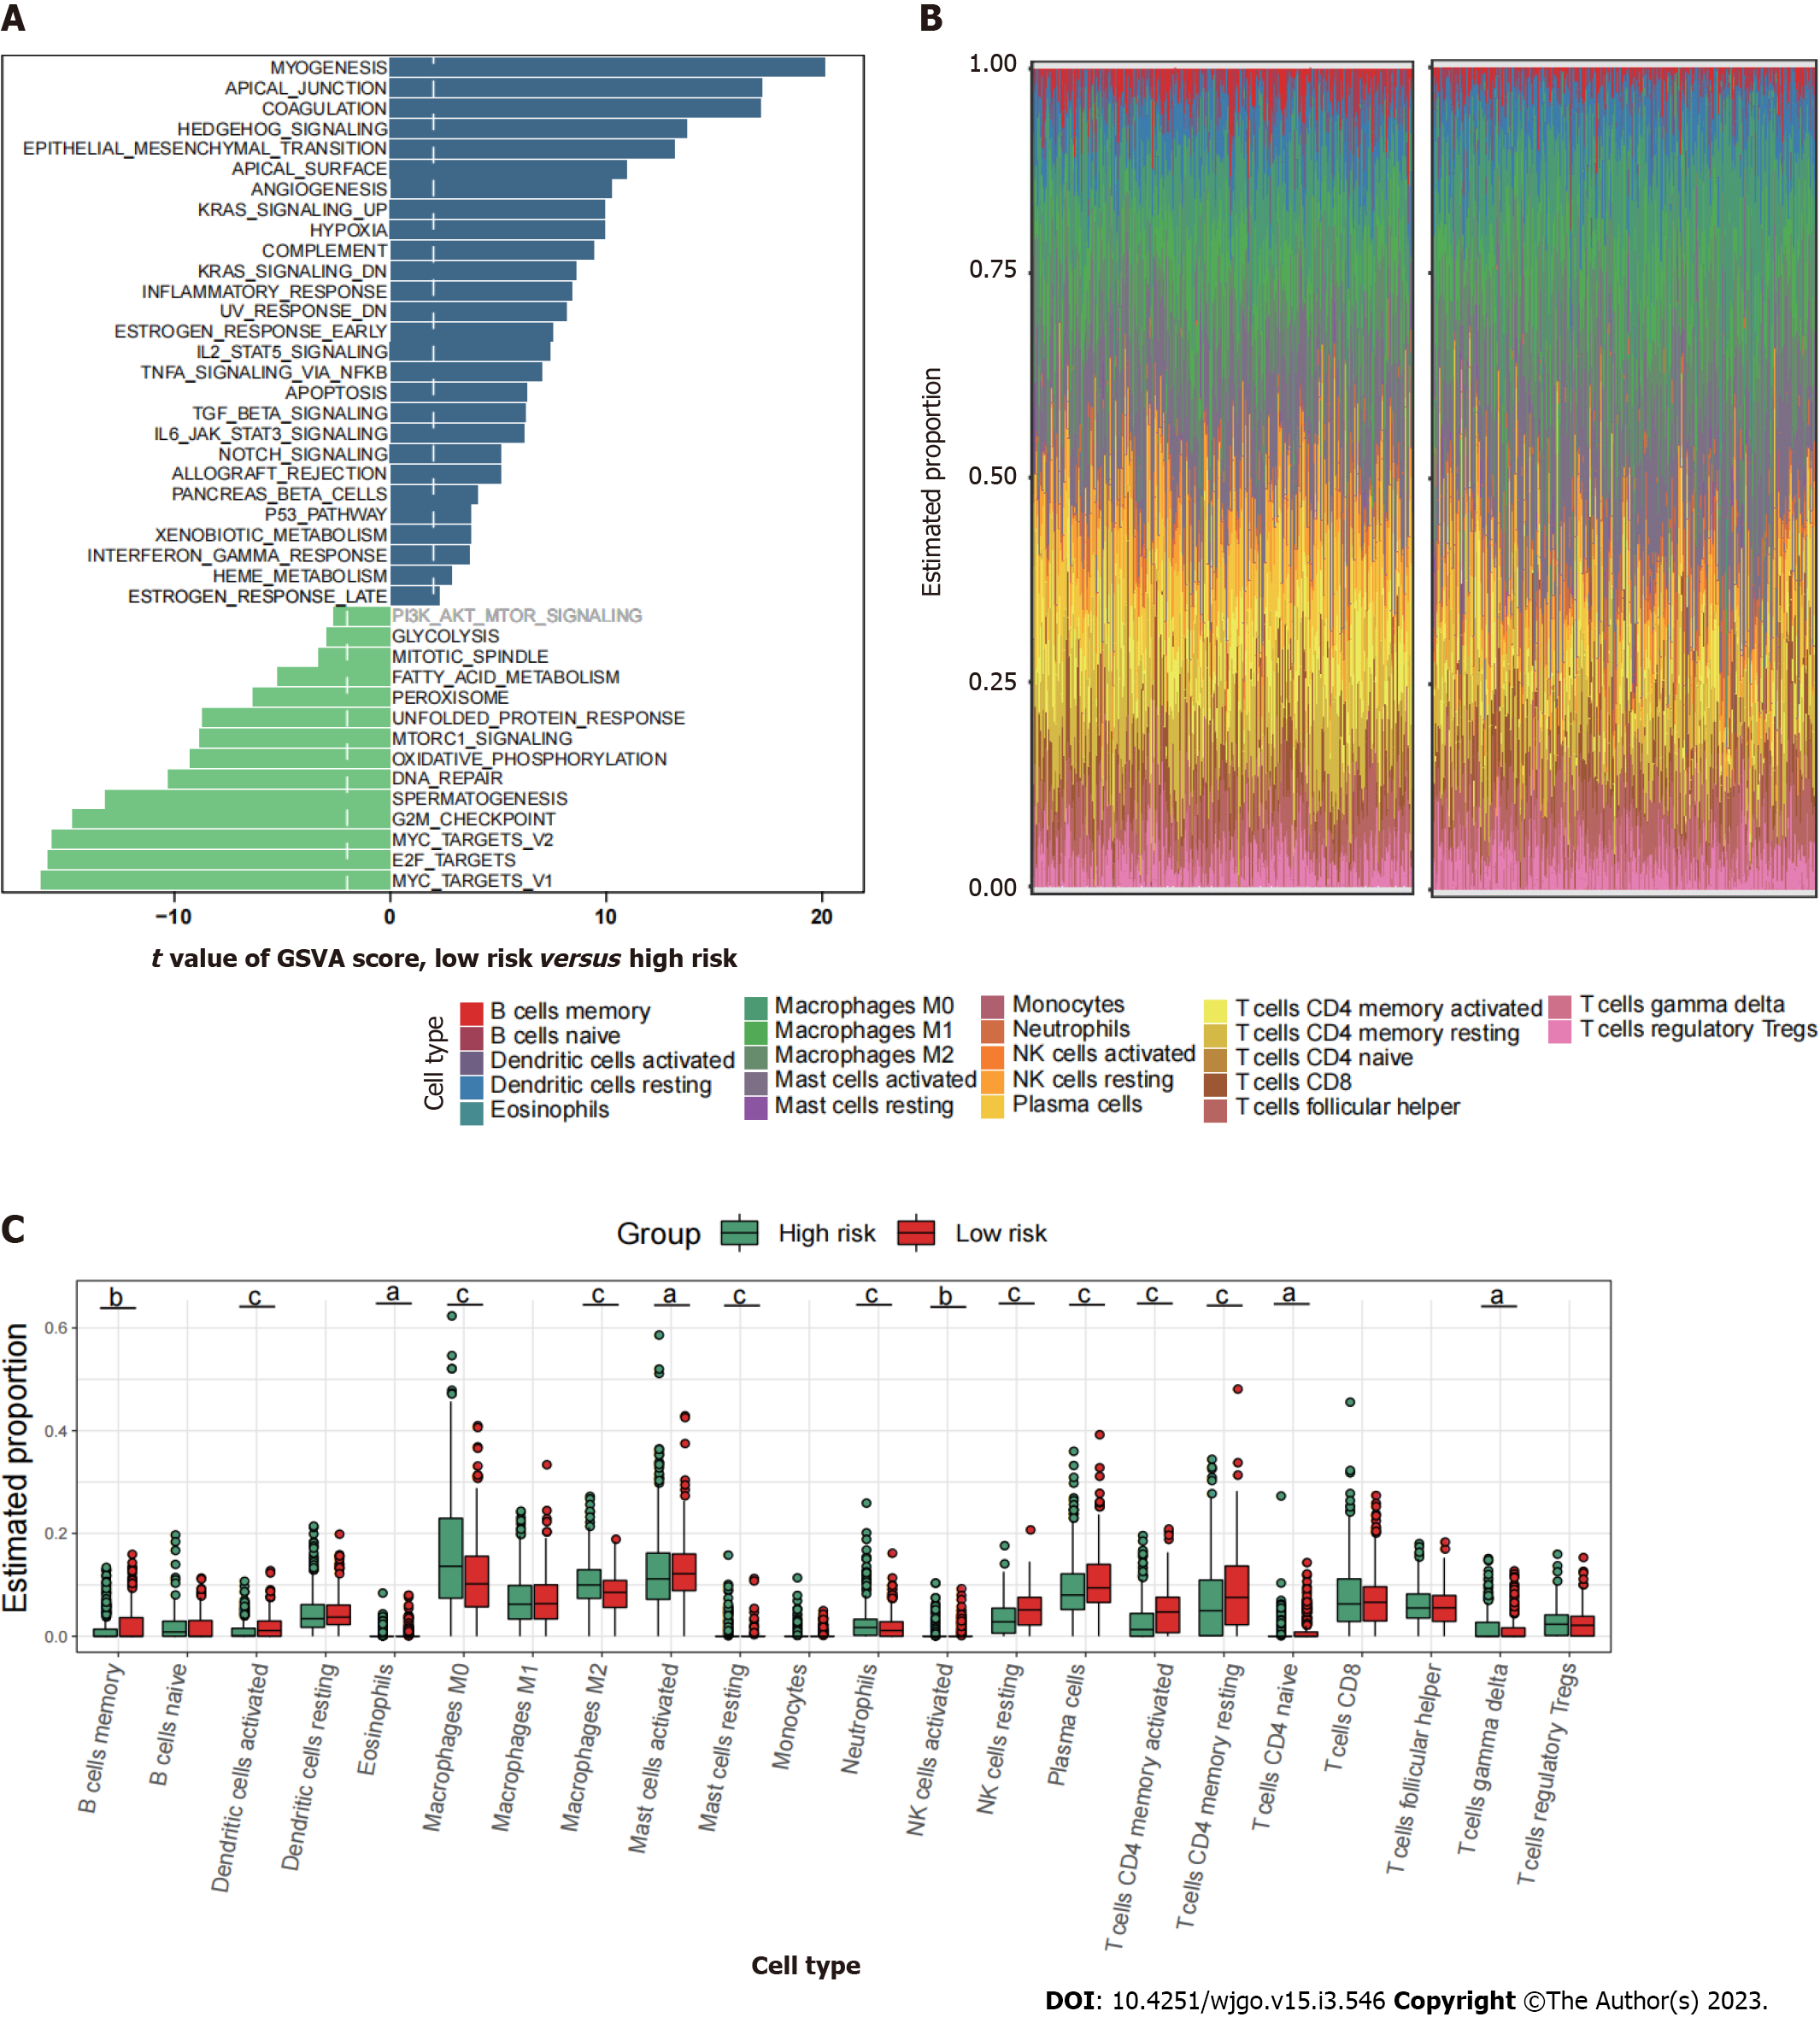
Since mitophagy-related gene signatures exhibited good predictive value in predicting survival, we next evaluated the pathway enrichment and immune infiltration patterns in patients from the high- and low-risk groups. The GSVA analysis showed that several important metastasis-related pathways, including epithelial mesenchymal transition, myogenesis, coagulation and angiogenesis were mainly enriched in high-risk group (Figure 6A). By using CIBERSORT analyses, we observed that memory B cells, activated dendritic cells, activated mast cells, plasma cells, and activated memory CD4+ T cells were most notably enriched in low-risk patient group (Figure 6B and C).
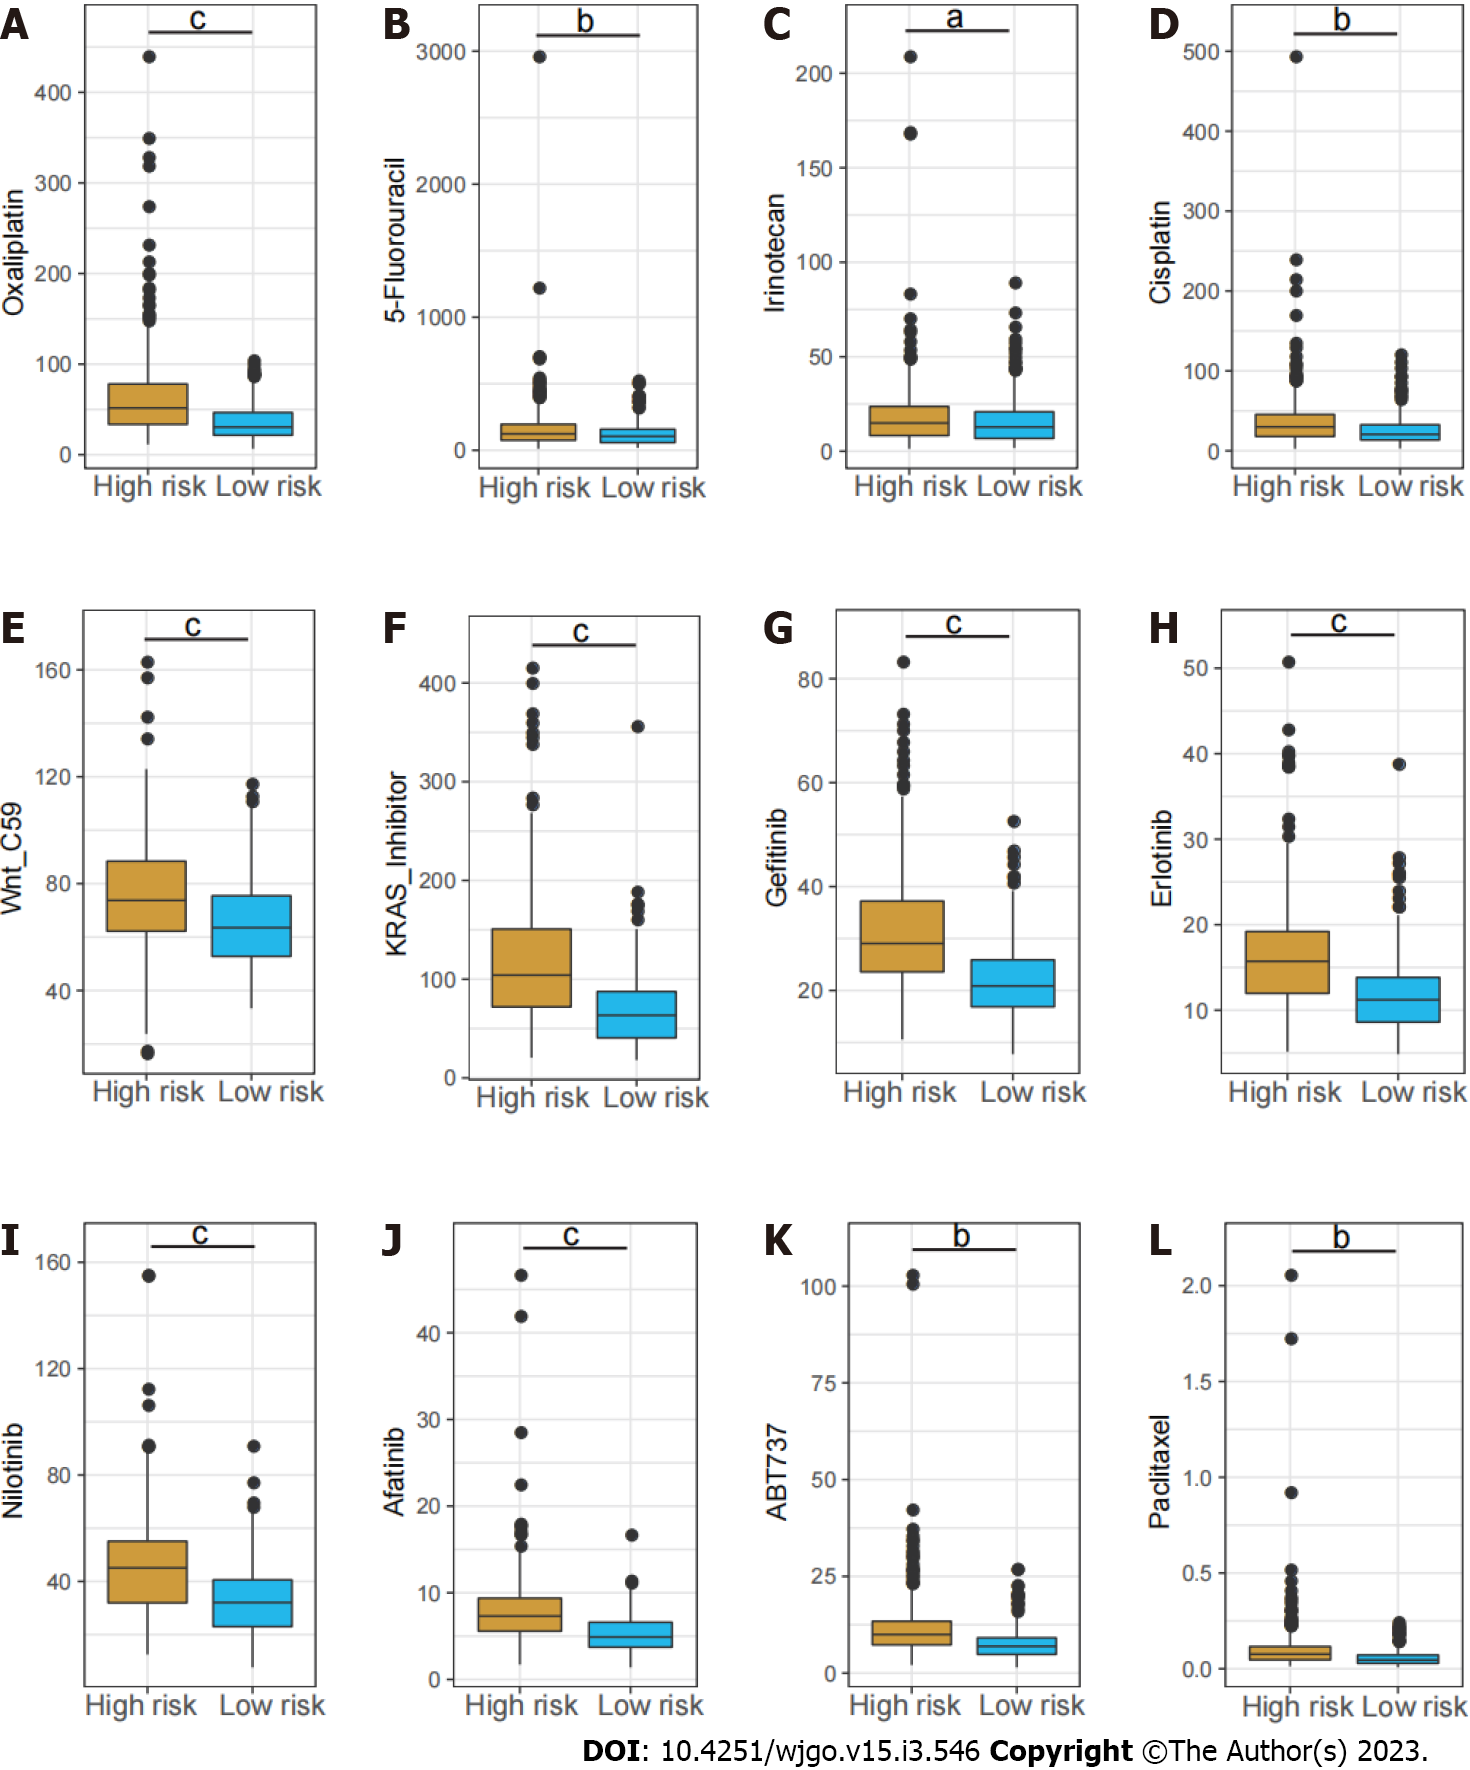
Chemotherapy drugs including oxaliplatin, 5-Fluorouracil and irinotecan are the mainstay treatment for CRC. Considering the distinct long-term survival and signaling pathway enrichment between the risk groups, the GSDC database was used to compare the sensitivity to chemotherapy drugs and several targeted inhibitors between low and high-risk patients. It demonstrated the estimated IC50 of oxaliplatin, 5-Fluorouracil and irinotecan were dramatically higher in the high-risk group. In addition, the IC50 of several other inhibitors including the Wnt inhibitor, KRAS inhibitor, Erlotinib, and Afatinib were notably higher in high-risk group (Figure 7).
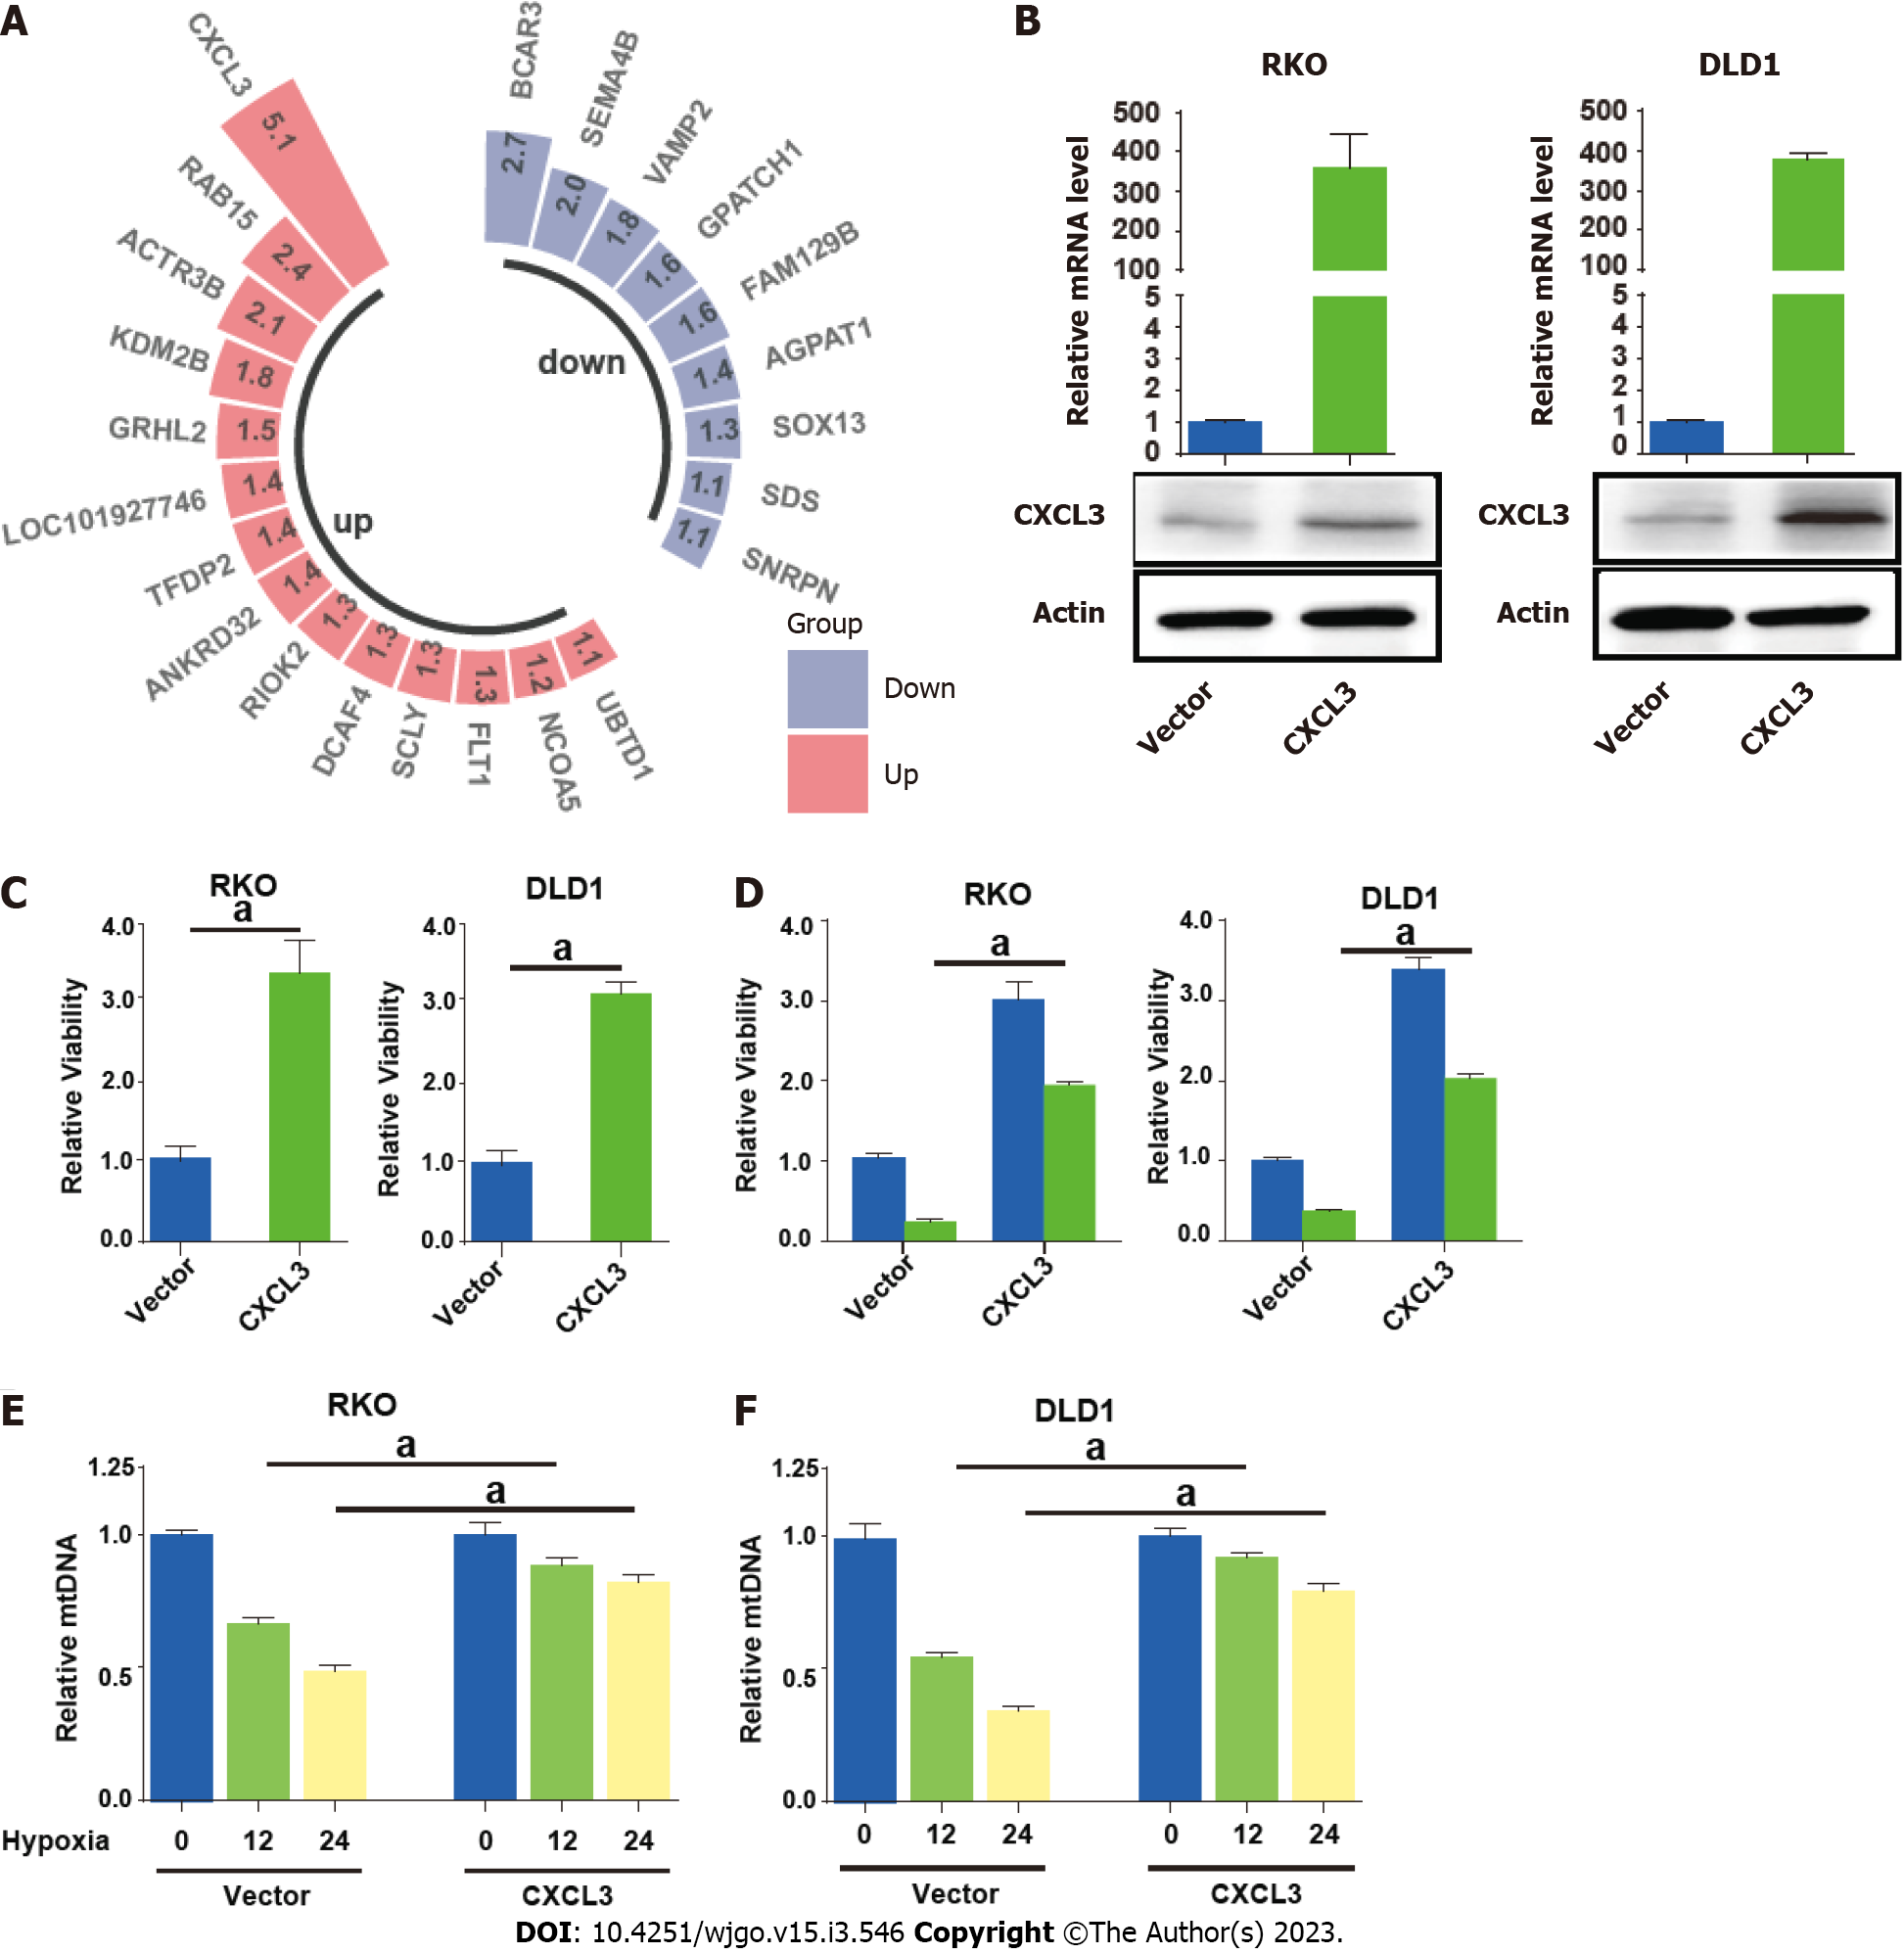
Paired transcriptome profiling data of cancer and normal tissues were obtained from GSE32323 dataset. We focused on the upregulated mitophagy related gene CXCL3, which showed the highest fold change in cancer tissues (Figure 8A). We then enforced CXCL3 expression in CRC cells (Figure 8B). The result showed that CXCL3 over-expression increased the proliferative ability of cells (Figure 8C) and weakened their sensitivity to oxaliplatin treatment (Figure 8D). We next examined mitochondrial DNA (mtDNA) to observe how ULK1 modulated mitophagy. The decrease in mtDNA was attenuated in the groups with CXCL3 overexpressed under hypoxic conditions (Figure 8E and F).
In our study, we integrated and analyzed transcriptomic patterns mediated by mitophagy-related genes. Using the “NMF” method, we grouped patients in the GEO datasets into three clusters with distinct clinical features, among which cluster III showed the most favorable prognosis and the most enriched immune cell infiltration. Here, we demonstrated that cluster III exhibited the enrichment of memory B cells, activated dendritic cells and activated memory CD4+ T cells. As previously reported, dendritic cells are a diverse group of specialized antigen-presenting cells with key roles in the initiation and regulation of innate and adaptive immune responses[16,17]. With their potent antigen presenting ability, dendritic cells have been long considered as critical factor in antitumor immunity[18]. CD4+ T cells, as a major population of cells in the tumor microenvironment (TME), are required for efficacious anti-tumor immunity[19-21]. CD4+ T cell are important in fully equipping cytotoxic T lymphocyte cells to target and eliminate cancer cells and facilitate the improvement in outcomes of all cancer immunotherapy strategies[22-25]. In this part, our research delineated intra-tumor heterogeneity of transcriptomic classifications mediated by mitophagy-related genes, and characterized their TME infiltration characteristics. We believe that the molecular classification mediated by mitophagy-related genes could provide new insight for risk stratification and therapeutic management in patients with CRC.
To further quantify the survival risk of CRC patients and facilitate prognostic predictions, we next identified mitophagy subtype related genes and determined the most useful genes to develop the final prognostic signature. Based on the LASSO regression model, a total of 36 mitophagy-related DEGs were identified. In training and validation sets, patients were successfully divided into two groups with significantly different prognoses. Here, we demonstrated that a high risk score was consistently related to a worse prognosis, and that this model exhibited excellent prognostic prediction abilities. In addition, we developed a nomogram based on mitophagy-related gene signatures to facilitate clinical follow-up and management in colorectal cancer. In both the training and validation sets, we confirmed the strong ability of prediction in our nomogram.
Most of the mitophagy-related genes have been experimentally investigated in colorectal cancer and 18 of them were prognostic for CRC[26-31]. We found that PTEN-induced kinase 1 (PINK1) was one of the most significant risk factors. Previous studies have revealed the restrained role of PINK1 mediated mitophagy in innate immunity[32]. In addition, a pan-cancer analysis showed a correlation between PINK1 expression and immune infiltration, including infiltration of B cells, CD8+ T cells, CD4+ T cells, macrophages, neutrophils, and dendritic cells, suggesting that PINK1 can work as a biomarker for prognosis and immune responses. However, this finding requires further experimental validation[33].
Though a novel mitophagy-related-gene-based signature has been developed in this study, our study mainly focused on the bioinformatic analyses, which still requires a more robust confirmation. Consequently, more in-depth experimental validation is needed to validate these findings.
In this study, we have shown for the first time the biological function of mitophagy-related genes in immune infiltration in CRC, and its correlations with patients’ prognosis and chemotherapy response in CRC. These interesting findings would offer novel insights for therapeutic management of CRC patients.
Mitophagy plays essential role in the initiation and progression of colorectal cancer (CRC). Mitophagy plays essential role in the initiation and progression of CRC.
The effect of mitophagy-related genes in CRC remains largely unknown.
To develop a mitophagy-related gene signature to predict the survival, immune infiltration and chemotherapy response of CRC patients.
Non-negative matrix factorization was used to cluster CRC patients from Gene Expression Omnibus database (GSE39582, GSE17536, and GSE37892) based on mitophagy-related gene expression. The CIBERSORT method was applied for the evaluation of the relative infiltration levels of immune cell types. The performance signature in predicting chemotherapeutic sensitivity was evaluated based on the Genomics of Drug Sensitivity in Cancer database.
Three clusters with different clinicopathological features and prognosis were identified. Higher enrichment of activated B cells and CD4+ T cells were observed in cluster III patients with the most favorable prognosis. Next, a gene risk model related to mitophagy was produced and patients in training and validation sets were categorized into low-risk and high-risk groups. Low risk patients showed significantly better prognosis, higher enrichment of immune activating cells and greater response to chemotherapy (oxaliplatin, irinotecan and 5-fluorouracil) compared to high risk patients. Further experiments identified CXCL3 as novel regulator of cell proliferation and mitophagy.
We revealed the biological roles of mitophagy-related genes in the immune infiltration, and its ability to predict patients’ prognosis and response to chemotherapy in CRC. These new findings would offer meaningful insights for the therapeutic management of CRC patients.
The developed signature in this study will aid in individualizing treatment and follow-up scheme in CRC patients.
Provenance and peer review: Unsolicited article; Externally peer reviewed.
Peer-review model: Single blind
Specialty type: Oncology
Country/Territory of origin: China
Peer-review report’s scientific quality classification
Grade A (Excellent): 0
Grade B (Very good): B
Grade C (Good): C, C
Grade D (Fair): 0
Grade E (Poor): 0
P-Reviewer: Cai GX, China; Yue T, China S-Editor: Chen YL L-Editor: A P-Editor: Yuan YY
| 1. | Sung H, Ferlay J, Siegel RL, Laversanne M, Soerjomataram I, Jemal A, Bray F. Global Cancer Statistics 2020: GLOBOCAN Estimates of Incidence and Mortality Worldwide for 36 Cancers in 185 Countries. CA Cancer J Clin. 2021;71:209-249. [RCA] [PubMed] [DOI] [Full Text] [Cited by in Crossref: 75126] [Cited by in RCA: 63668] [Article Influence: 15917.0] [Reference Citation Analysis (174)] |
| 2. | Biller LH, Schrag D. Diagnosis and Treatment of Metastatic Colorectal Cancer: A Review. JAMA. 2021;325:669-685. [RCA] [PubMed] [DOI] [Full Text] [Cited by in Crossref: 398] [Cited by in RCA: 1382] [Article Influence: 345.5] [Reference Citation Analysis (0)] |
| 3. | Onishi M, Yamano K, Sato M, Matsuda N, Okamoto K. Molecular mechanisms and physiological functions of mitophagy. EMBO J. 2021;40:e104705. [RCA] [PubMed] [DOI] [Full Text] [Full Text (PDF)] [Cited by in Crossref: 430] [Cited by in RCA: 829] [Article Influence: 207.3] [Reference Citation Analysis (0)] |
| 4. | Lemasters JJ. Selective mitochondrial autophagy, or mitophagy, as a targeted defense against oxidative stress, mitochondrial dysfunction, and aging. Rejuvenation Res. 2005;8:3-5. |
| 5. | Ferro F, Servais S, Besson P, Roger S, Dumas JF, Brisson L. Autophagy and mitophagy in cancer metabolic remodelling. Semin Cell Dev Biol. 2020;98:129-138. [RCA] [PubMed] [DOI] [Full Text] [Cited by in Crossref: 52] [Cited by in RCA: 178] [Article Influence: 29.7] [Reference Citation Analysis (0)] |
| 6. | Poole LP, Macleod KF. Mitophagy in tumorigenesis and metastasis. Cell Mol Life Sci. 2021;78:3817-3851. [RCA] [PubMed] [DOI] [Full Text] [Cited by in Crossref: 136] [Cited by in RCA: 153] [Article Influence: 38.3] [Reference Citation Analysis (0)] |
| 7. | Devenport SN, Singhal R, Radyk MD, Taranto JG, Kerk SA, Chen B, Goyert JW, Jain C, Das NK, Oravecz-Wilson K, Zhang L, Greenson JK, Chen YE, Soleimanpour SA, Reddy P, Lyssiotis CA, Shah YM. Colorectal cancer cells utilize autophagy to maintain mitochondrial metabolism for cell proliferation under nutrient stress. JCI Insight. 2021;6. [RCA] [PubMed] [DOI] [Full Text] [Full Text (PDF)] [Cited by in Crossref: 6] [Cited by in RCA: 19] [Article Influence: 4.8] [Reference Citation Analysis (0)] |
| 8. | Yin K, Lee J, Liu Z, Kim H, Martin DR, Wu D, Liu M, Xue X. Mitophagy protein PINK1 suppresses colon tumor growth by metabolic reprogramming via p53 activation and reducing acetyl-CoA production. Cell Death Differ. 2021;28:2421-2435. [RCA] [PubMed] [DOI] [Full Text] [Cited by in Crossref: 21] [Cited by in RCA: 88] [Article Influence: 22.0] [Reference Citation Analysis (2)] |
| 9. | Yan C, Luo L, Guo CY, Goto S, Urata Y, Shao JH, Li TS. Doxorubicin-induced mitophagy contributes to drug resistance in cancer stem cells from HCT8 human colorectal cancer cells. Cancer Lett. 2017;388:34-42. [RCA] [PubMed] [DOI] [Full Text] [Cited by in Crossref: 79] [Cited by in RCA: 124] [Article Influence: 13.8] [Reference Citation Analysis (0)] |
| 10. | Ziegler PK, Bollrath J, Pallangyo CK, Matsutani T, Canli Ö, De Oliveira T, Diamanti MA, Müller N, Gamrekelashvili J, Putoczki T, Horst D, Mankan AK, Öner MG, Müller S, Müller-Höcker J, Kirchner T, Slotta-Huspenina J, Taketo MM, Reinheckel T, Dröse S, Larner AC, Wels WS, Ernst M, Greten TF, Arkan MC, Korn T, Wirth D, Greten FR. Mitophagy in Intestinal Epithelial Cells Triggers Adaptive Immunity during Tumorigenesis. Cell. 2018;174:88-101.e16. [RCA] [PubMed] [DOI] [Full Text] [Cited by in Crossref: 56] [Cited by in RCA: 105] [Article Influence: 15.0] [Reference Citation Analysis (0)] |
| 11. | Lee DD, Seung HS. Learning the parts of objects by non-negative matrix factorization. Nature. 1999;401:788-791. [RCA] [PubMed] [DOI] [Full Text] [Cited by in Crossref: 8381] [Cited by in RCA: 3658] [Article Influence: 140.7] [Reference Citation Analysis (0)] |
| 12. | Wang YX, Zhang YJ. Nonnegative Matrix Factorization: A Comprehensive Review. IEEE Trans Knowl Data Eng. 2013;25:1336-53. [DOI] [Full Text] |
| 13. | Newman AM, Liu CL, Green MR, Gentles AJ, Feng W, Xu Y, Hoang CD, Diehn M, Alizadeh AA. Robust enumeration of cell subsets from tissue expression profiles. Nat Methods. 2015;12:453-457. [RCA] [PubMed] [DOI] [Full Text] [Full Text (PDF)] [Cited by in Crossref: 4763] [Cited by in RCA: 8774] [Article Influence: 877.4] [Reference Citation Analysis (0)] |
| 14. | Tibshirani R. Regression shrinkage and selection via the lasso: a retrospective. J R Stat Soc Series B Stat Methodol. 2011;73:273-82. [RCA] [DOI] [Full Text] [Cited by in Crossref: 1634] [Cited by in RCA: 1143] [Article Influence: 81.6] [Reference Citation Analysis (0)] |
| 15. | Chen B, Khodadoust MS, Liu CL, Newman AM, Alizadeh AA. Profiling Tumor Infiltrating Immune Cells with CIBERSORT. Methods Mol Biol. 2018;1711:243-259. [RCA] [PubMed] [DOI] [Full Text] [Cited by in Crossref: 993] [Cited by in RCA: 2400] [Article Influence: 342.9] [Reference Citation Analysis (0)] |
| 16. | Patente TA, Pinho MP, Oliveira AA, Evangelista GCM, Bergami-Santos PC, Barbuto JAM. Human Dendritic Cells: Their Heterogeneity and Clinical Application Potential in Cancer Immunotherapy. Front Immunol. 2018;9:3176. [RCA] [PubMed] [DOI] [Full Text] [Full Text (PDF)] [Cited by in Crossref: 130] [Cited by in RCA: 273] [Article Influence: 45.5] [Reference Citation Analysis (0)] |
| 17. | Murphy TL, Murphy KM. Dendritic cells in cancer immunology. Cell Mol Immunol. 2022;19:3-13. [RCA] [PubMed] [DOI] [Full Text] [Full Text (PDF)] [Cited by in Crossref: 31] [Cited by in RCA: 145] [Article Influence: 48.3] [Reference Citation Analysis (0)] |
| 18. | Huang TX, Tan XY, Huang HS, Li YT, Liu BL, Liu KS, Chen X, Chen Z, Guan XY, Zou C, Fu L. Targeting cancer-associated fibroblast-secreted WNT2 restores dendritic cell-mediated antitumour immunity. Gut. 2022;71:333-344. [RCA] [PubMed] [DOI] [Full Text] [Full Text (PDF)] [Cited by in Crossref: 26] [Cited by in RCA: 111] [Article Influence: 37.0] [Reference Citation Analysis (0)] |
| 19. | Toor SM, Murshed K, Al-Dhaheri M, Khawar M, Abu Nada M, Elkord E. Immune Checkpoints in Circulating and Tumor-Infiltrating CD4(+) T Cell Subsets in Colorectal Cancer Patients. Front Immunol. 2019;10:2936. [RCA] [PubMed] [DOI] [Full Text] [Full Text (PDF)] [Cited by in Crossref: 61] [Cited by in RCA: 114] [Article Influence: 19.0] [Reference Citation Analysis (0)] |
| 20. | Aristin Revilla S, Kranenburg O, Coffer PJ. Colorectal Cancer-Infiltrating Regulatory T Cells: Functional Heterogeneity, Metabolic Adaptation, and Therapeutic Targeting. Front Immunol. 2022;13:903564. [RCA] [PubMed] [DOI] [Full Text] [Full Text (PDF)] [Cited by in RCA: 53] [Reference Citation Analysis (0)] |
| 21. | Borst J, Ahrends T, Bąbała N, Melief CJM, Kastenmüller W. CD4(+) T cell help in cancer immunology and immunotherapy. Nat Rev Immunol. 2018;18:635-647. [RCA] [PubMed] [DOI] [Full Text] [Cited by in Crossref: 582] [Cited by in RCA: 1083] [Article Influence: 180.5] [Reference Citation Analysis (0)] |
| 22. | Zander R, Schauder D, Xin G, Nguyen C, Wu X, Zajac A, Cui W. CD4(+) T Cell Help Is Required for the Formation of a Cytolytic CD8(+) T Cell Subset that Protects against Chronic Infection and Cancer. Immunity. 2019;51:1028-1042.e4. [RCA] [PubMed] [DOI] [Full Text] [Cited by in Crossref: 221] [Cited by in RCA: 444] [Article Influence: 74.0] [Reference Citation Analysis (0)] |
| 23. | Ahrends T, Bąbała N, Xiao Y, Yagita H, van Eenennaam H, Borst J. CD27 Agonism Plus PD-1 Blockade Recapitulates CD4+ T-cell Help in Therapeutic Anticancer Vaccination. Cancer Res. 2016;76:2921-2931. [RCA] [PubMed] [DOI] [Full Text] [Cited by in Crossref: 81] [Cited by in RCA: 103] [Article Influence: 11.4] [Reference Citation Analysis (0)] |
| 24. | Janssen EM, Lemmens EE, Wolfe T, Christen U, von Herrath MG, Schoenberger SP. CD4+ T cells are required for secondary expansion and memory in CD8+ T lymphocytes. Nature. 2003;421:852-856. [RCA] [PubMed] [DOI] [Full Text] [Cited by in Crossref: 1259] [Cited by in RCA: 1266] [Article Influence: 57.5] [Reference Citation Analysis (0)] |
| 25. | Szabo SJ, Sullivan BM, Peng SL, Glimcher LH. Molecular mechanisms regulating Th1 immune responses. Annu Rev Immunol. 2003;21:713-758. [RCA] [PubMed] [DOI] [Full Text] [Cited by in Crossref: 692] [Cited by in RCA: 732] [Article Influence: 33.3] [Reference Citation Analysis (0)] |
| 26. | Salvatore L, Calegari MA, Loupakis F, Fassan M, Di Stefano B, Bensi M, Bria E, Tortora G. PTEN in Colorectal Cancer: Shedding Light on Its Role as Predictor and Target. Cancers (Basel). 2019;11. [RCA] [PubMed] [DOI] [Full Text] [Full Text (PDF)] [Cited by in Crossref: 65] [Cited by in RCA: 61] [Article Influence: 10.2] [Reference Citation Analysis (0)] |
| 27. | Qureshi-Baig K, Kuhn D, Viry E, Pozdeev VI, Schmitz M, Rodriguez F, Ullmann P, Koncina E, Nurmik M, Frasquilho S, Nazarov PV, Zuegel N, Boulmont M, Karapetyan Y, Antunes L, Val D, Mittelbronn M, Janji B, Haan S, Letellier E. Hypoxia-induced autophagy drives colorectal cancer initiation and progression by activating the PRKC/PKC-EZR (ezrin) pathway. Autophagy. 2020;16:1436-1452. [RCA] [PubMed] [DOI] [Full Text] [Full Text (PDF)] [Cited by in Crossref: 99] [Cited by in RCA: 136] [Article Influence: 27.2] [Reference Citation Analysis (0)] |
| 28. | Garo LP, Ajay AK, Fujiwara M, Gabriely G, Raheja R, Kuhn C, Kenyon B, Skillin N, Kadowaki-Saga R, Saxena S, Murugaiyan G. MicroRNA-146a limits tumorigenic inflammation in colorectal cancer. Nat Commun. 2021;12:2419. [RCA] [PubMed] [DOI] [Full Text] [Full Text (PDF)] [Cited by in Crossref: 60] [Cited by in RCA: 86] [Article Influence: 21.5] [Reference Citation Analysis (0)] |
| 29. | Foerster EG, Mukherjee T, Cabral-Fernandes L, Rocha JDB, Girardin SE, Philpott DJ. How autophagy controls the intestinal epithelial barrier. Autophagy. 2022;18:86-103. [RCA] [PubMed] [DOI] [Full Text] [Cited by in Crossref: 92] [Cited by in RCA: 219] [Article Influence: 73.0] [Reference Citation Analysis (0)] |
| 30. | Zhang S, Yang Z, Bao W, Liu L, You Y, Wang X, Shao L, Fu W, Kou X, Shen W, Yuan C, Hu B, Dang W, Nandakumar KS, Jiang H, Zheng M, Shen X. SNX10 (sorting nexin 10) inhibits colorectal cancer initiation and progression by controlling autophagic degradation of SRC. Autophagy. 2020;16:735-749. [RCA] [PubMed] [DOI] [Full Text] [Full Text (PDF)] [Cited by in Crossref: 49] [Cited by in RCA: 47] [Article Influence: 9.4] [Reference Citation Analysis (0)] |
| 31. | Yan C, Gong L, Chen L, Xu M, Abou-Hamdan H, Tang M, Désaubry L, Song Z. PHB2 (prohibitin 2) promotes PINK1-PRKN/Parkin-dependent mitophagy by the PARL-PGAM5-PINK1 axis. Autophagy. 2020;16:419-434. [RCA] [PubMed] [DOI] [Full Text] [Cited by in Crossref: 105] [Cited by in RCA: 282] [Article Influence: 47.0] [Reference Citation Analysis (0)] |
| 32. | Sliter DA, Martinez J, Hao L, Chen X, Sun N, Fischer TD, Burman JL, Li Y, Zhang Z, Narendra DP, Cai H, Borsche M, Klein C, Youle RJ. Parkin and PINK1 mitigate STING-induced inflammation. Nature. 2018;561:258-262. [RCA] [PubMed] [DOI] [Full Text] [Full Text (PDF)] [Cited by in Crossref: 603] [Cited by in RCA: 972] [Article Influence: 138.9] [Reference Citation Analysis (0)] |
| 33. | Zhu L, Wu W, Jiang S, Yu S, Yan Y, Wang K, He J, Ren Y, Wang B. Pan-Cancer Analysis of the Mitophagy-Related Protein PINK1 as a Biomarker for the Immunological and Prognostic Role. Front Oncol. 2020;10:569887. [RCA] [PubMed] [DOI] [Full Text] [Full Text (PDF)] [Cited by in Crossref: 10] [Cited by in RCA: 28] [Article Influence: 5.6] [Reference Citation Analysis (0)] |


