Copyright
©The Author(s) 2024.
World J Gastrointest Oncol. May 15, 2024; 16(5): 2200-2218
Published online May 15, 2024. doi: 10.4251/wjgo.v16.i5.2200
Published online May 15, 2024. doi: 10.4251/wjgo.v16.i5.2200
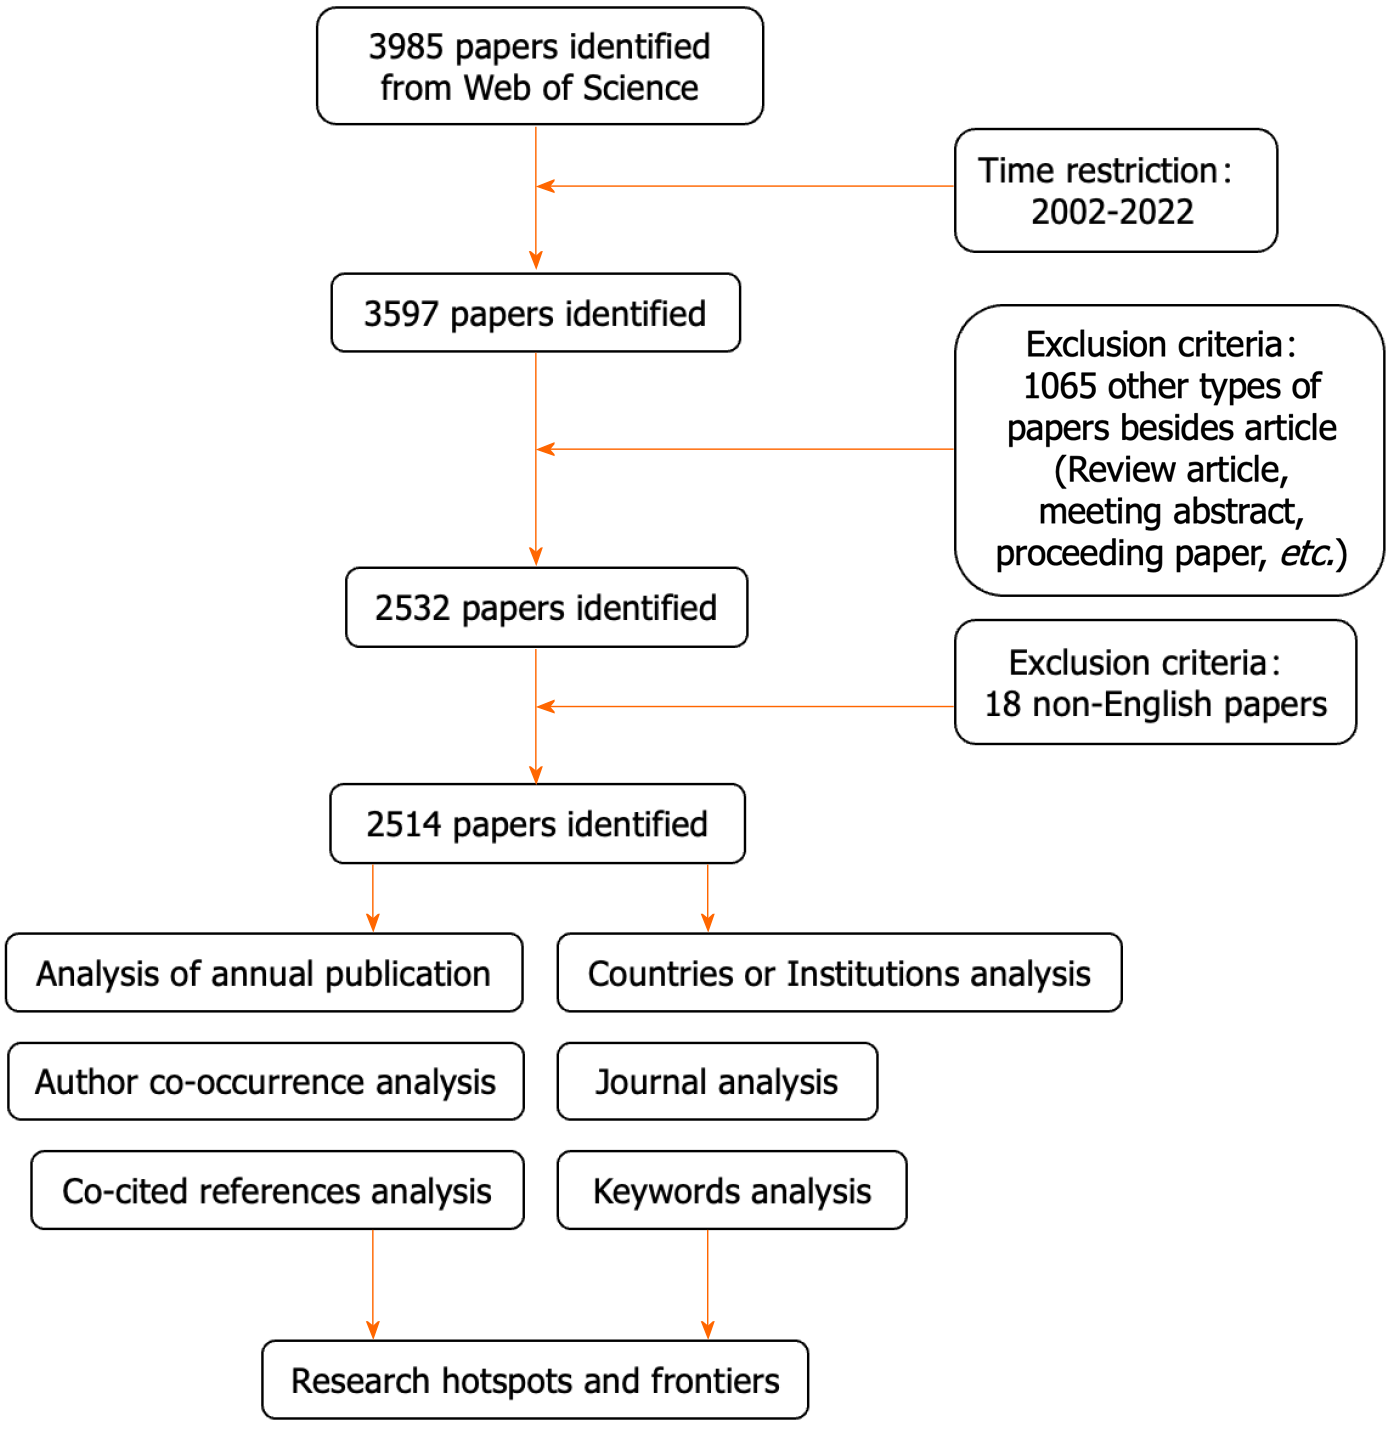
Figure 1 Flow chart of literature screening.
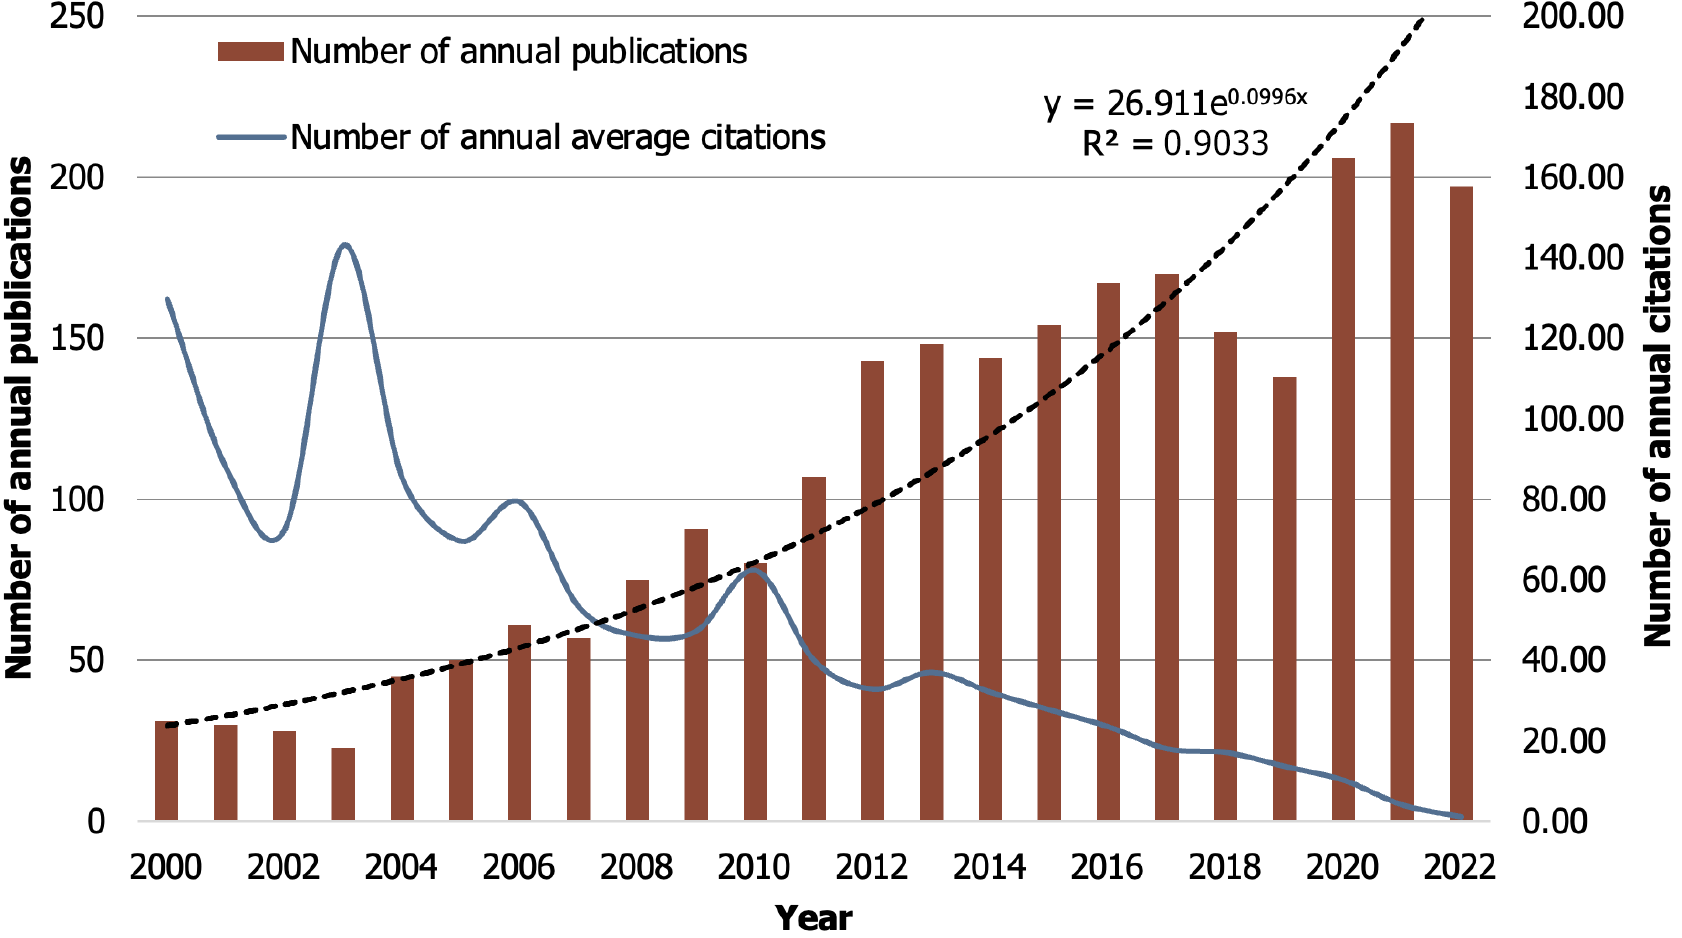
Figure 2 Annual number of the publications in risk factors for gastric cancer research.
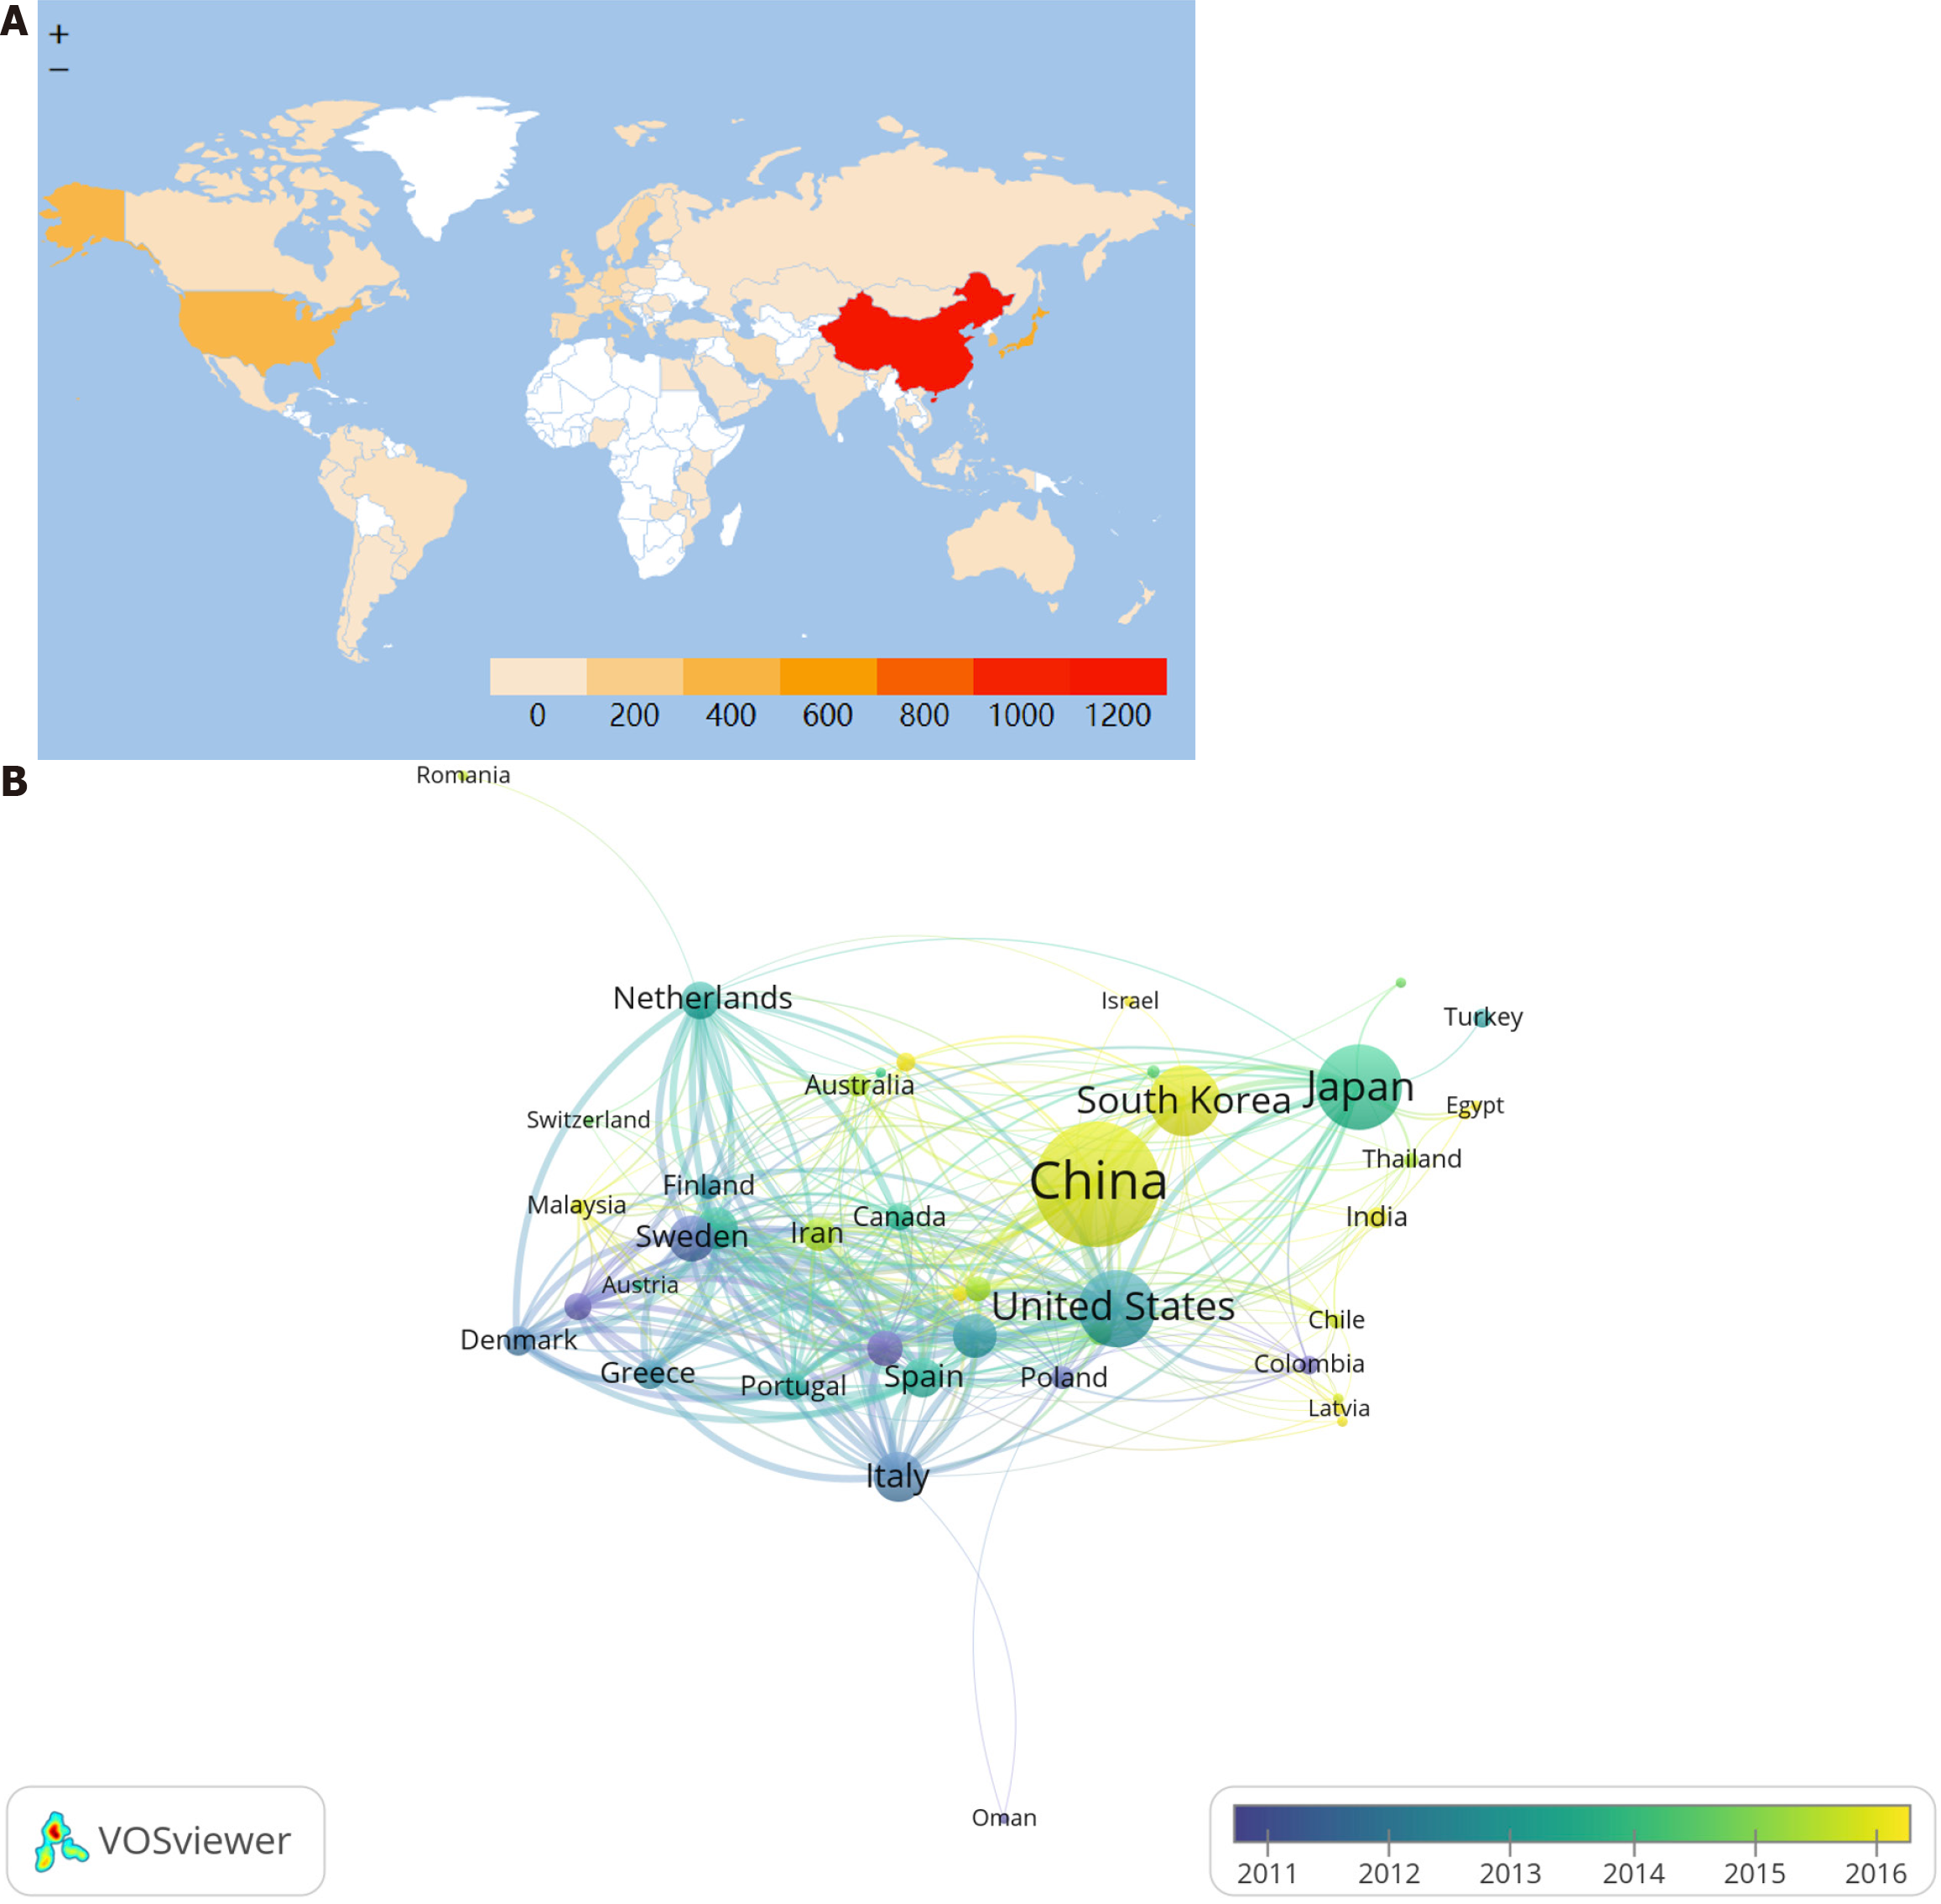
Figure 3 Depiction of countries involved in risk factors for gastric cancer research.
A: Distribution of risk factors for gastric cancer publications in the world map; B: Overlay visualization map of co-authorship among countries.
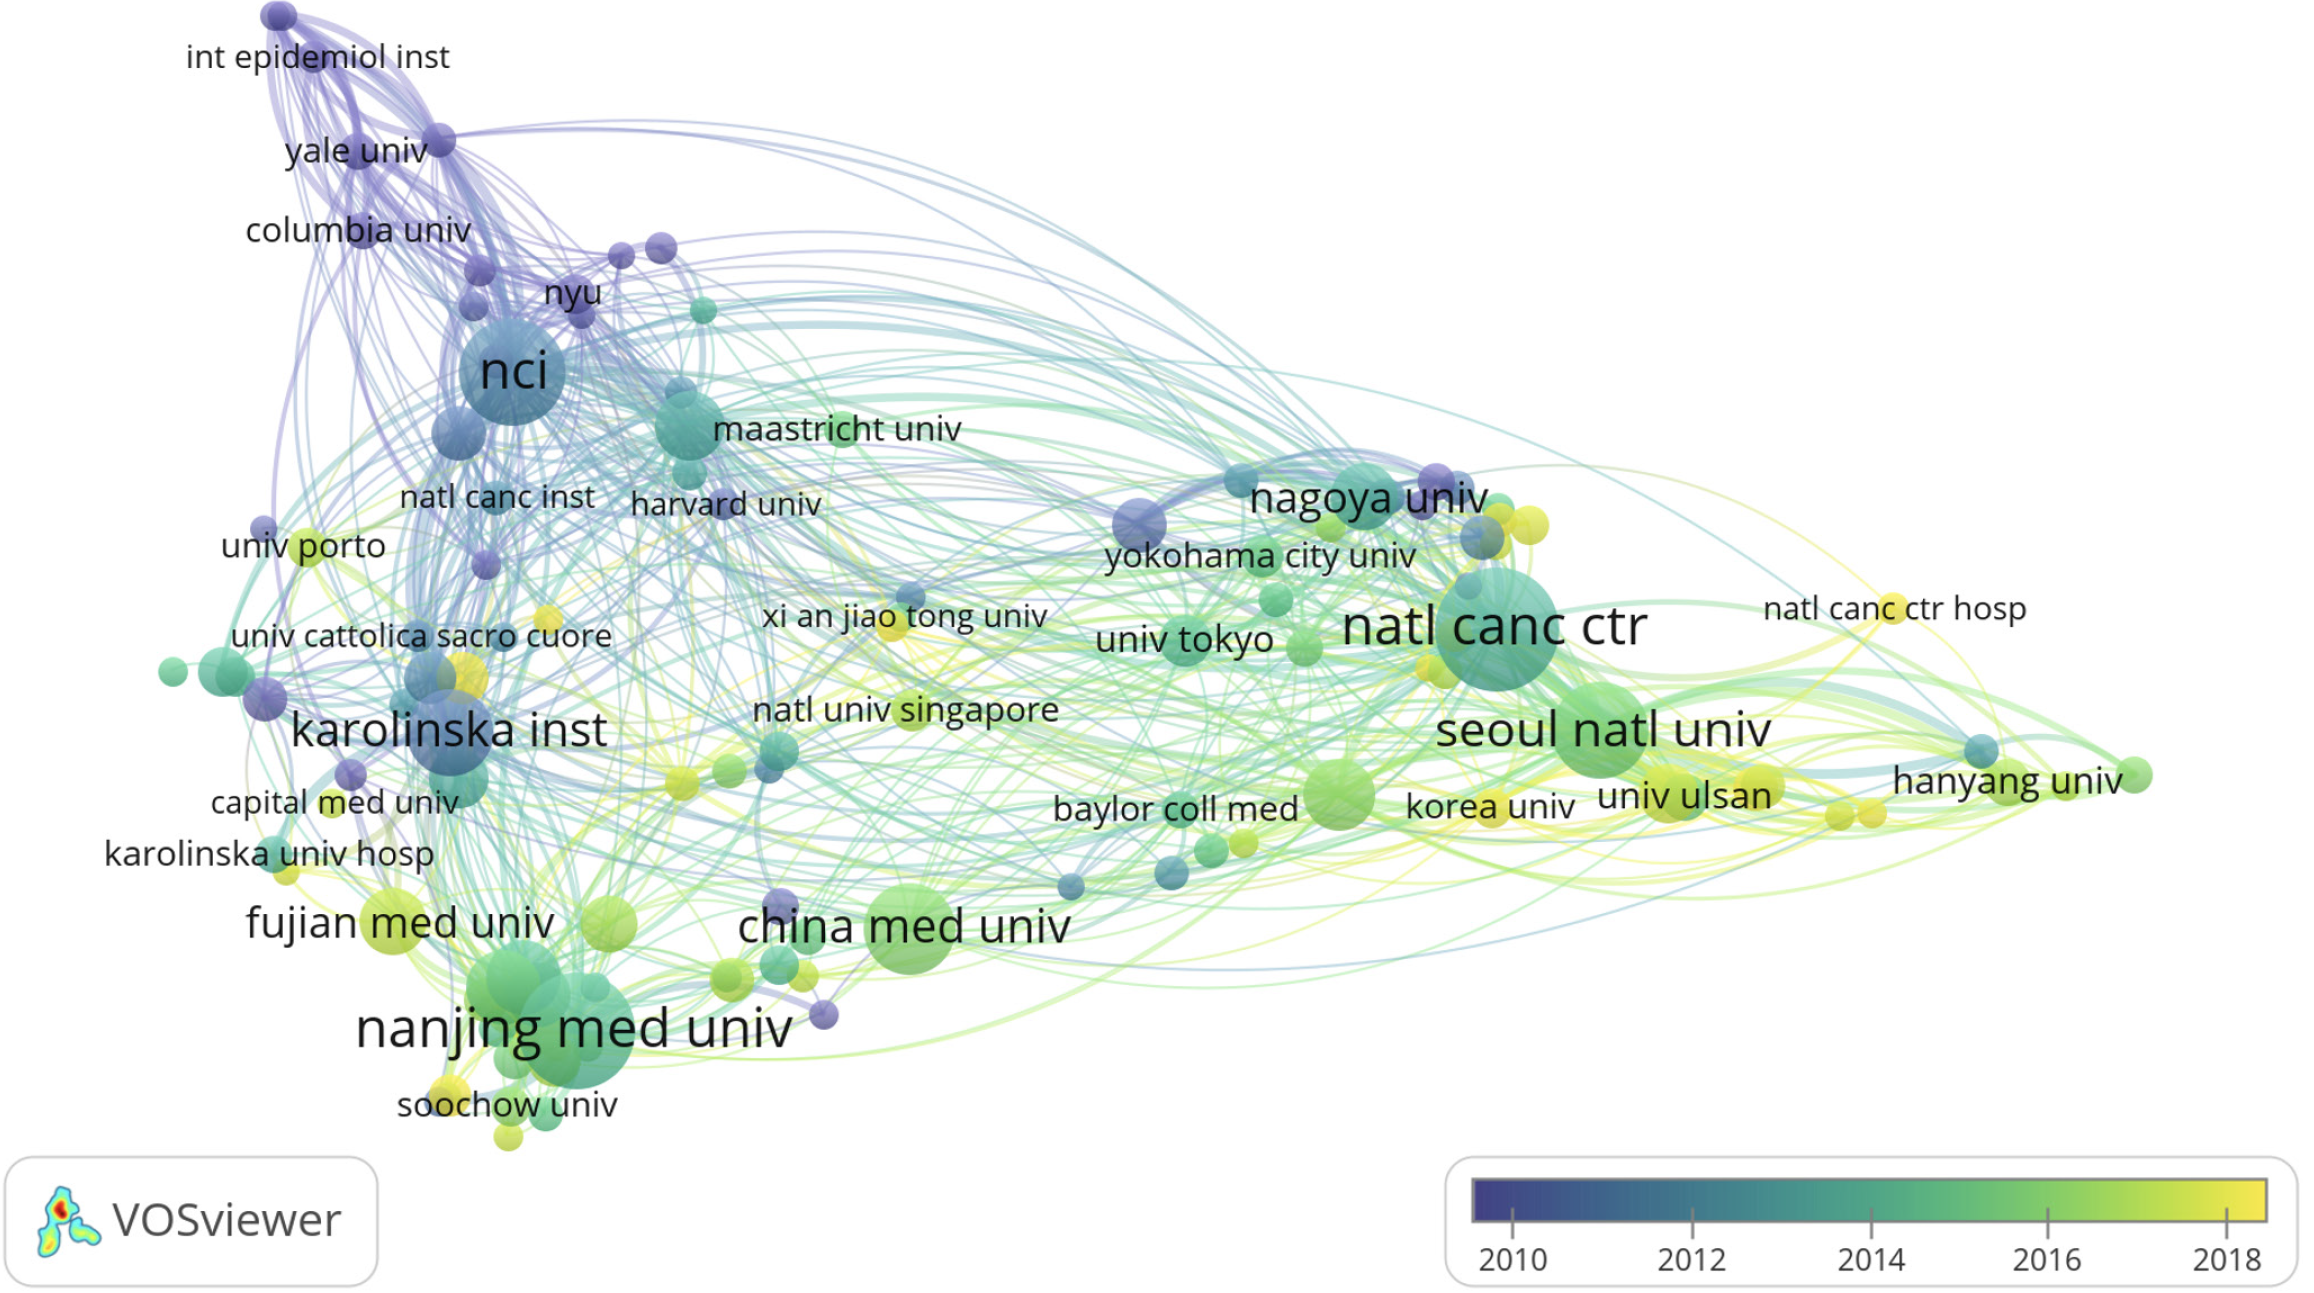
Figure 4 Overlay visualization map of co-authorship among institutions with 10 or more publications.
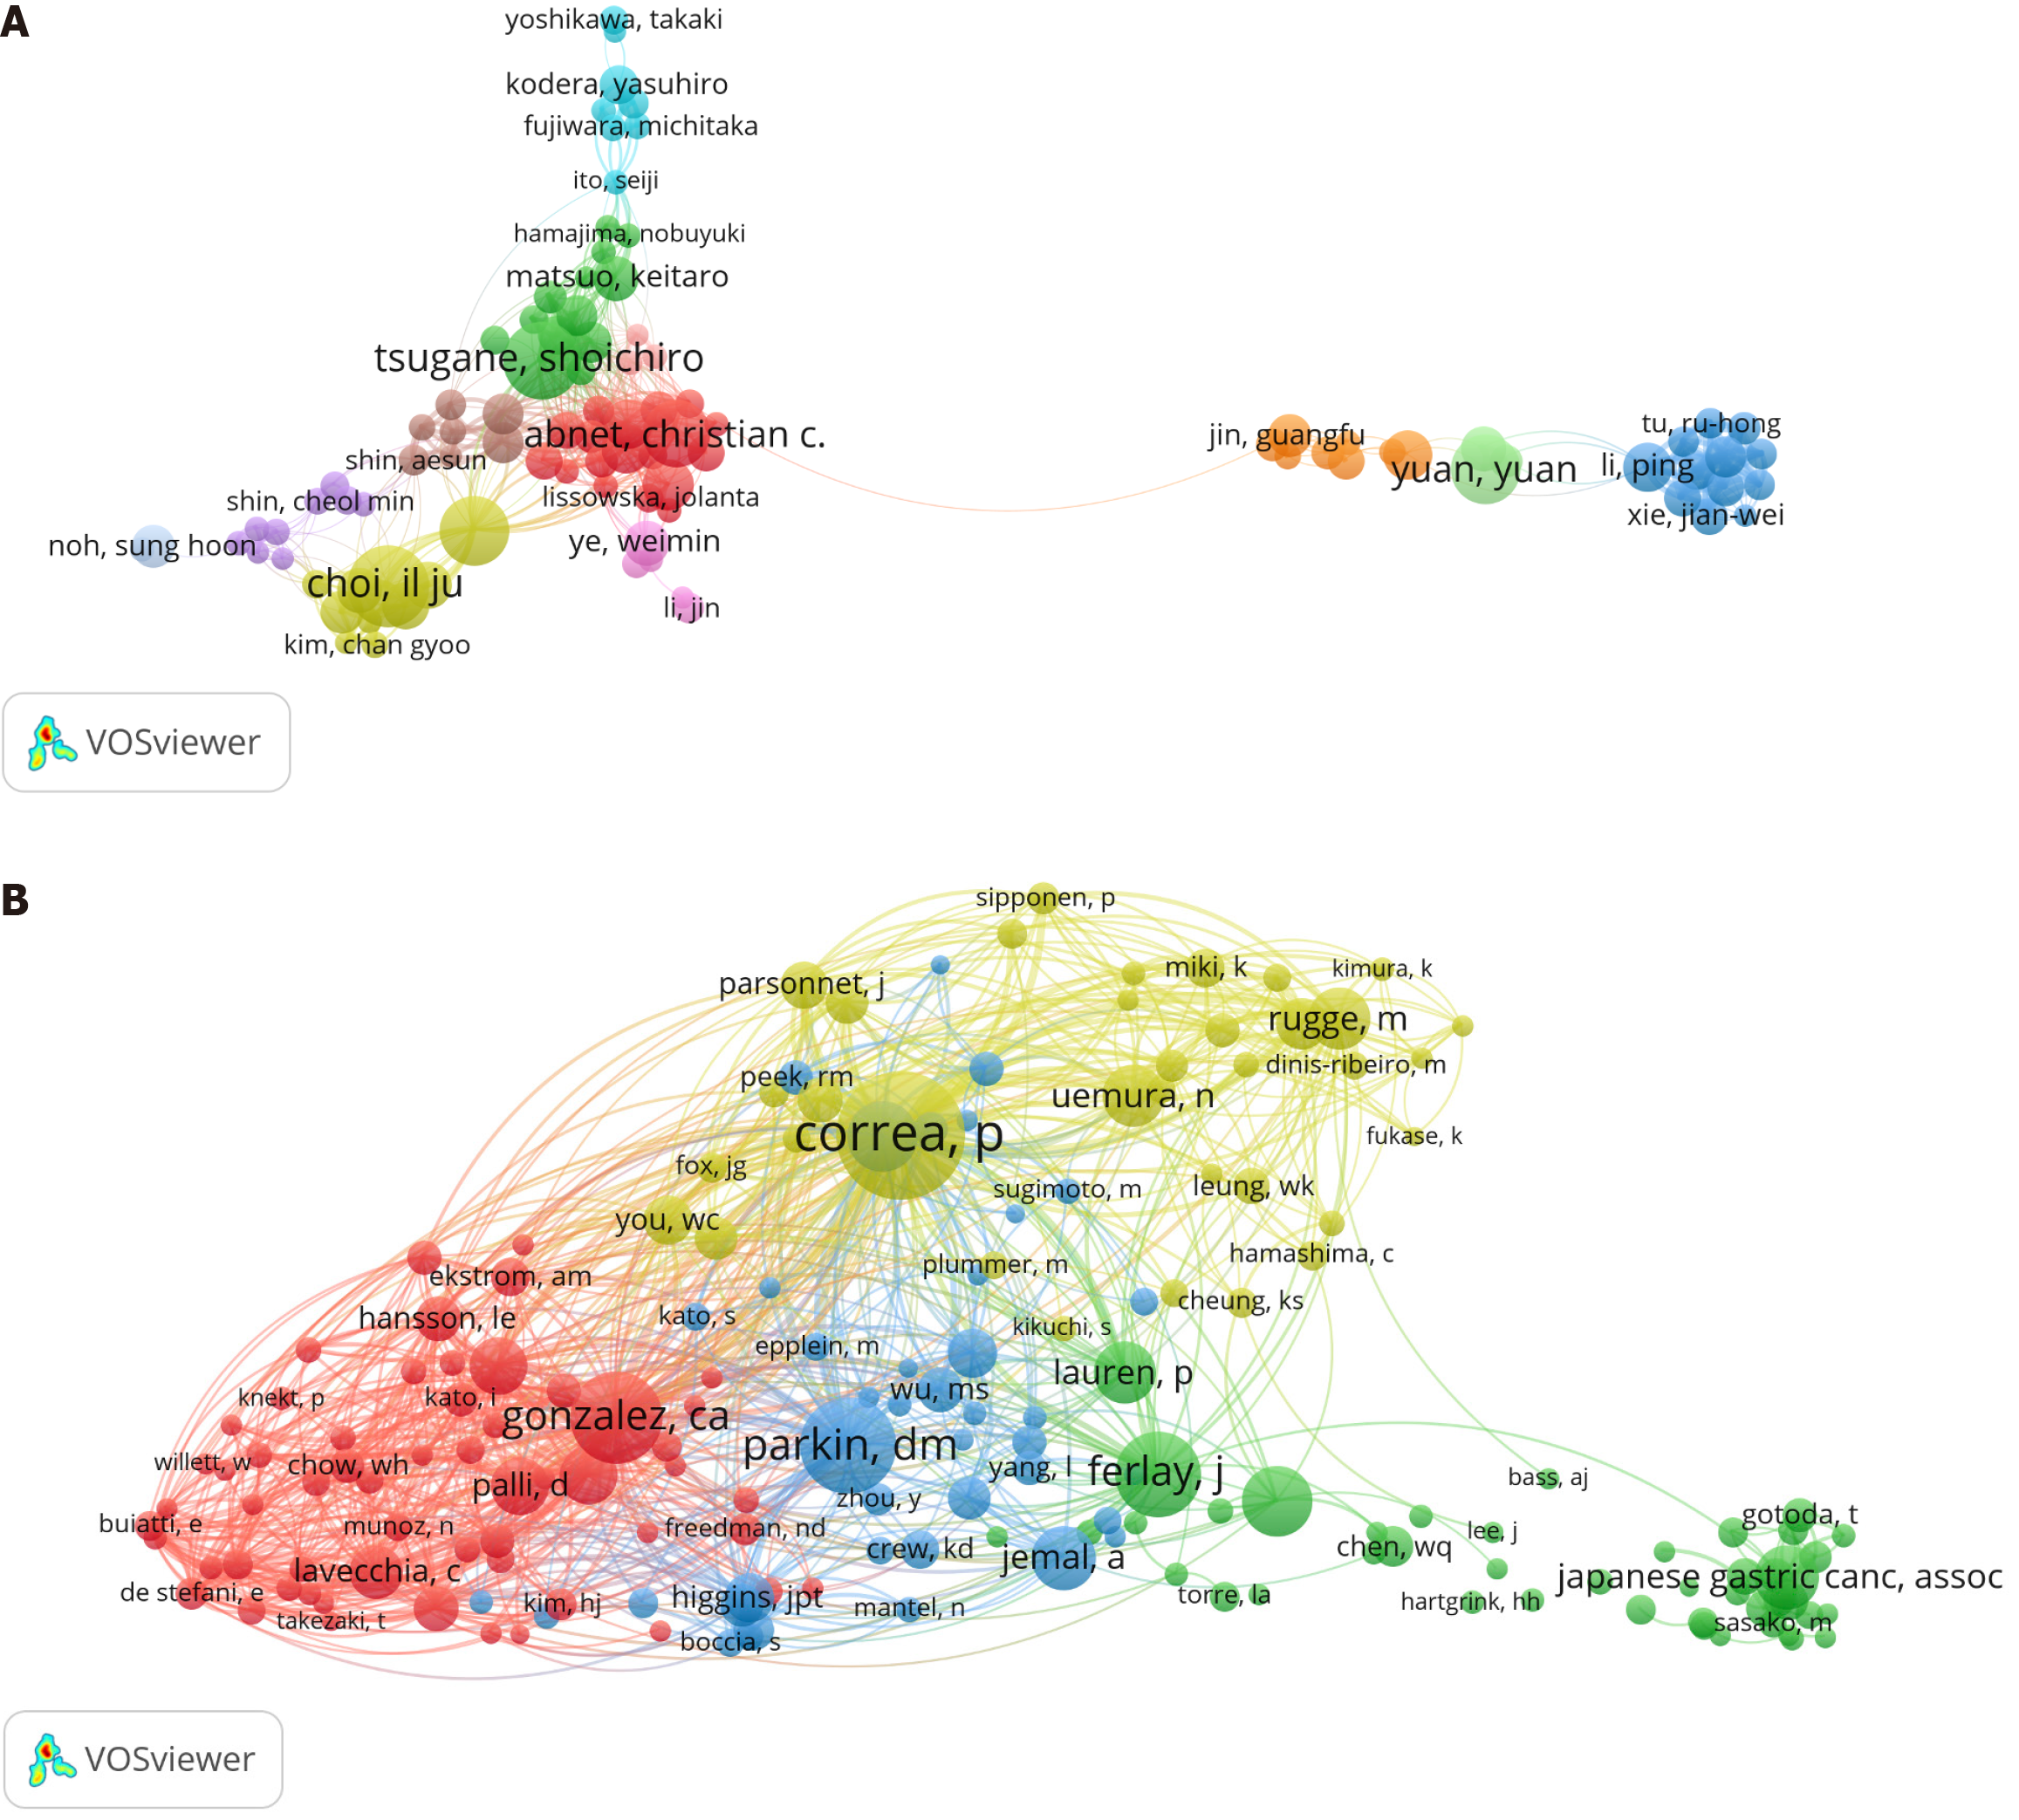
Figure 5 The distribution of authors and co-cited authors in risk factors for gastric cancer research.
A: Network visualization map of authors with 10 or more publications; B: Visualization map of co-cited authors.
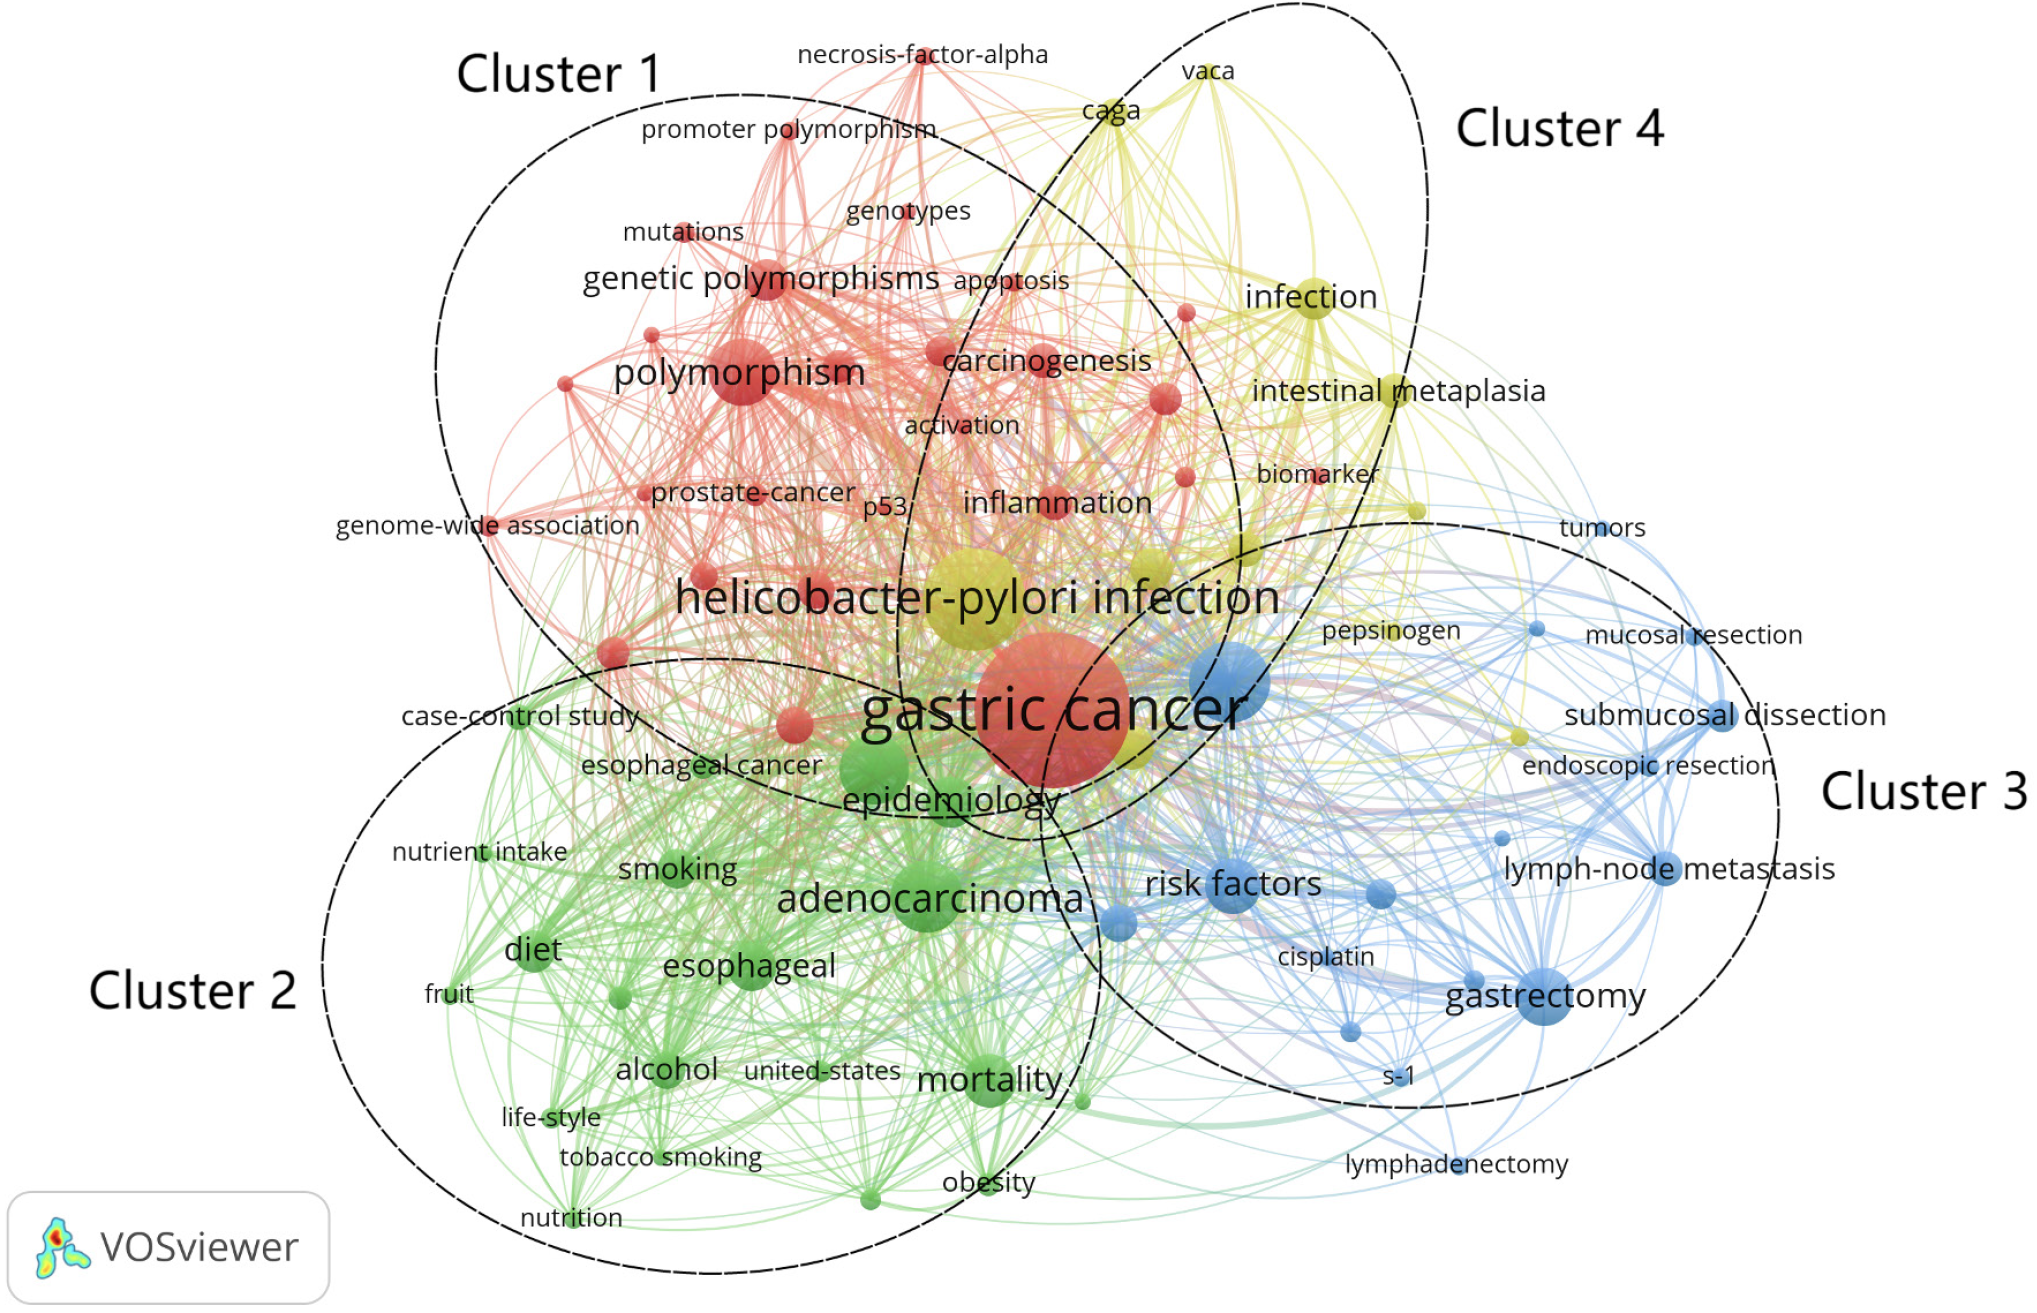
Figure 6 Co-occurrence network visualization map of keywords.
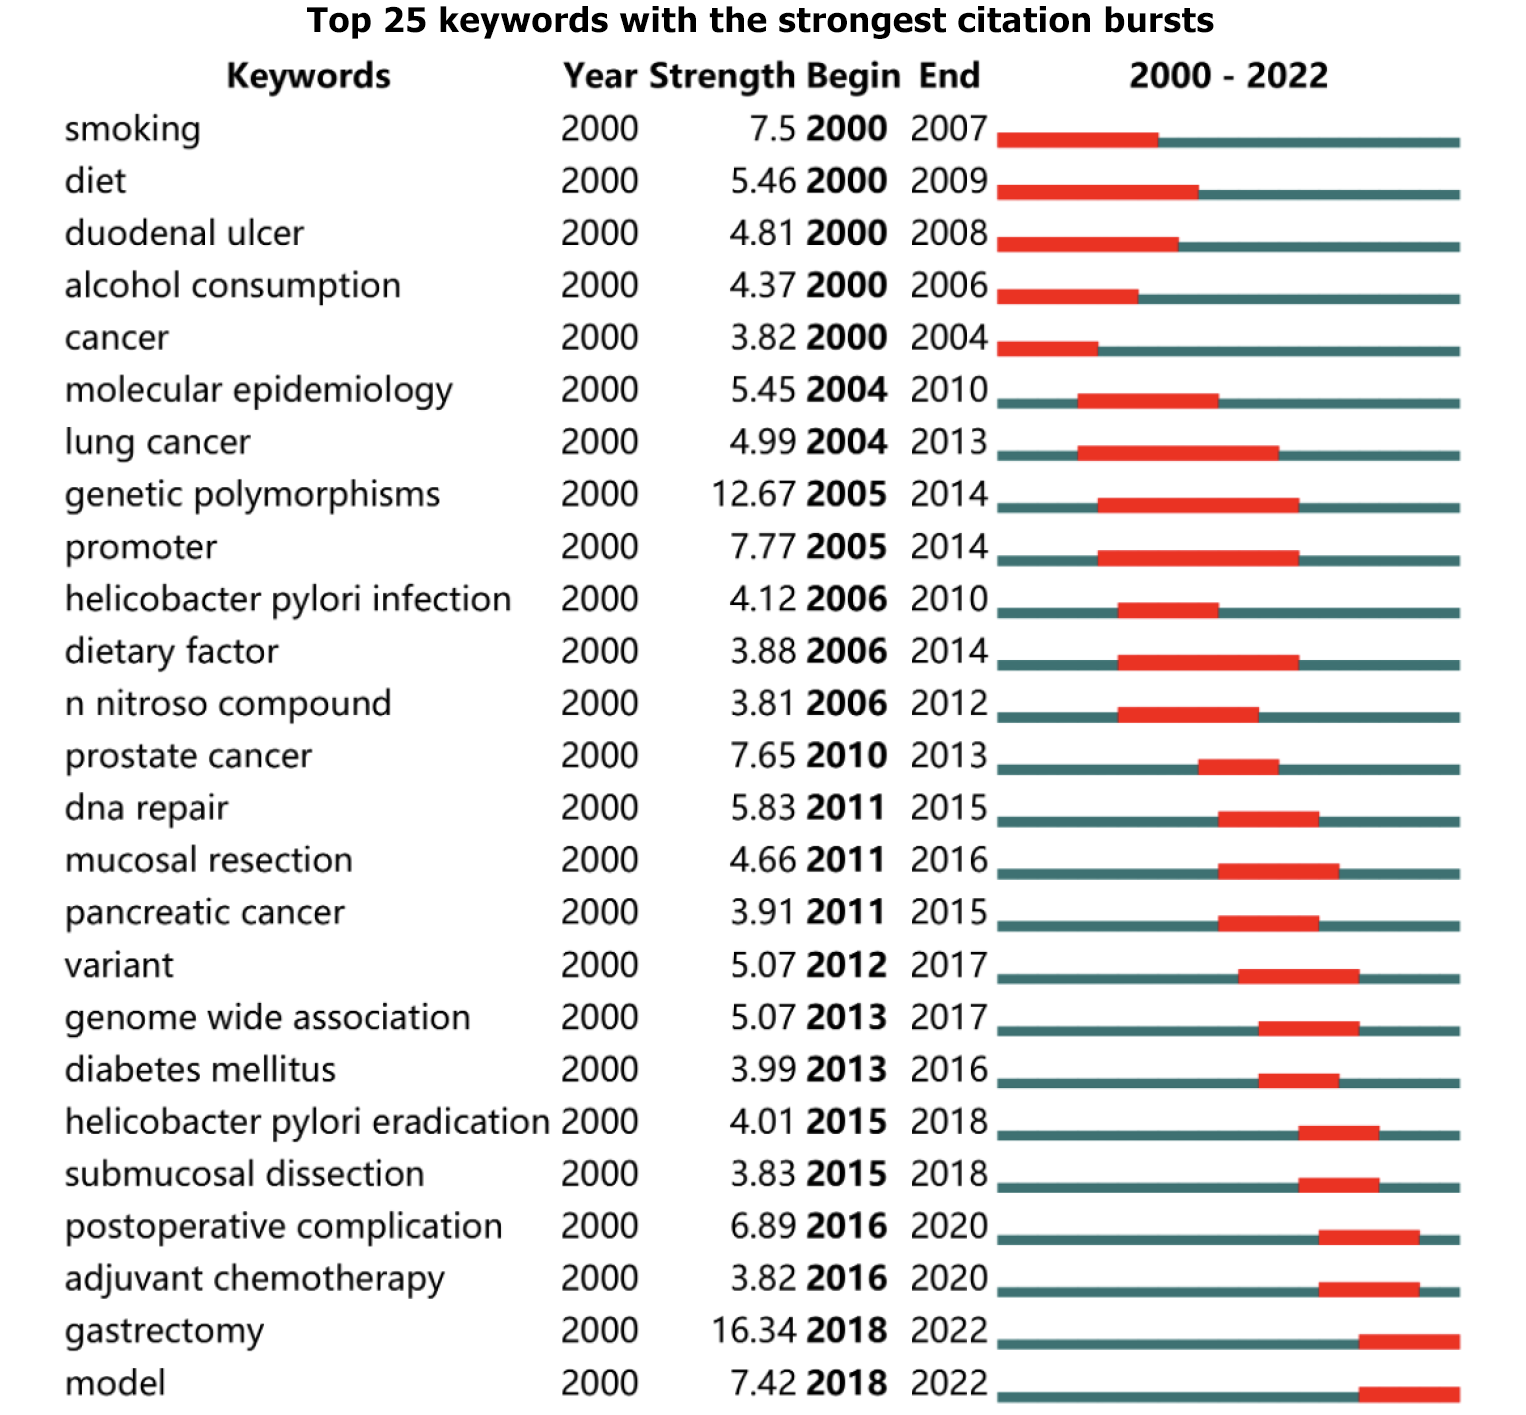
Figure 7 Top 25 keywords with the strongest citation bursts.
- Citation: Li M, Gao N, Wang SL, Guo YF, Liu Z. Hotspots and trends of risk factors in gastric cancer: A visualization and bibliometric analysis. World J Gastrointest Oncol 2024; 16(5): 2200-2218
- URL: https://www.wjgnet.com/1948-5204/full/v16/i5/2200.htm
- DOI: https://dx.doi.org/10.4251/wjgo.v16.i5.2200


