Copyright
©The Author(s) 2024.
World J Gastrointest Oncol. Nov 15, 2024; 16(11): 4456-4467
Published online Nov 15, 2024. doi: 10.4251/wjgo.v16.i11.4456
Published online Nov 15, 2024. doi: 10.4251/wjgo.v16.i11.4456
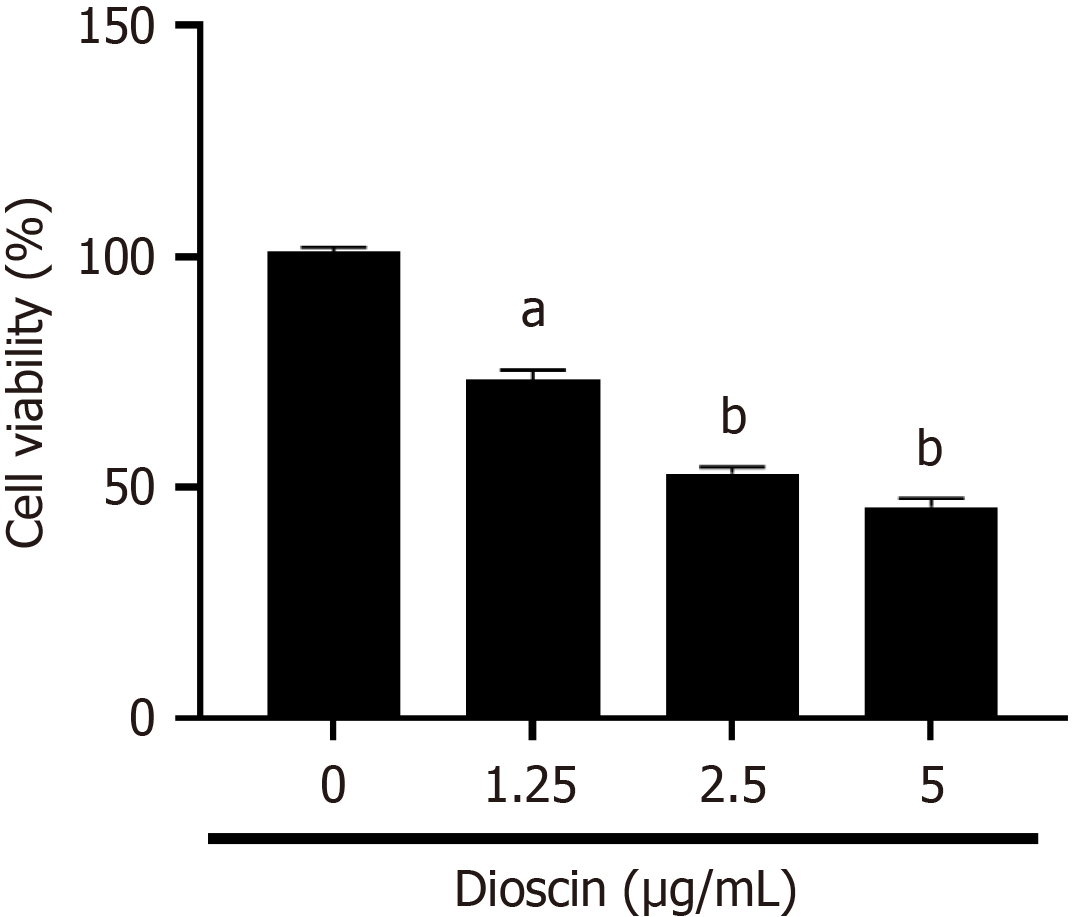
Figure 1 Effect on dioscin on HCT116 activity.
Dioscin at different doses (0, 1.25, 2.5, and 5 μg/mL) was applied to HCT116 cells for 48 hours. The cell counting kit-8 kit was used to measure the dioscin inhibition rate. Three biological repeats were used and reported as mean ± SD. aP < 0.01, and bP < 0.001 compare to the control group.
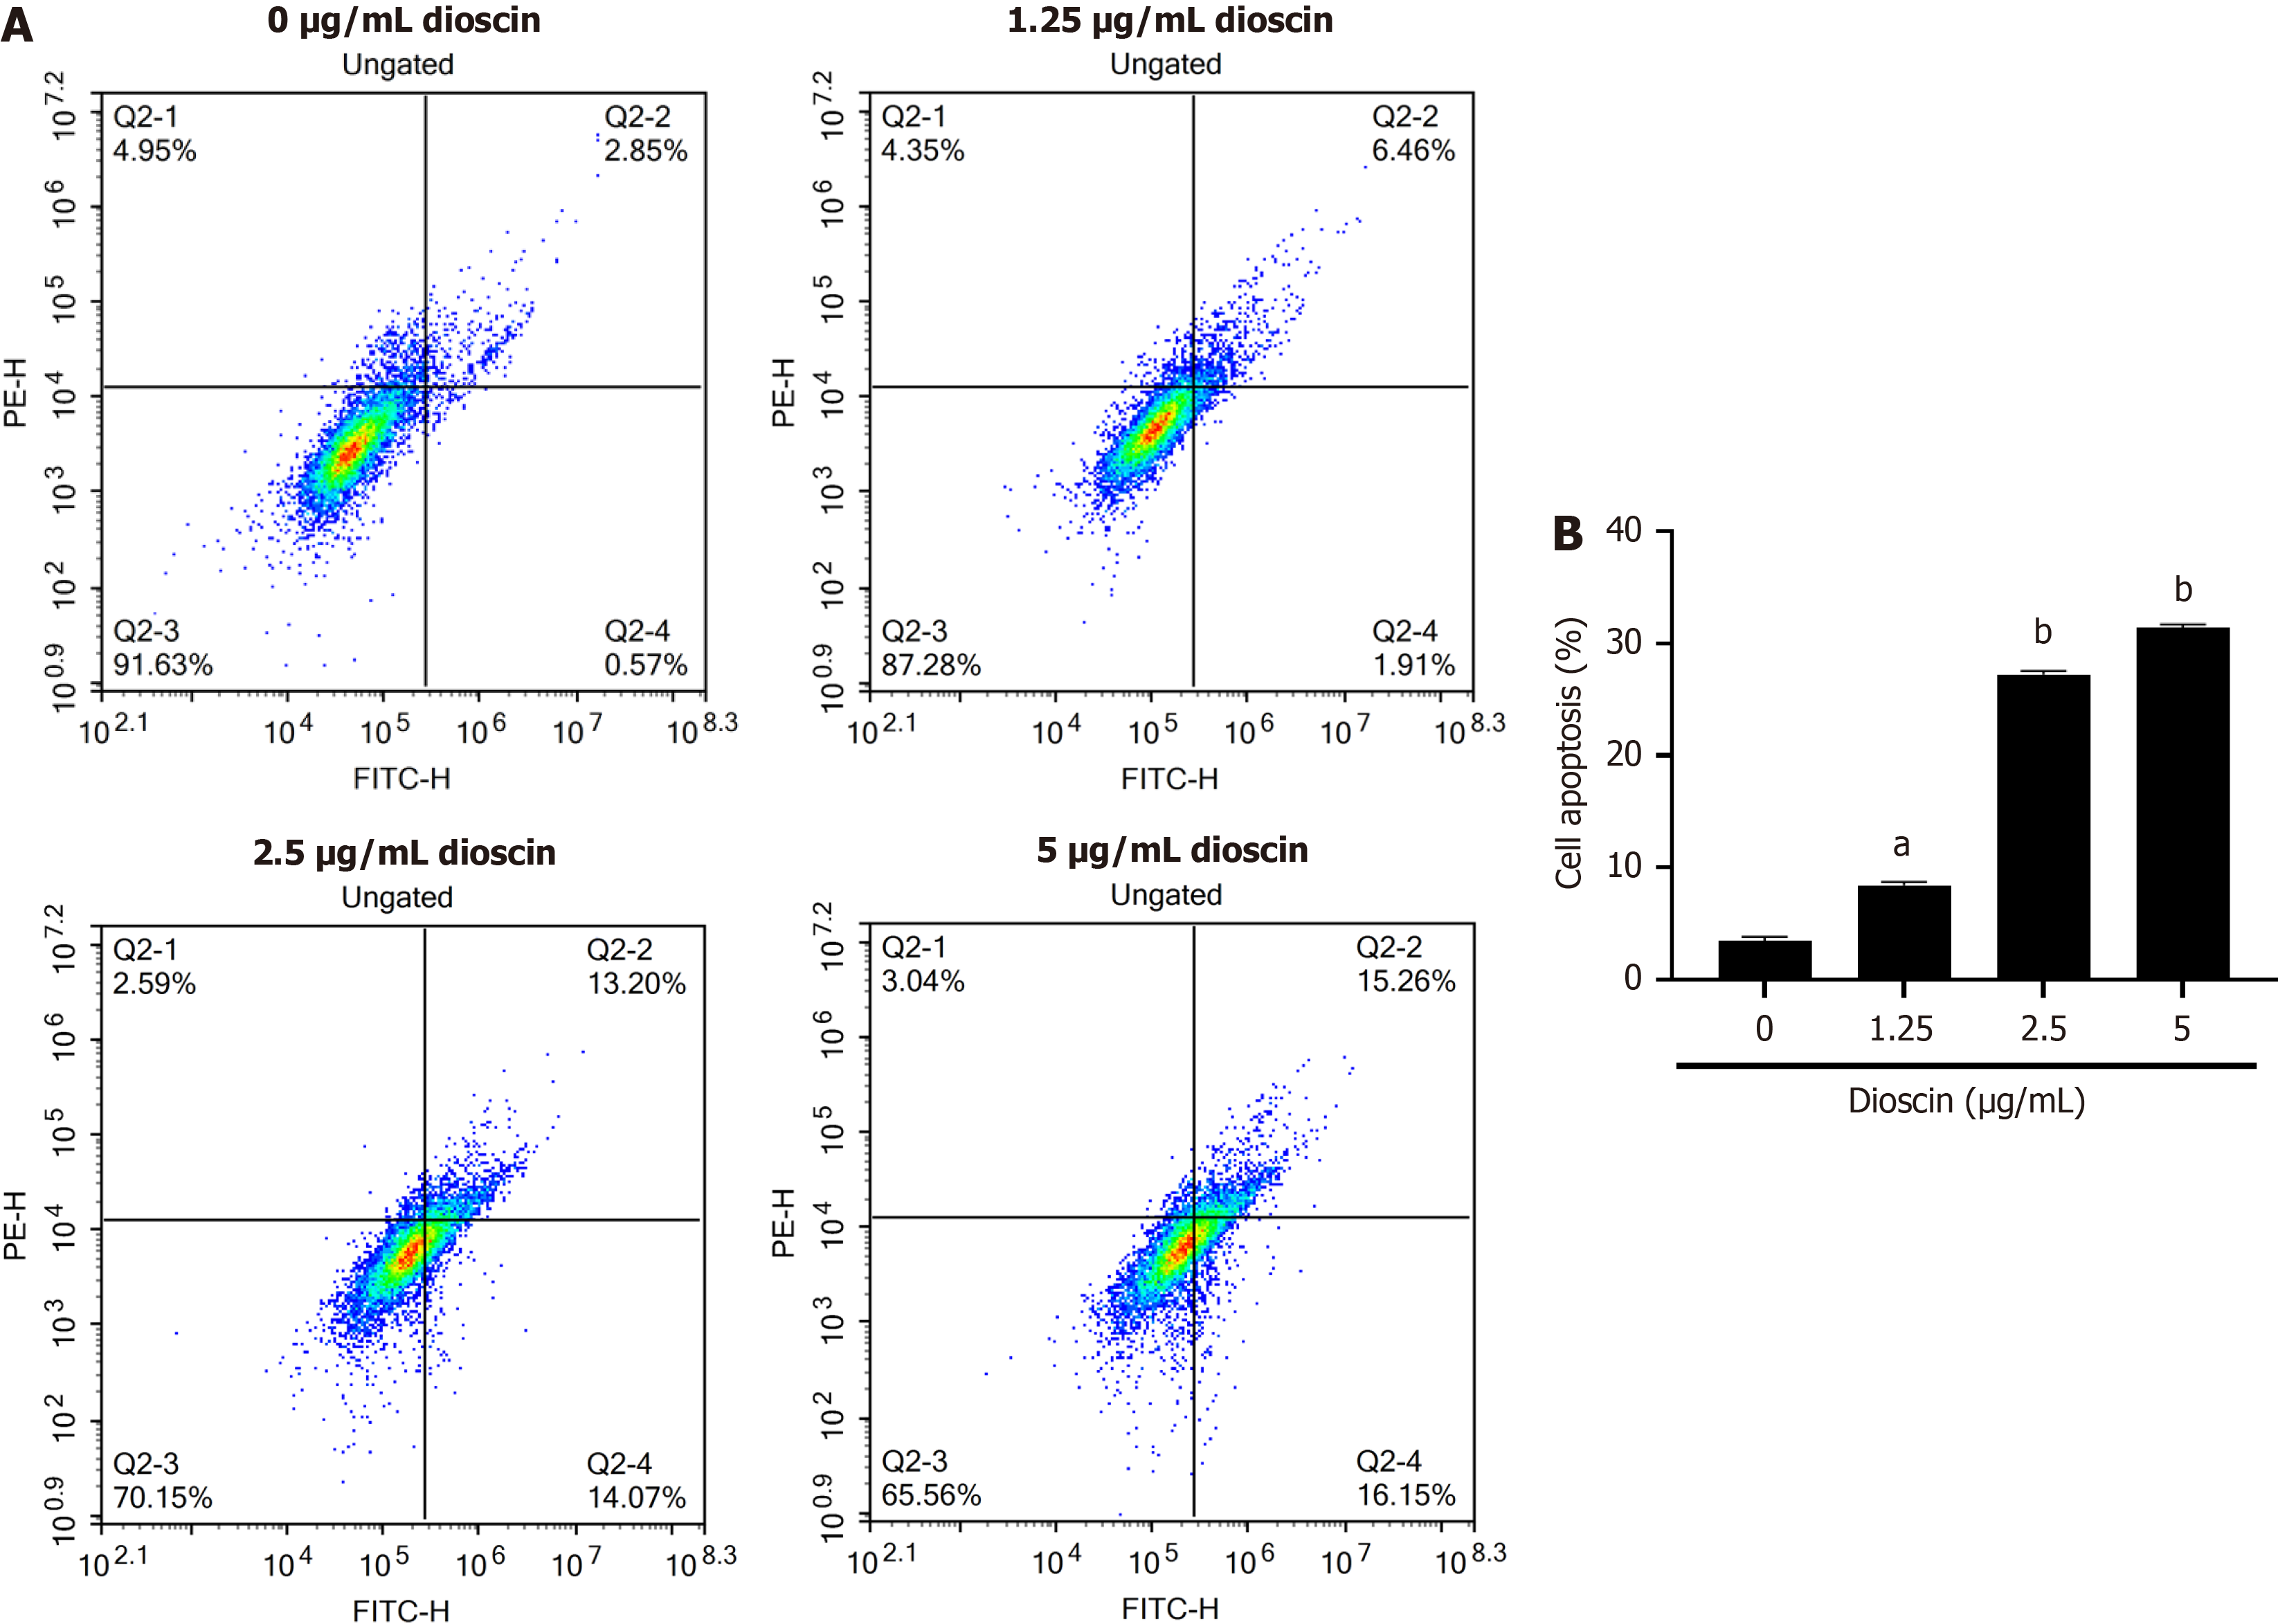
Figure 2 Effect of dioscin on HCT116 cell apoptosis.
A: Annexin V-FITC and PI staining was utilized to assess apoptosis in various concentrations (0, 1.25, 2.5 and 5 μg/mL) of dioscin-treated HCT116 cells after 48 hours by using flow cytometry; B: Quantification of apoptosis in HCT116 cells. Three biological repeats were reported as mean ± SD. aP < 0.01, bP < 0.001 compare to the control group.
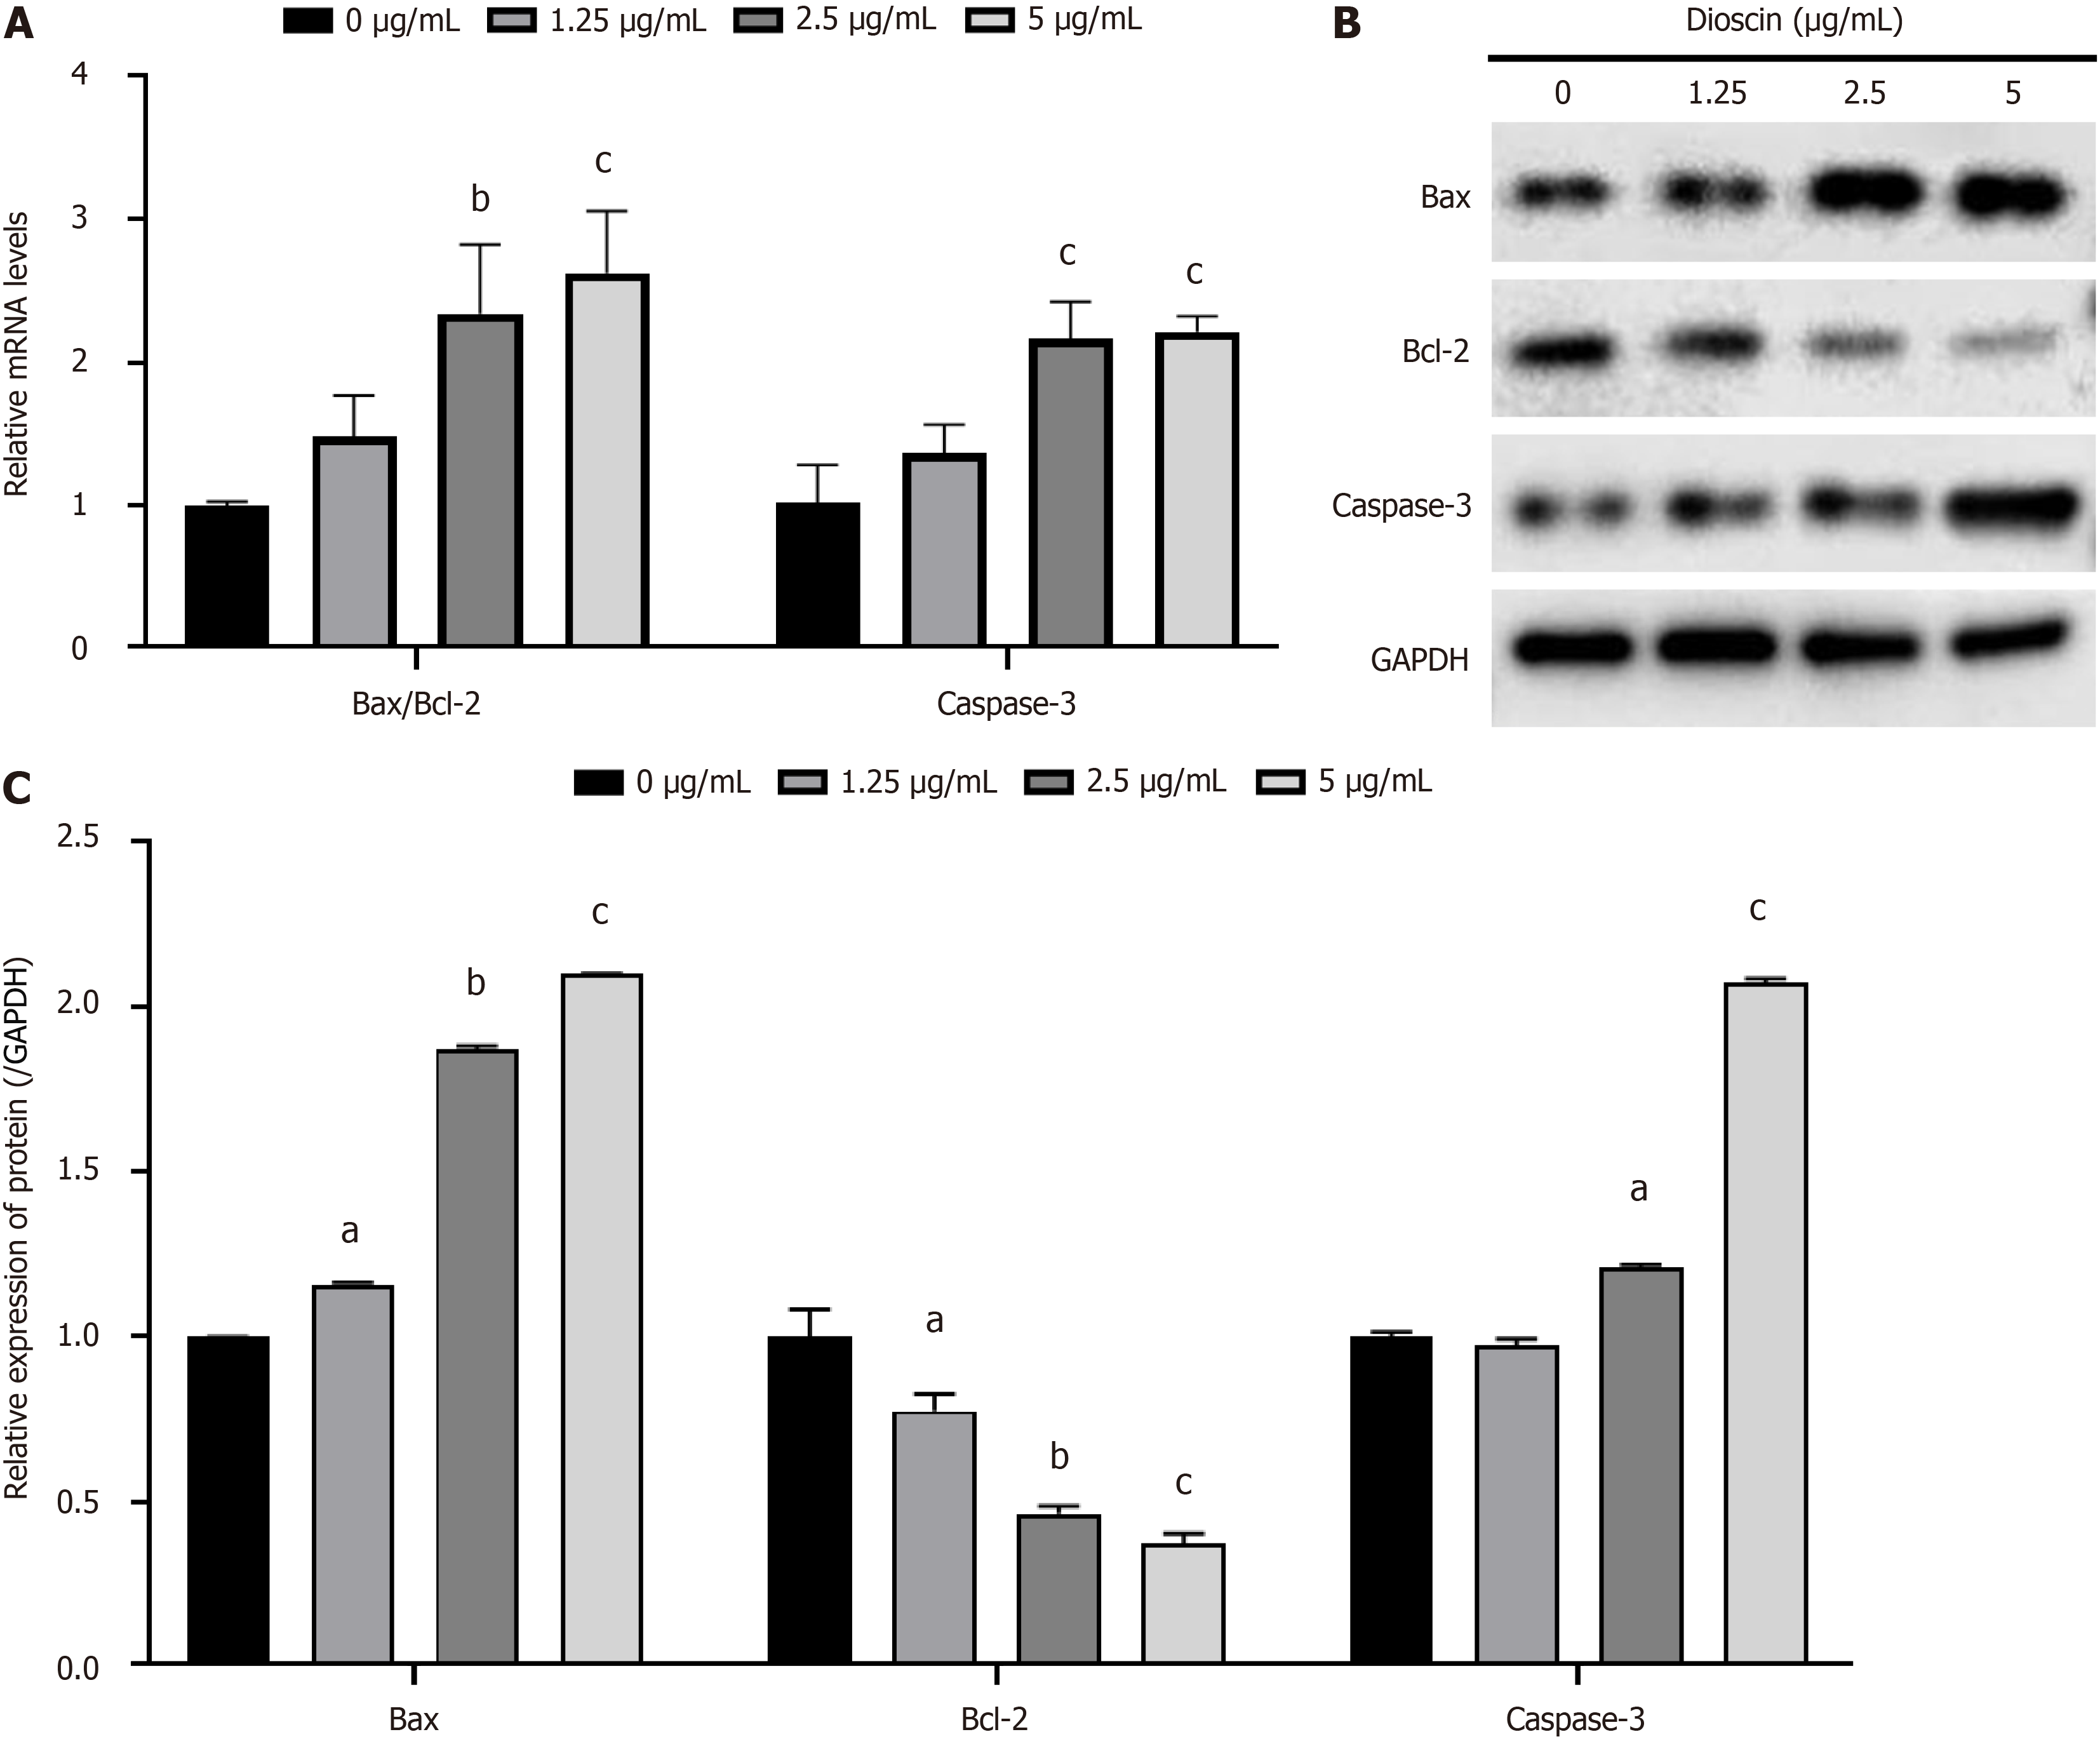
Figure 3 Effect of dioscin on apoptotic gene and protein expression in HCT116 cells.
HCT116 cells were exposed to varying concentrations of dioscin (1.25, 2.5 and 5 μg/mL) for 48 hours. A: RT-qPCR study of Bax/Bcl-2 ratio as well as Caspase-3 mRNA expression; B: Western blot examination of the expression of the proteins Caspase-3, Bcl-2, and Bax; C: Quantification of Caspase-3, Bcl-2, and Bax protein expression levels from the Western blot results. Three biological repeats were reported in mean ± SD format. aP < 0.05, bP < 0.01, cP < 0.001 compare to the control group.
Figure 4 Effect of dioscin on HCT116 cells’ invasion (40 ×).
A: Transwell method was used to explore the relationship between diosgenin and HCT116 cell invasion and clarify the inhibitory effect of the former on the latter; B: Quantification of HCT116 cell invasion after diosgenin treatment using the Transwell assay. Three biological repeats were used and reported as mean ± SD. aP < 0.05, bP < 0.01 compare to the control group.
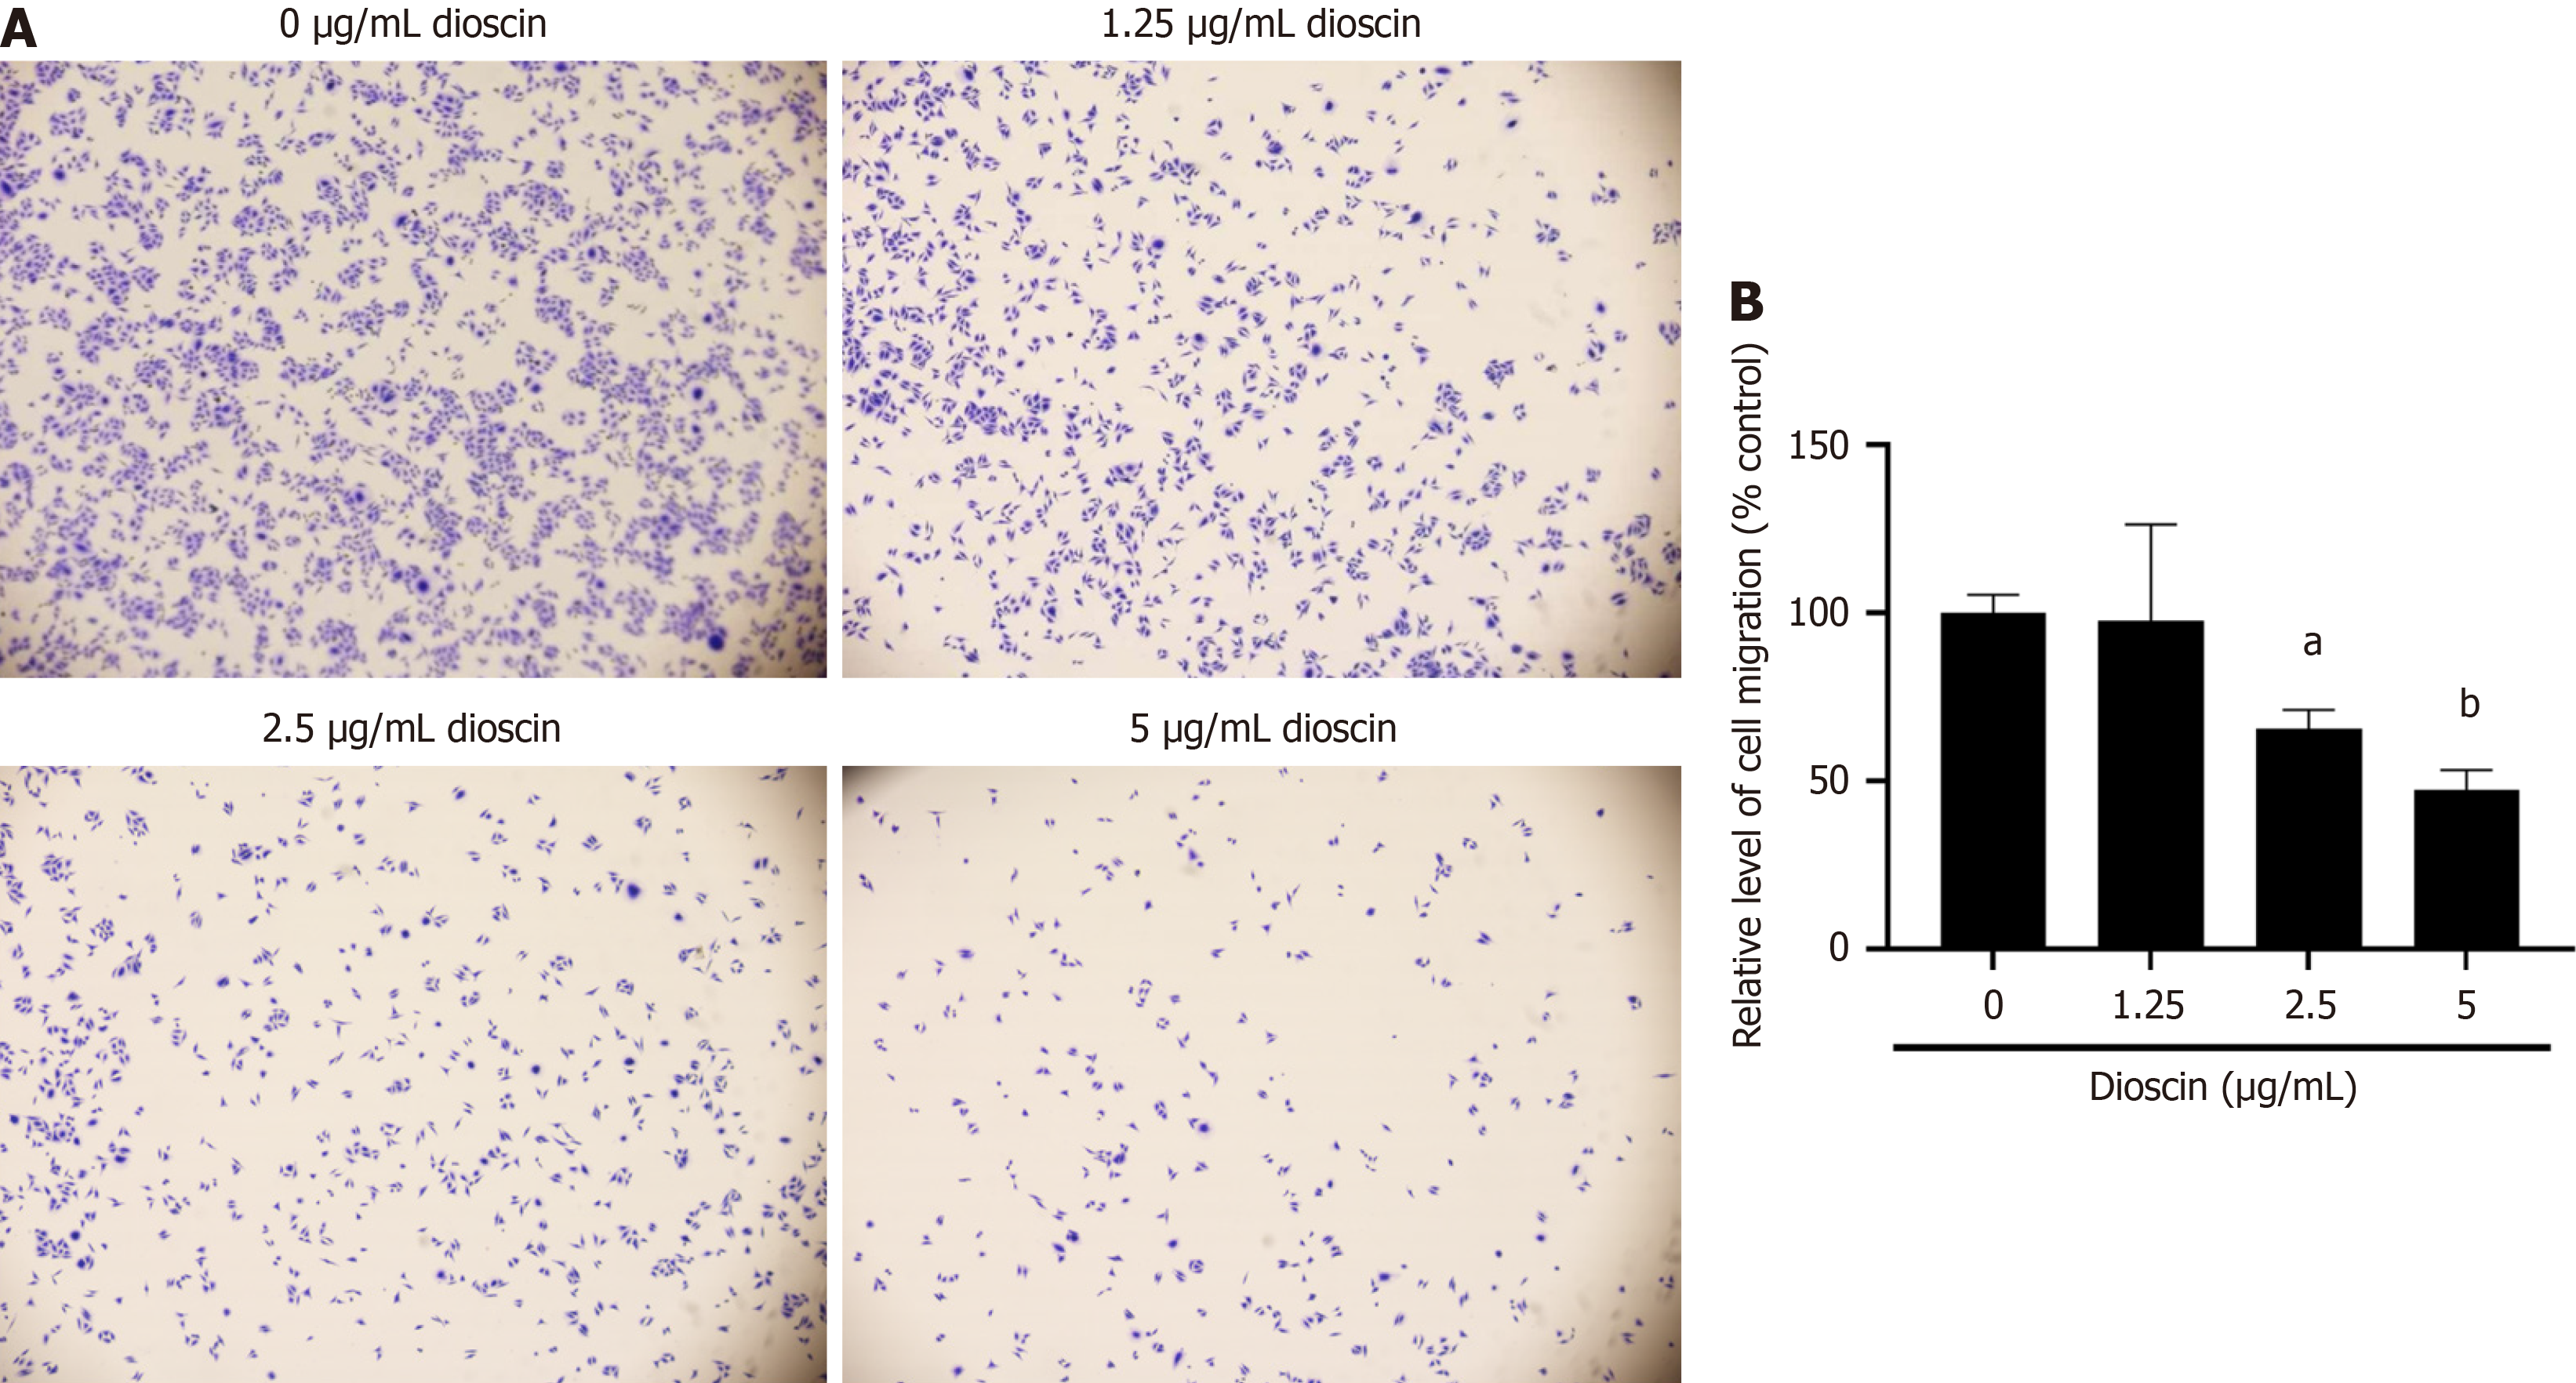
Figure 5 Effect of dioscin on HCT116 cells’ migration (100 ×).
A: Wound healing assay was conducted to explore the relationship between diosgenin and HCT116 cell migration and clarify the inhibitory effect of the former on the latter; B: Quantification of HCT116 cell migration following diosgenin treatment using the wound healing assay. Three biological repeats were used and reported as mean ± SD. aP < 0.05, bP < 0.01, cP < 0.001 compare to the control group.
Figure 6 Effect of dioscin on HCT116 cells' expression of Notch 1 signaling pathway-related proteins.
A: Cells were treated with dioscin for 48 hours. Western blot analysis was conducted to determine protein levels, with GAPDH as control; B: Quantification of protein expression levels from the Western blot results. Three biological repeats were used and reported as mean ± SD. aP < 0.05, bP < 0.01, cP < 0.001 compare to the control group.
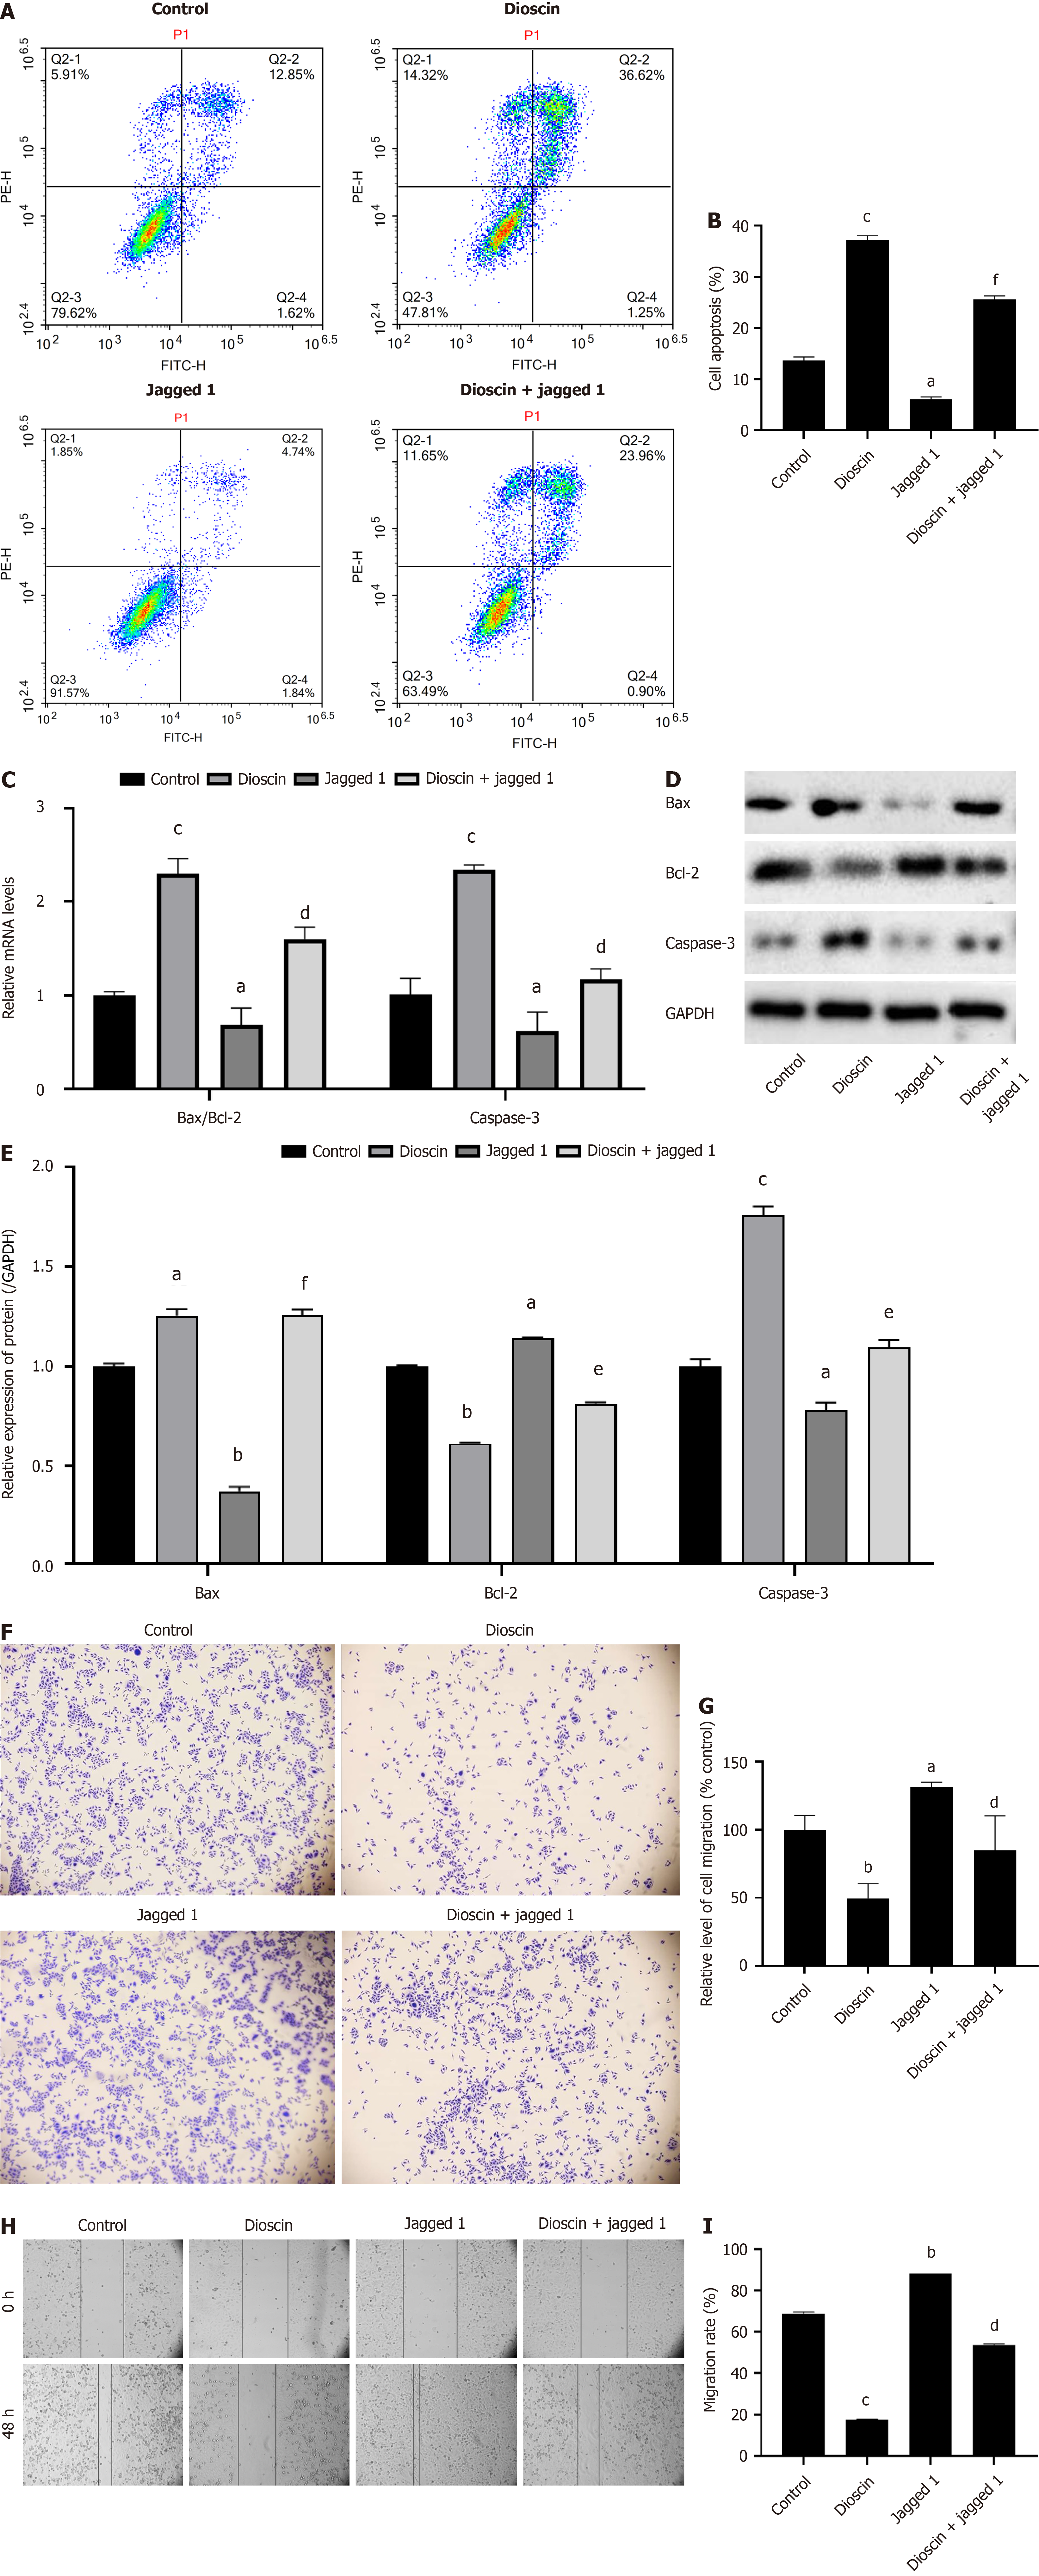
Figure 7 Notch 1 is involved in the inhibitory effect of dioscin on HCT116.
HCT116 cells were treated with dioscin (5 μg/mL), Jagged 1 (5 μg/mL), dioscin (2.5 μg/mL) + Jagged 1 (5 μg/mL) for 48 hours. A: Apoptosis in HCT116 cells was revealed using flow cytometry as well as annexin V-FITC as well as PI staining methods; B: Quantification of apoptosis in HCT116 cells from flow cytometry results; C: RT qPCR analysis was performed using caspase-3 mRNA expression and Bax/Bcl-2 ratio; D: Expression levels of Bax, Bcl-2, as well as other proteins were detected using Western blot analysis; E: Quantification of Bax, Bcl-2, and other protein expression levels from the Western blot analysis; F: Transwell method was used to detect the level of inhibition of HCT116 cell invasion; G: Quantification of HCT116 cell invasion inhibition following dioscin treatment using the Transwell assay; H: Wound healing assay was used to detect the inhibition of HCT116 cell migration; I: Quantification of HCT116 cell migration inhibition following treatment using the wound healing assay. Three biological repeats were used and reported as mean ± SD. aP < 0.05, bP < 0.01, cP < 0.001 compare to the control group, dP < 0.05, eP < 0.01, fP < 0.01 compare to the dioscin group.
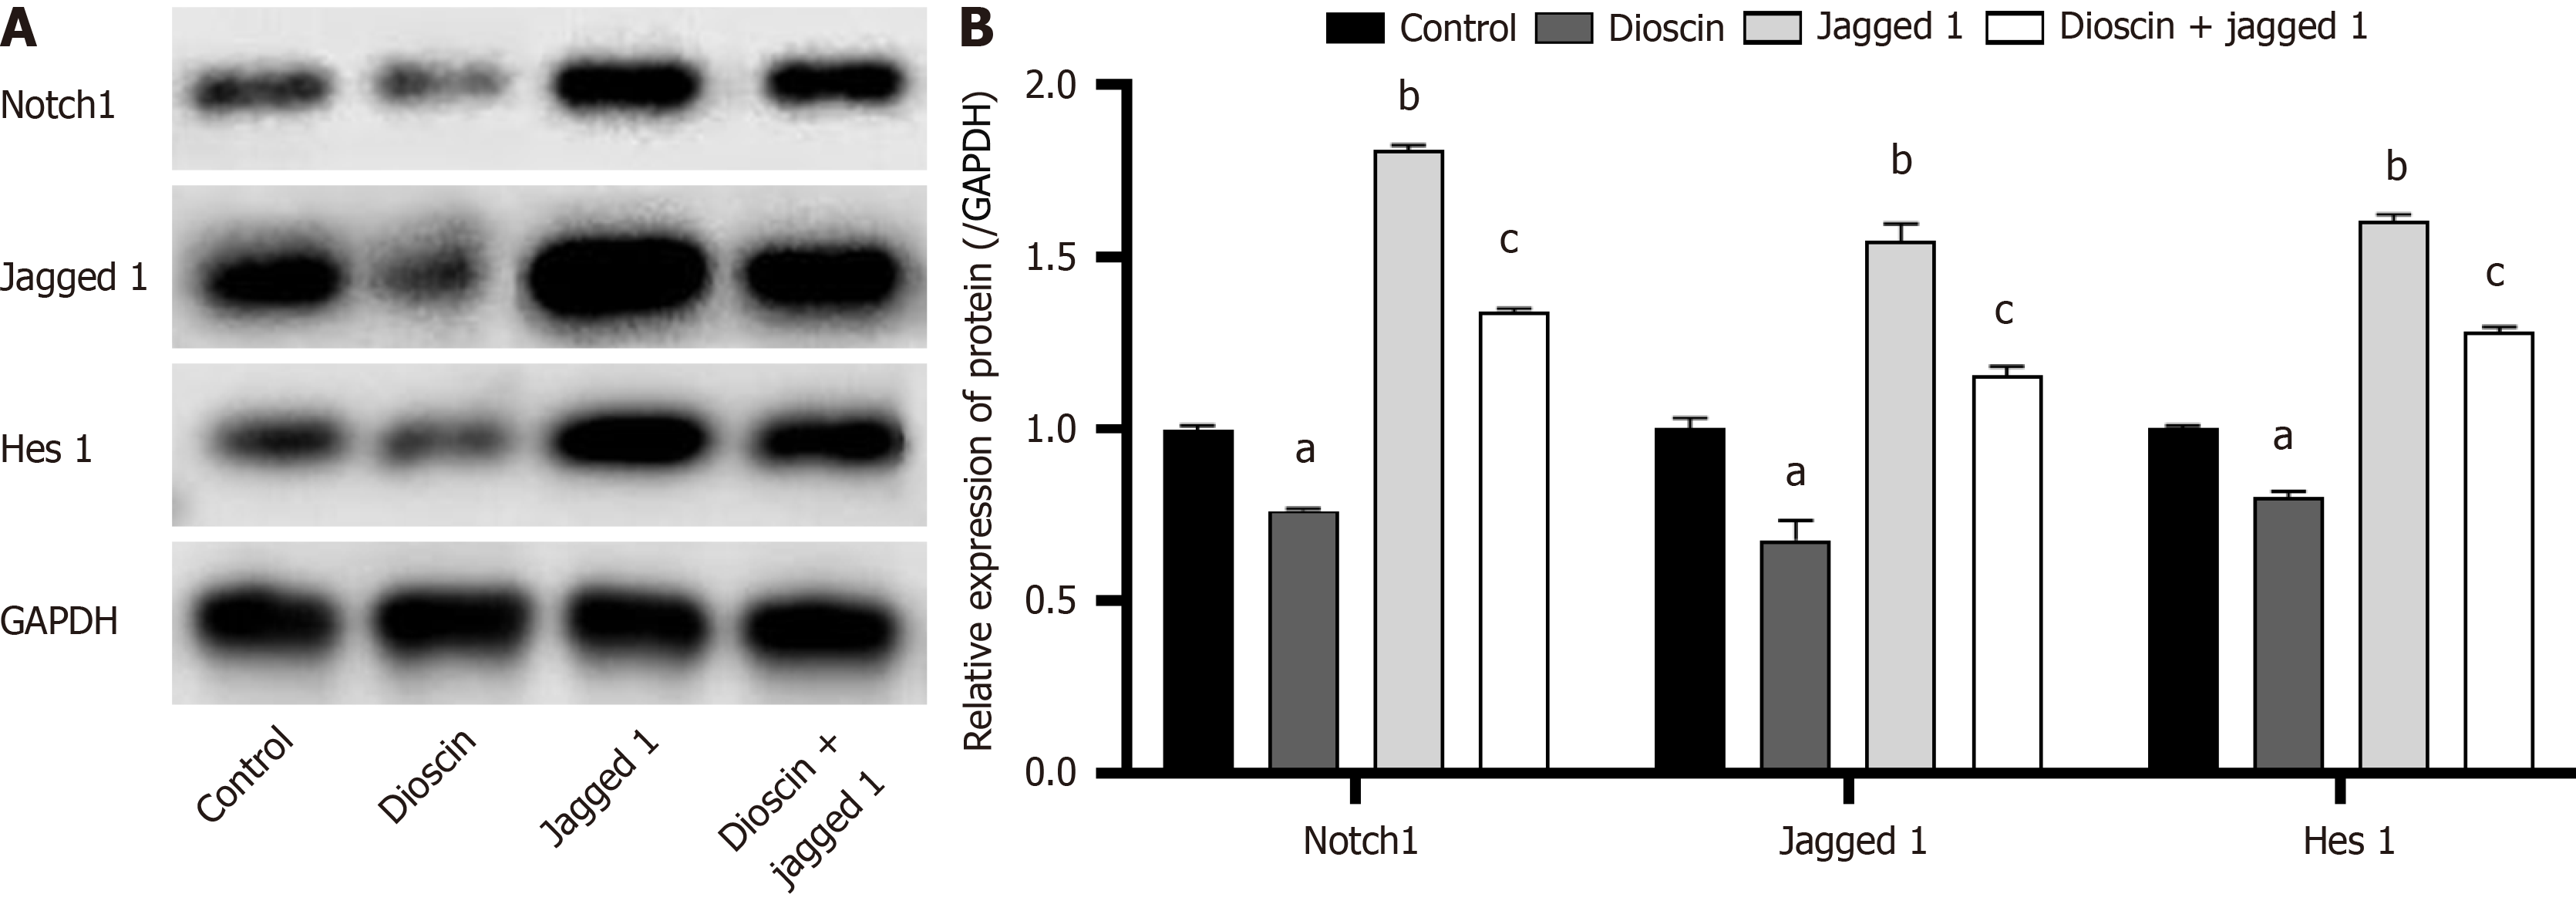
Figure 8 Notch 1 participates in the inhibitory effect of dioscin on the Notch 1/Hes 1 pathway.
A: Western blot analysis was adopted to dig up protein expression levels, with GADPH as the control; B: Quantification of protein expression levels from Western blot analysis. Three biological repeats were used and reported as mean ± SD. aP < 0.05, bP < 0.01 compare to the control group, cP < 0.05 compare to the dioscin group.
- Citation: Cai XX, Huang ZF, Tu FY, Yu J. Impact and mechanism study of dioscin on biological characteristics of colorectal cancer cells. World J Gastrointest Oncol 2024; 16(11): 4456-4467
- URL: https://www.wjgnet.com/1948-5204/full/v16/i11/4456.htm
- DOI: https://dx.doi.org/10.4251/wjgo.v16.i11.4456


