Copyright
©The Author(s) 2023.
World J Gastrointest Oncol. Aug 15, 2023; 15(8): 1412-1423
Published online Aug 15, 2023. doi: 10.4251/wjgo.v15.i8.1412
Published online Aug 15, 2023. doi: 10.4251/wjgo.v15.i8.1412
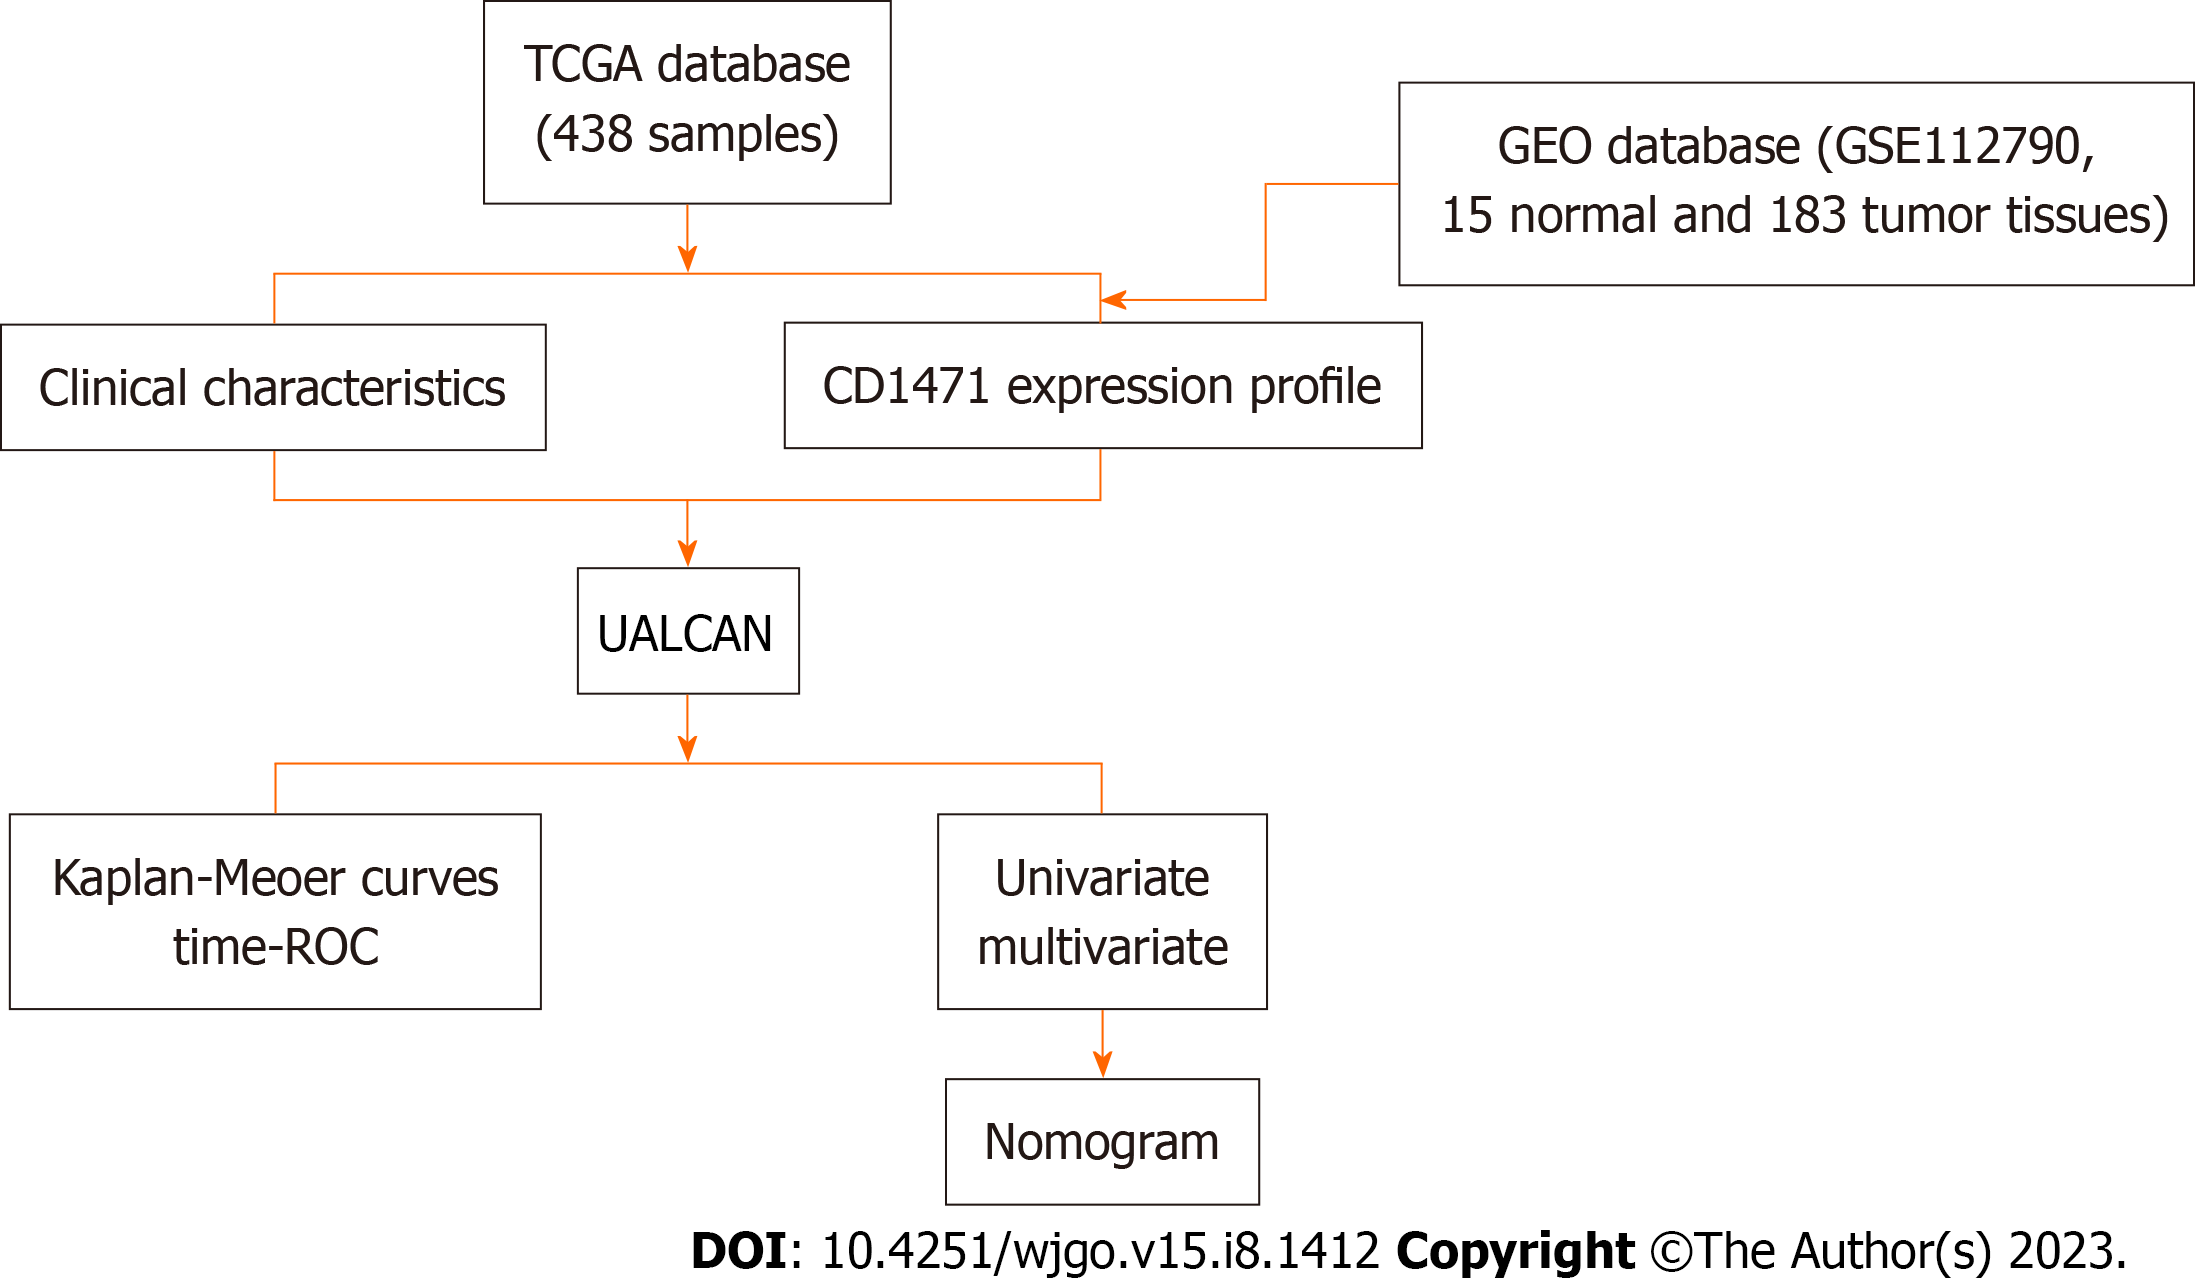
Figure 1 Data collection and workflow.
CD147: Cluster of differentiation 147; GEO: Gene Expression Omnibus; ROC: Receiver operating characteristic; TCGA: The Cancer Genome Atlas.
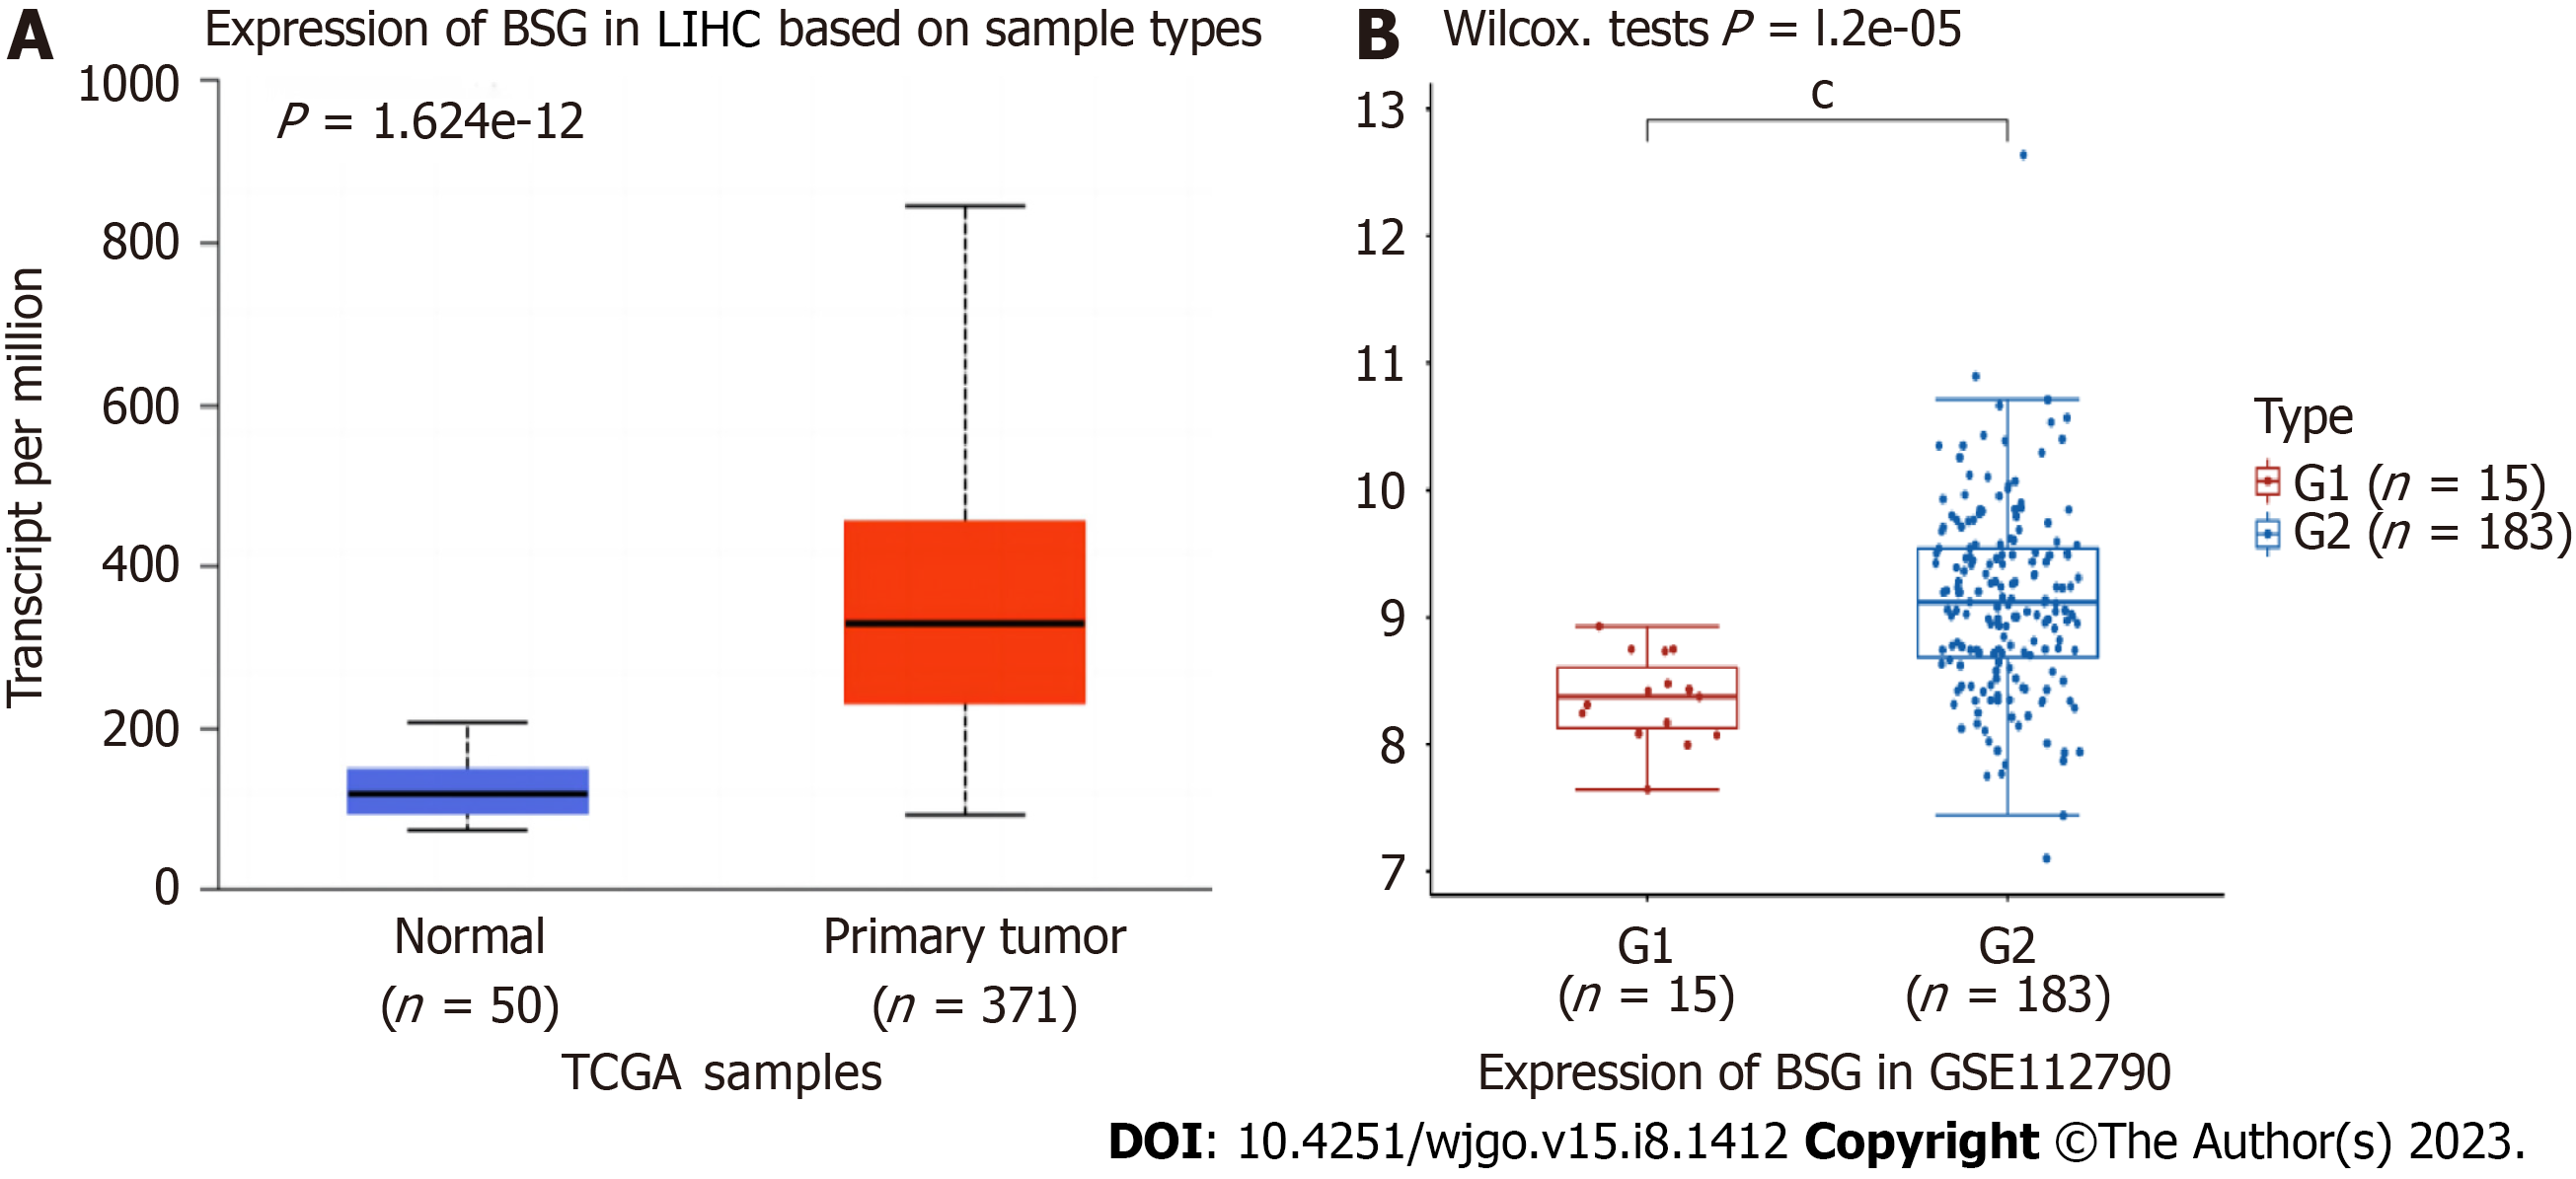
Figure 2 Expression of cluster of differentiation 147 in hepatocellular carcinoma.
A: Expression of cluster of differentiation 147 in hepatocellular carcinoma samples (50 normal samples and 371 tumor samples) from The Cancer Genome Atlas (TCGA) database (normal vs tumor, P = 1.624 × 10⁻¹²); B: Expression of cluster of differentiation 147 in hepatocellular carcinoma samples (15 normal and 183 tumor) from the Gene Expression Omnibus database (normal vs tumor, P = 1.2 × 10⁻⁵). cP < 0.001. BSG: Basigin.
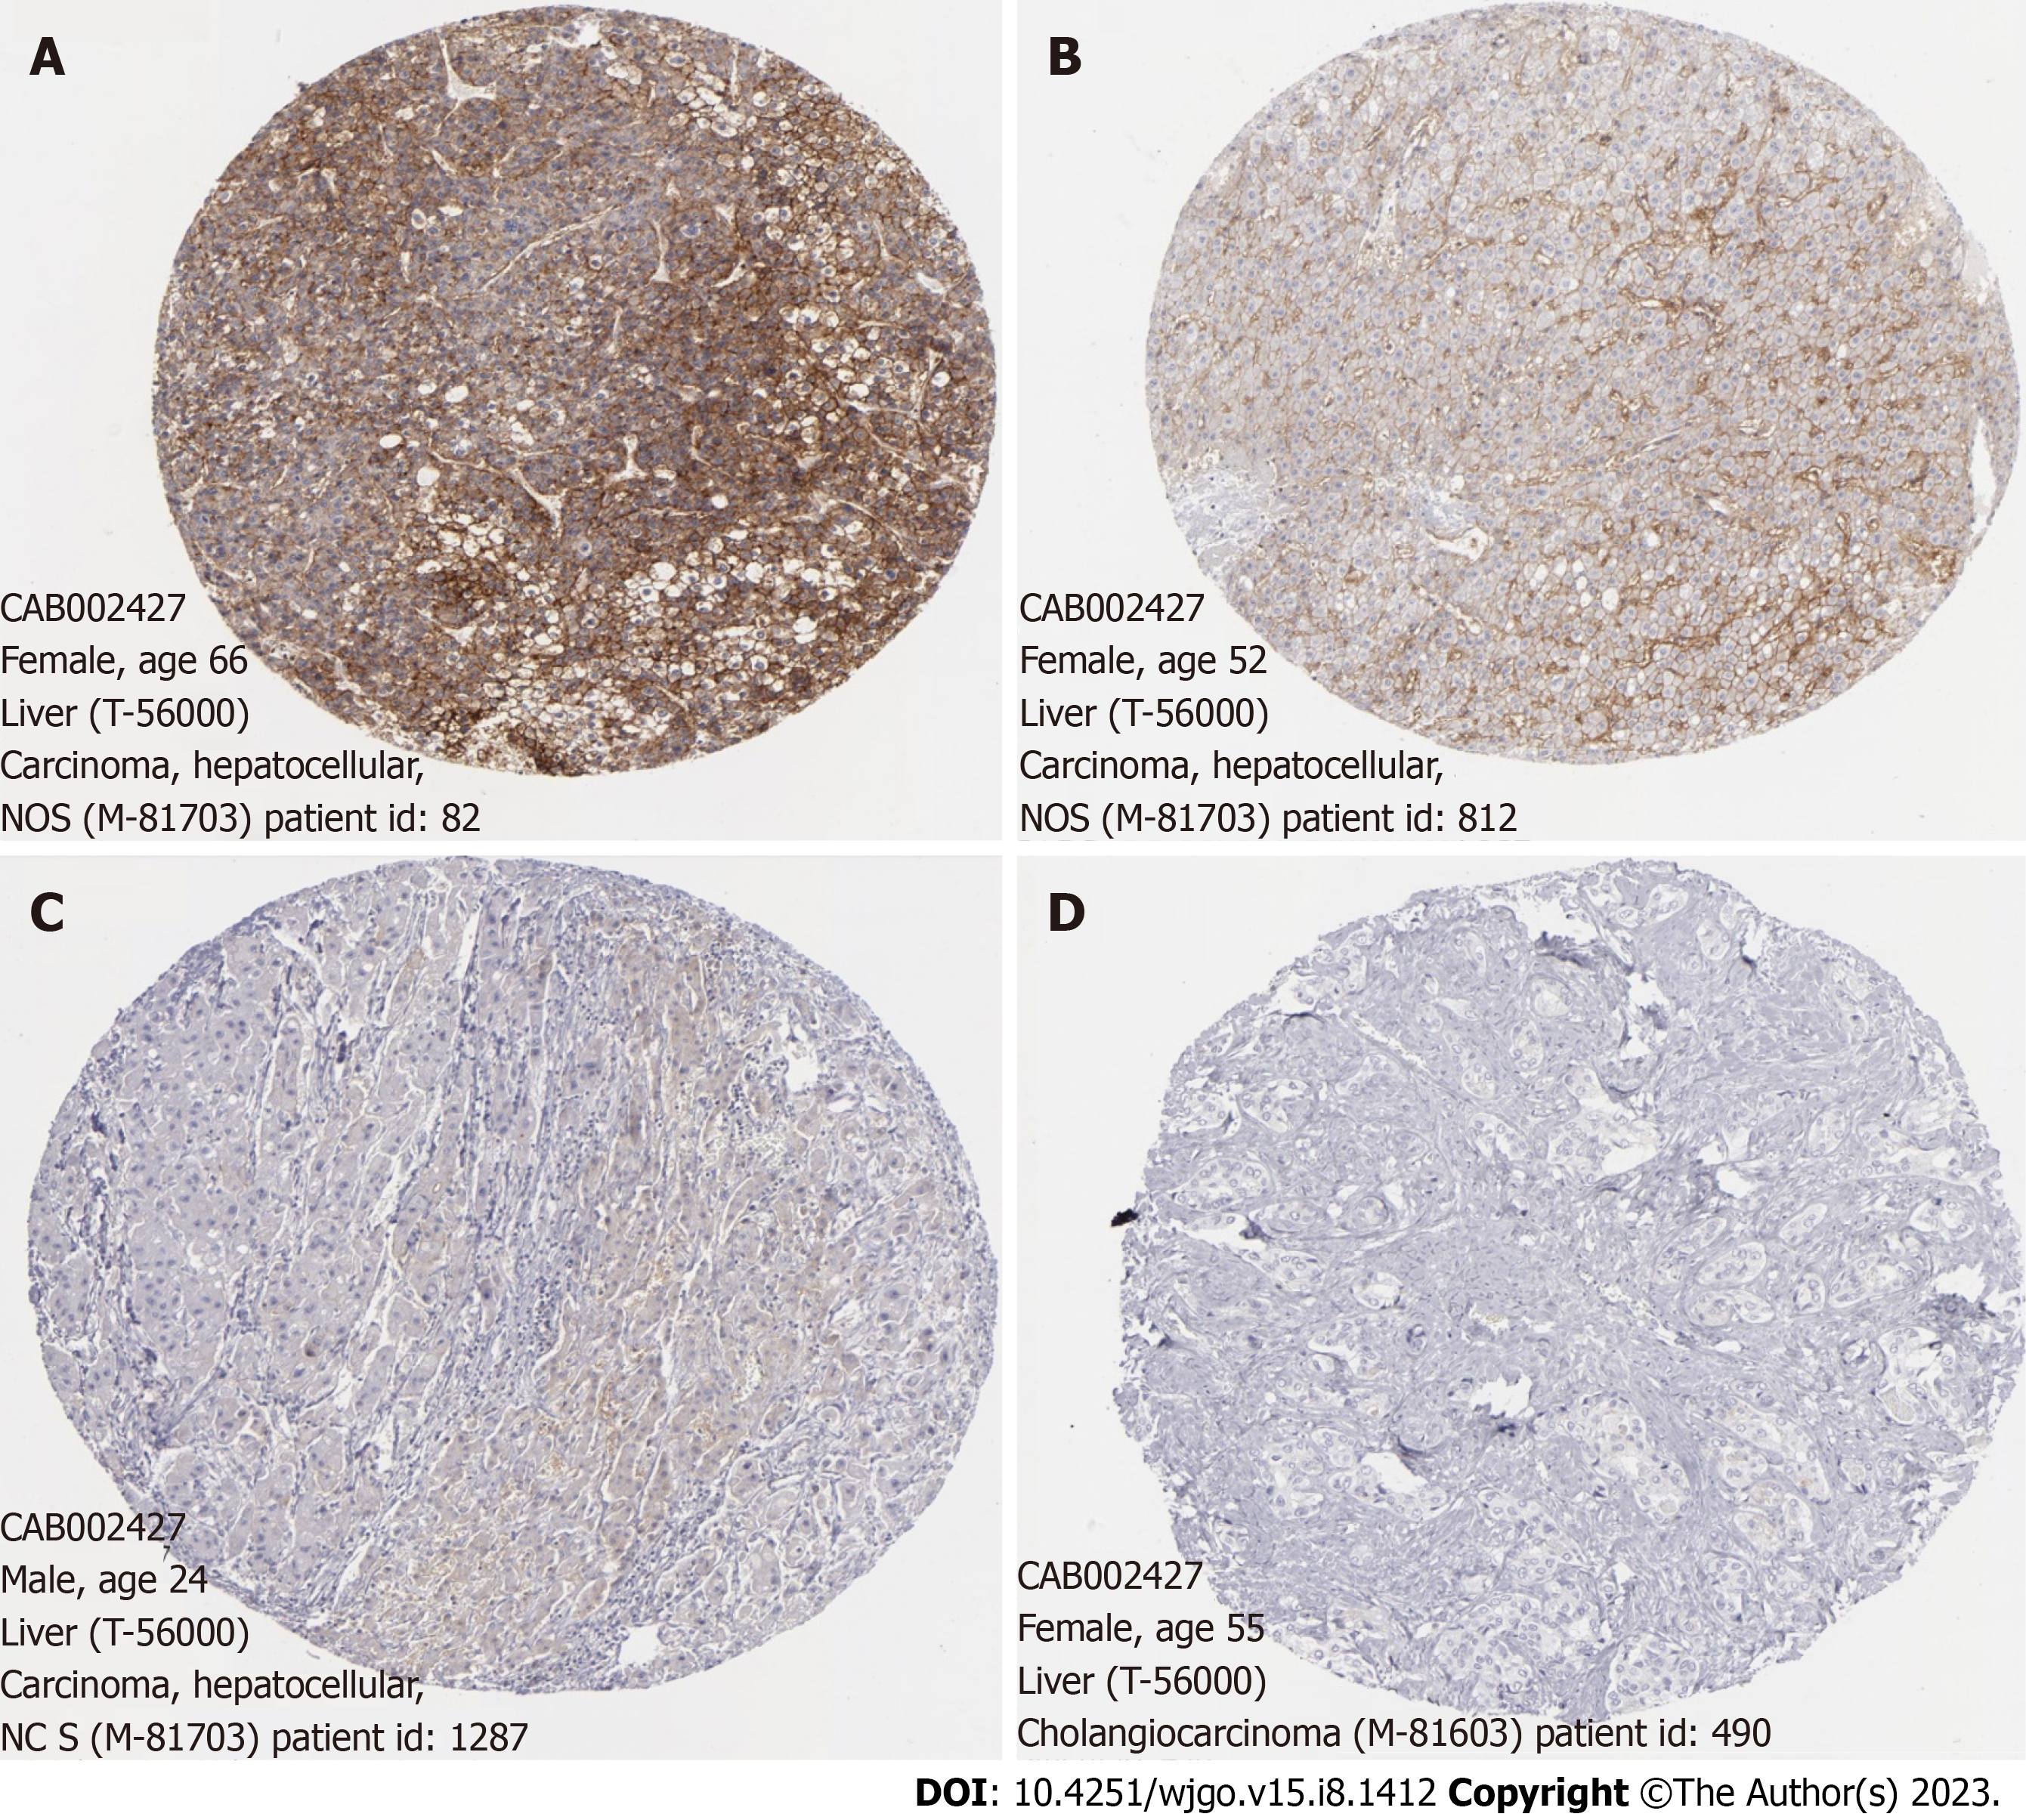
Figure 3 Immunohistochemistry of cluster of differentiation 147 in hepatocellular carcinoma from the Human Protein Atlas.
A: Cluster of differentiation 147 (CD147) is highly expressed in hepatocellular carcinoma (HCC); B: CD147 has medium expression in HCC; C: CD147 has low expression in HCC; D: CD147 was not detected in HCC.
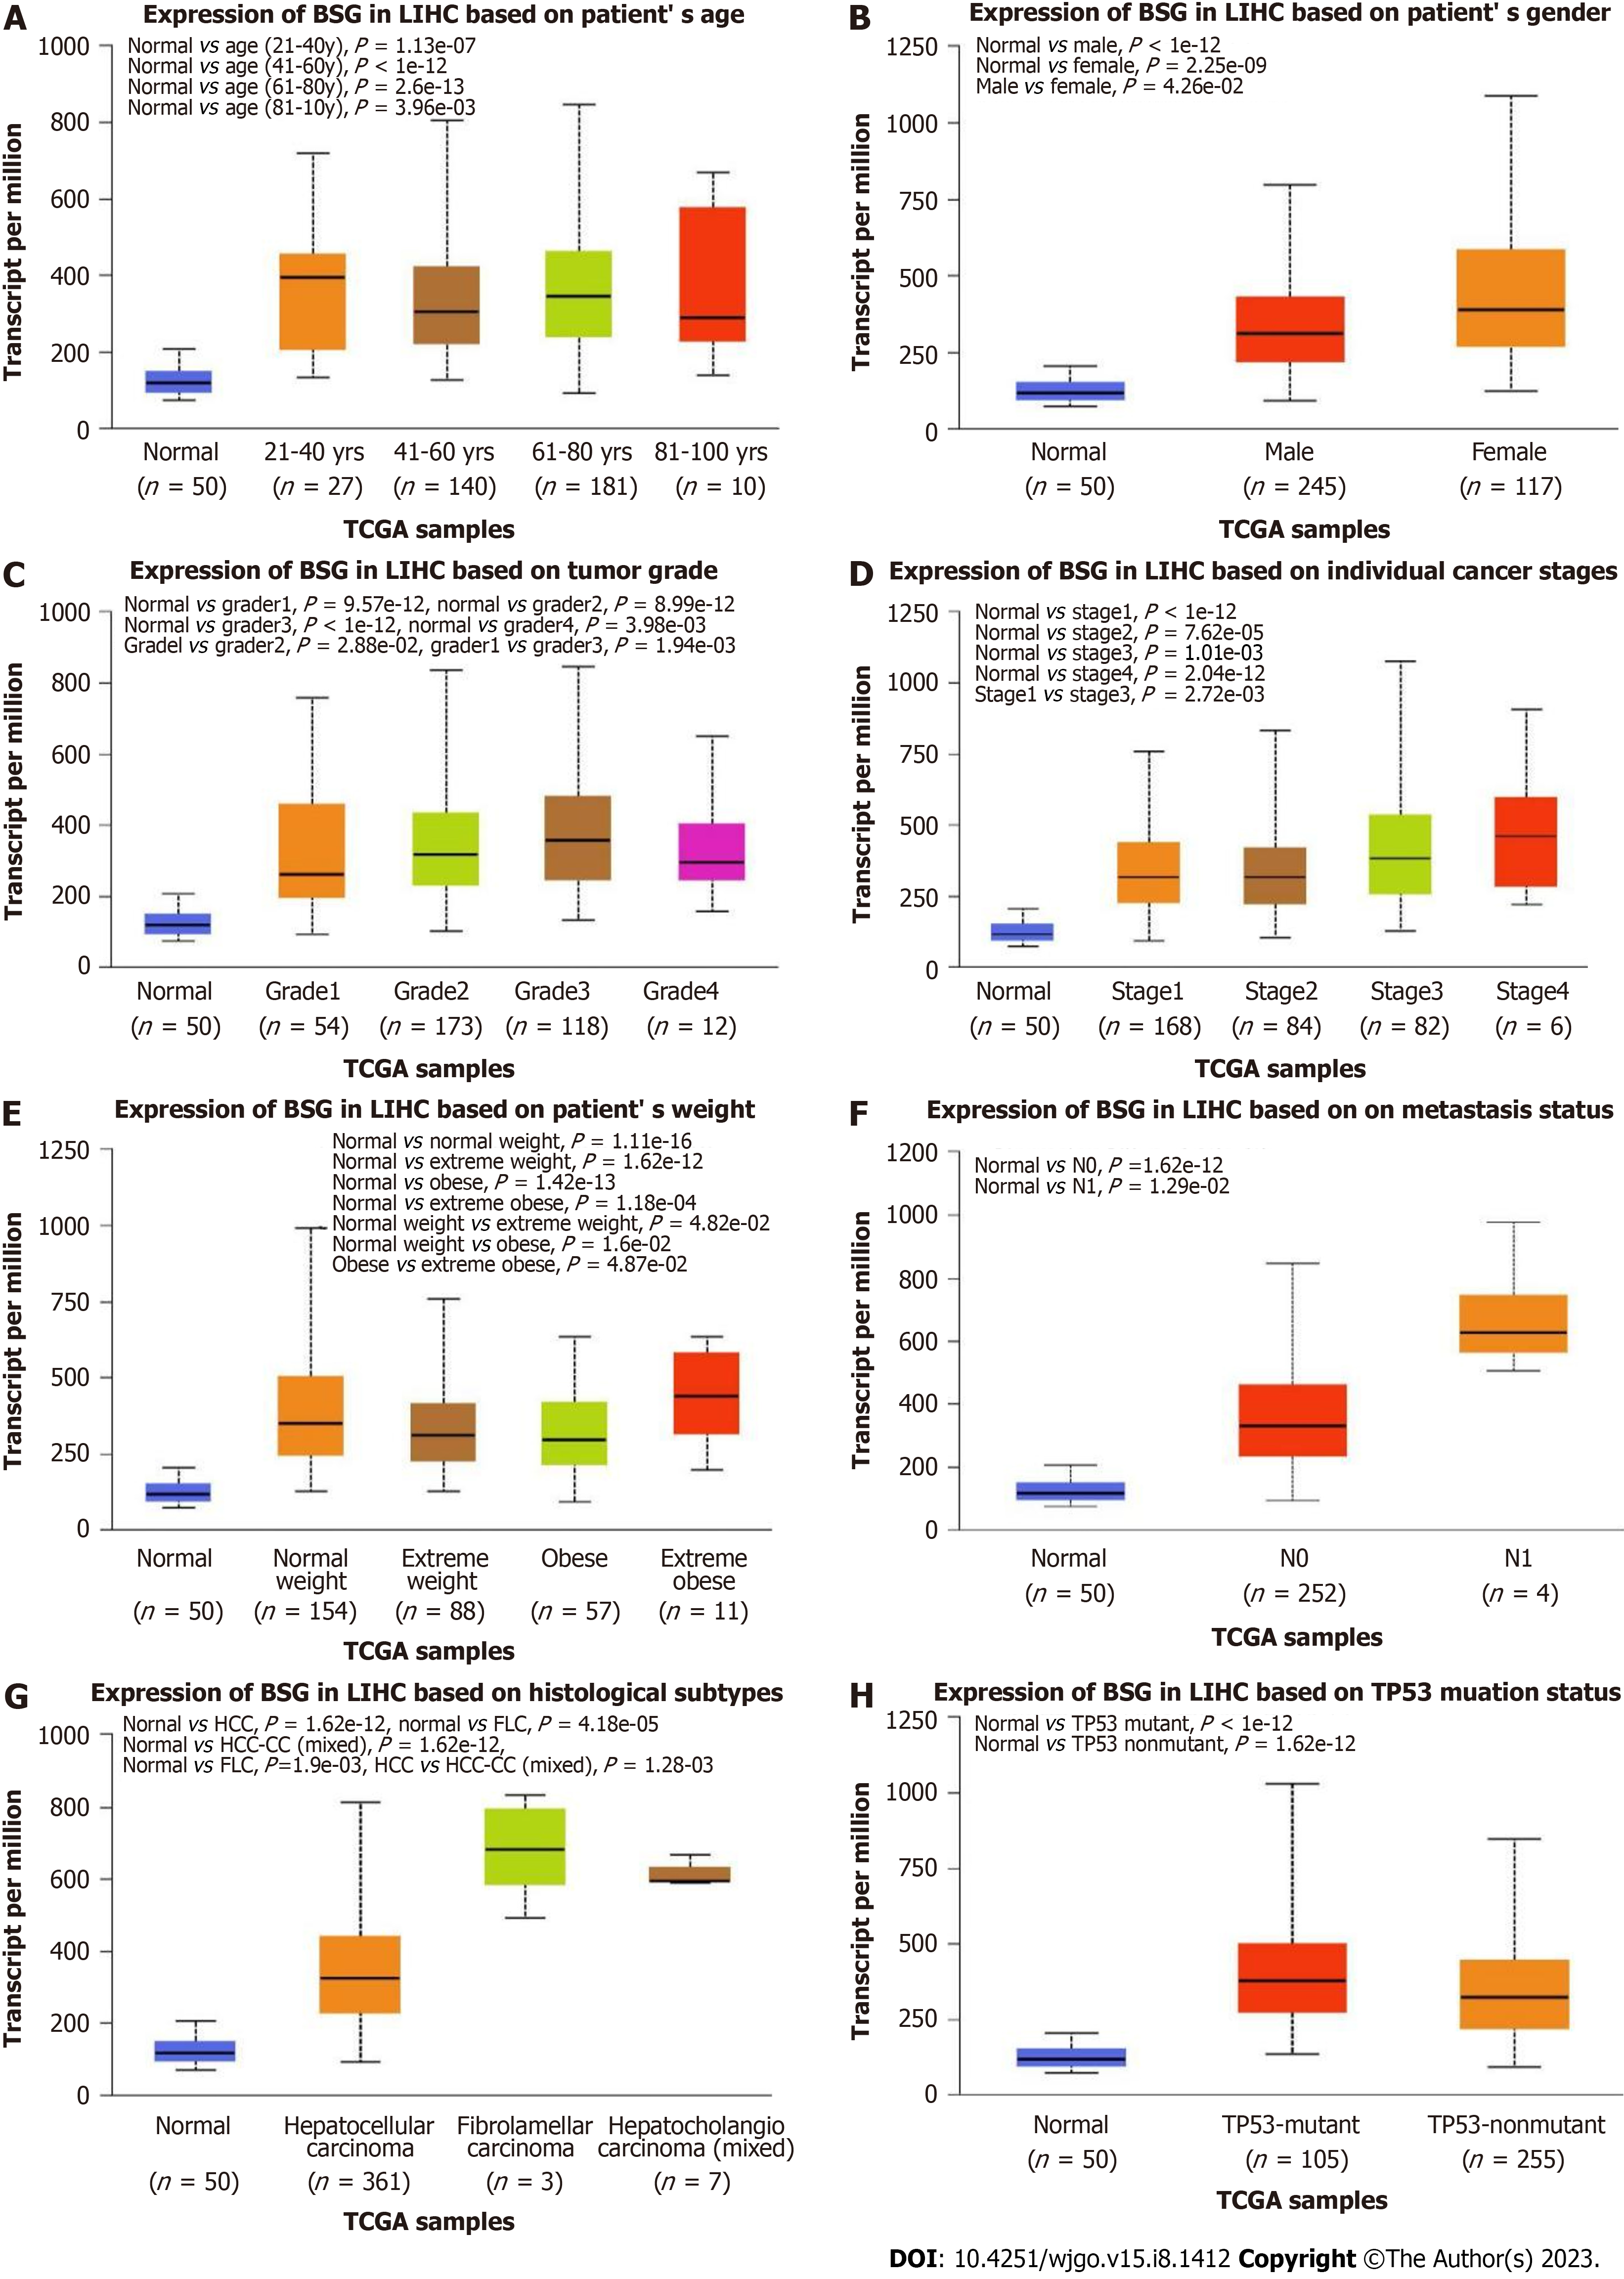
Figure 4 Expression of cluster of differentiation 147 in hepatocellular carcinoma clinical characteristics from The Cancer Genome Atlas database.
A: Normal vs age, P < 0.05; B: Normal vs sex, P < 0.05; male vs female, P = 4.26 × 10⁻²; C: Normal vs tumor grade, P < 0.05; grade 1 vs grade 2, P = 2.88 × 10⁻²; grade 1 vs grade 3, P = 1.94 × 10⁻³; D: Normal vs stage, P < 0.05; stage 1 vs stage 3, P = 2.72 × 10⁻³; E: Normal vs weight, P < 0.05; F: Normal vsN (0 and 1), P < 0.05; G: Normal vs histological; H: Normal vs TP53 mutant, P < 1 × 10-12; normal vs TP53 nonmutant, P = 1.62 × 10⁻¹². Normal weight: Body mass index between 18.5 and 25; Extreme weight: Body mass index between 25 and 30; Obese: Body mass index between 30 and 40; Extreme obese: Body mass index greater than 40. BSG: Basigin; TCGA: The Cancer Genome Atlas.
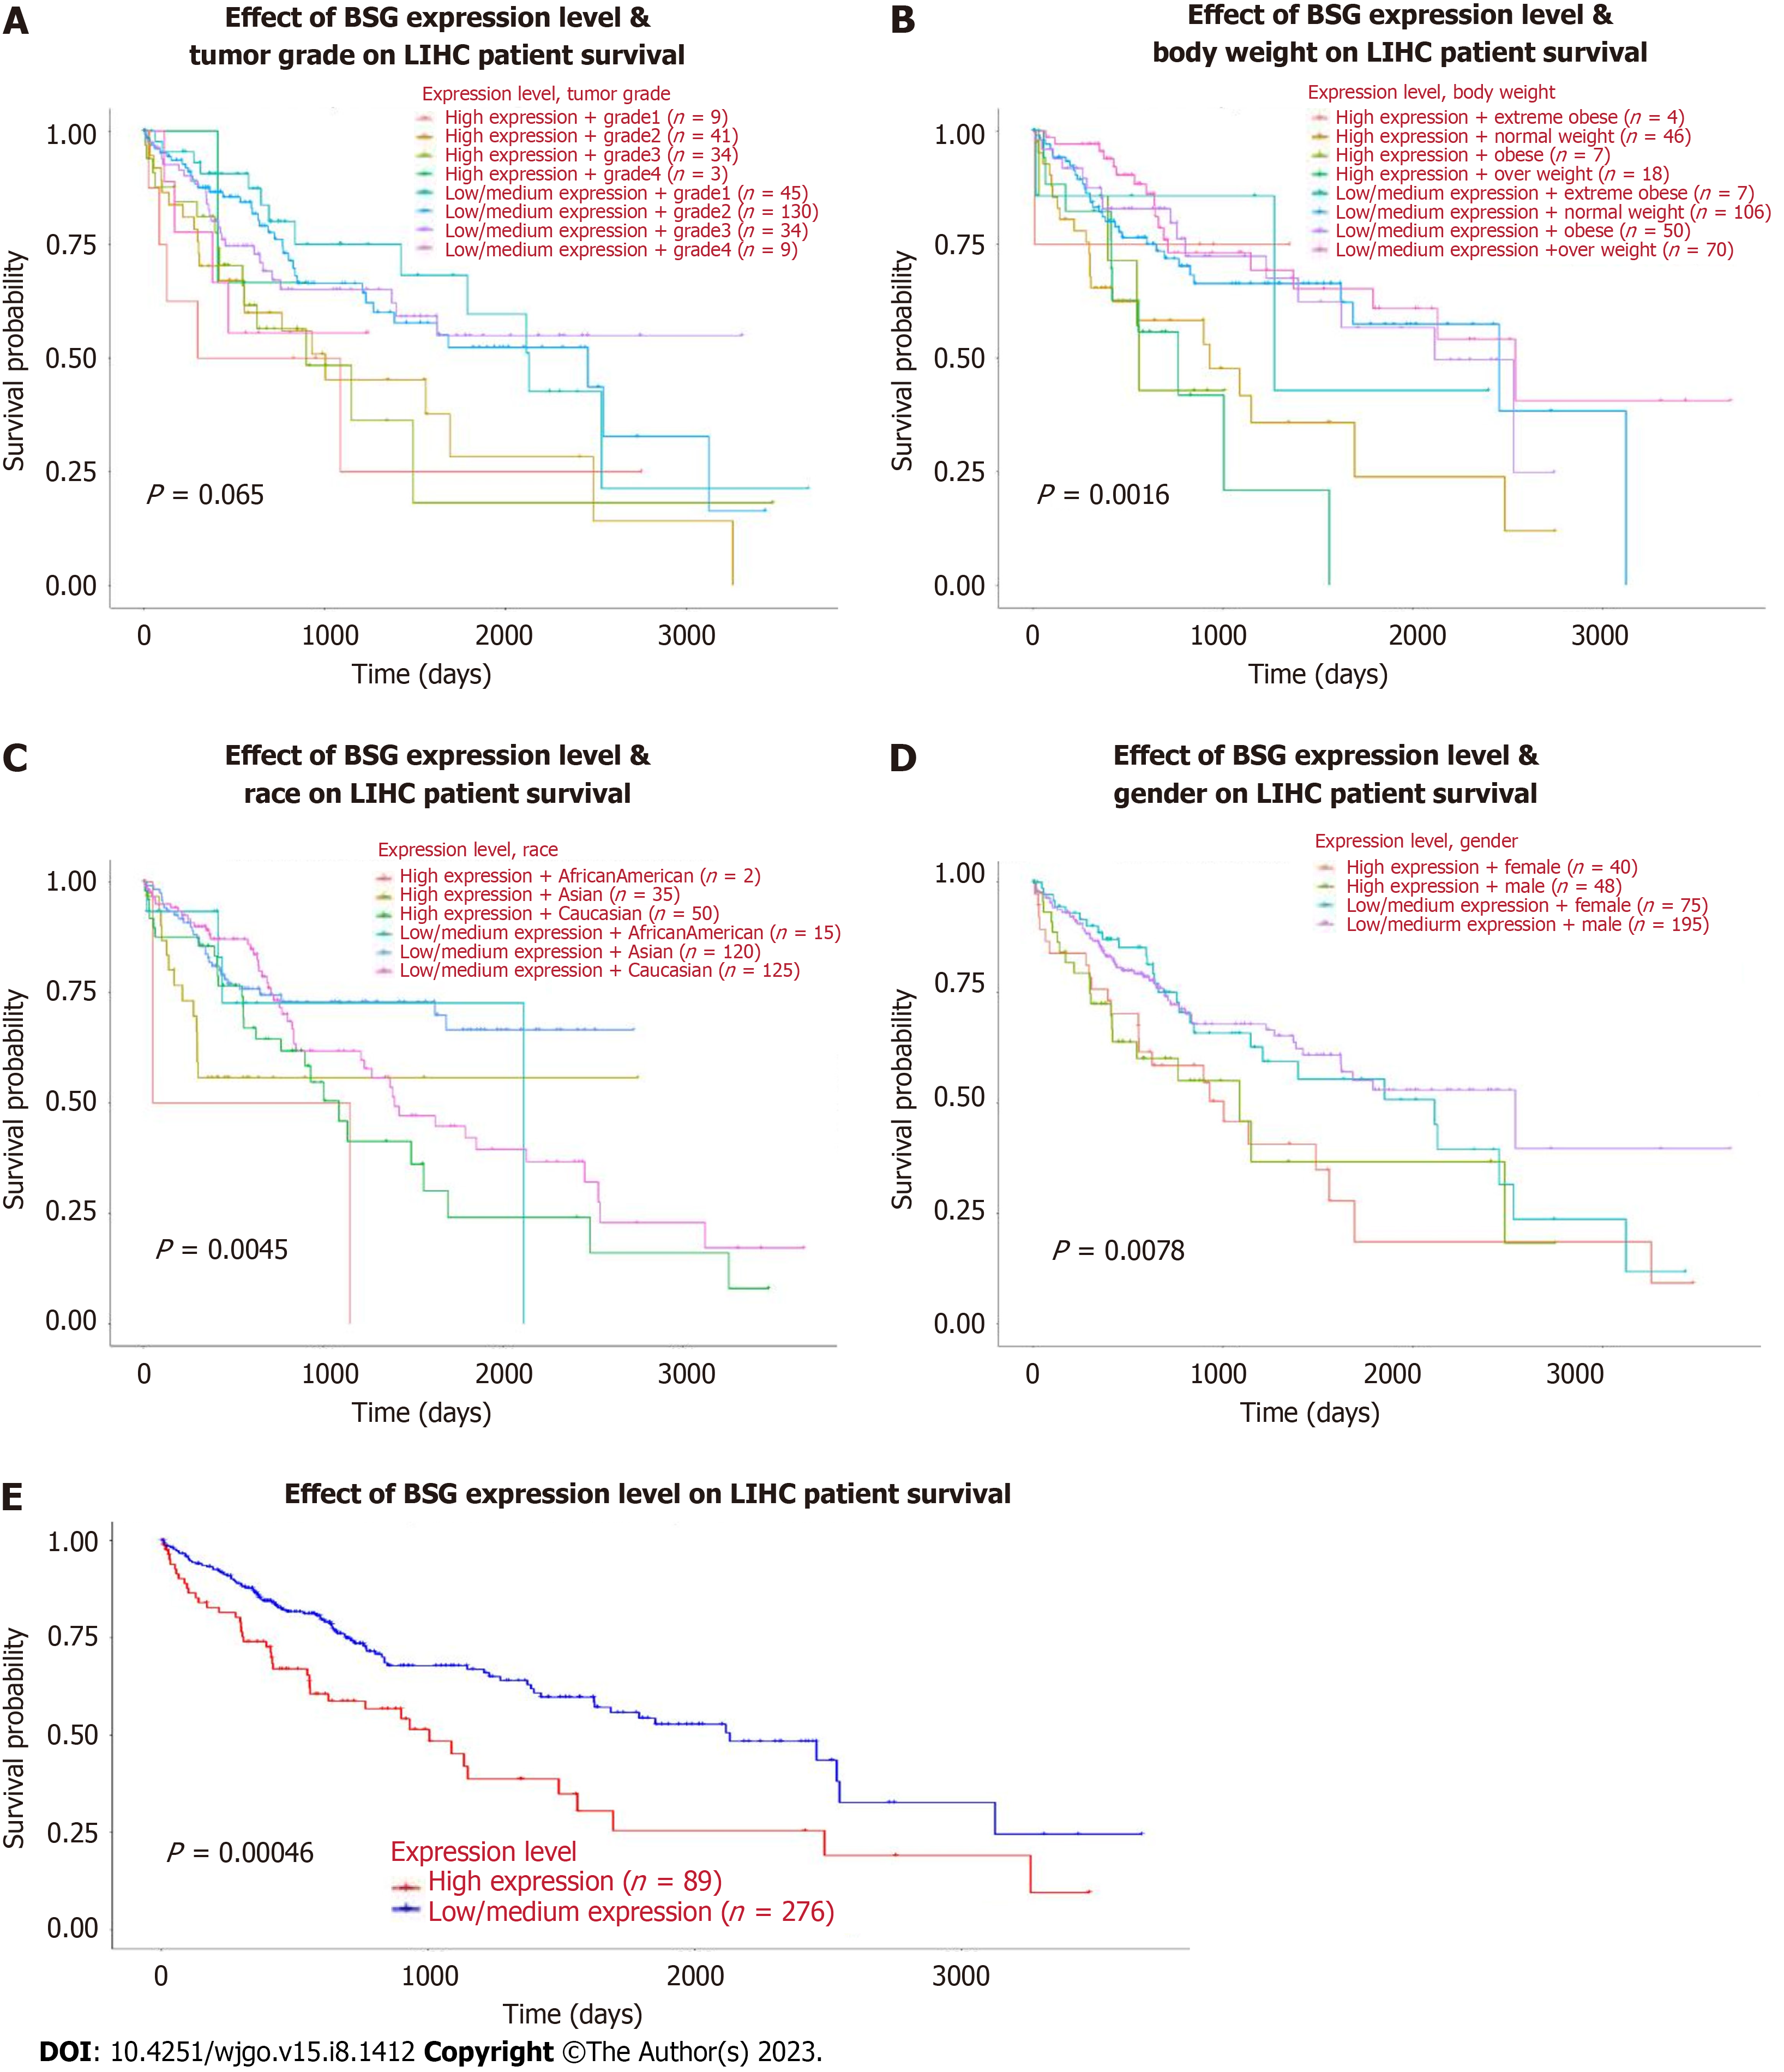
Figure 5 Correlation between cluster of differentiation 147 expression and prognosis of hepatocellular carcinoma concerning age, tumor grade, weight, sex, and overall survival obtained from The Cancer Genome Atlas database showed statistically significant differences.
A: Tumor grade on Liver Hepatocellular Carcinoma (LIHC), high expression vs low expression, P = 0.065; B: Body weight on LIHC, high expression vs low expression, P = 0.065; C: Race on LIHC, high expression vs low expression, P = 0.0016; D: Sex on LIHC, high expression vs low expression, P = 0.0078; E: Overall survival on LIHC, high expression vs low expression, P = 0.00046. BSG: Basigin; TCGA: The Cancer Genome Atlas.
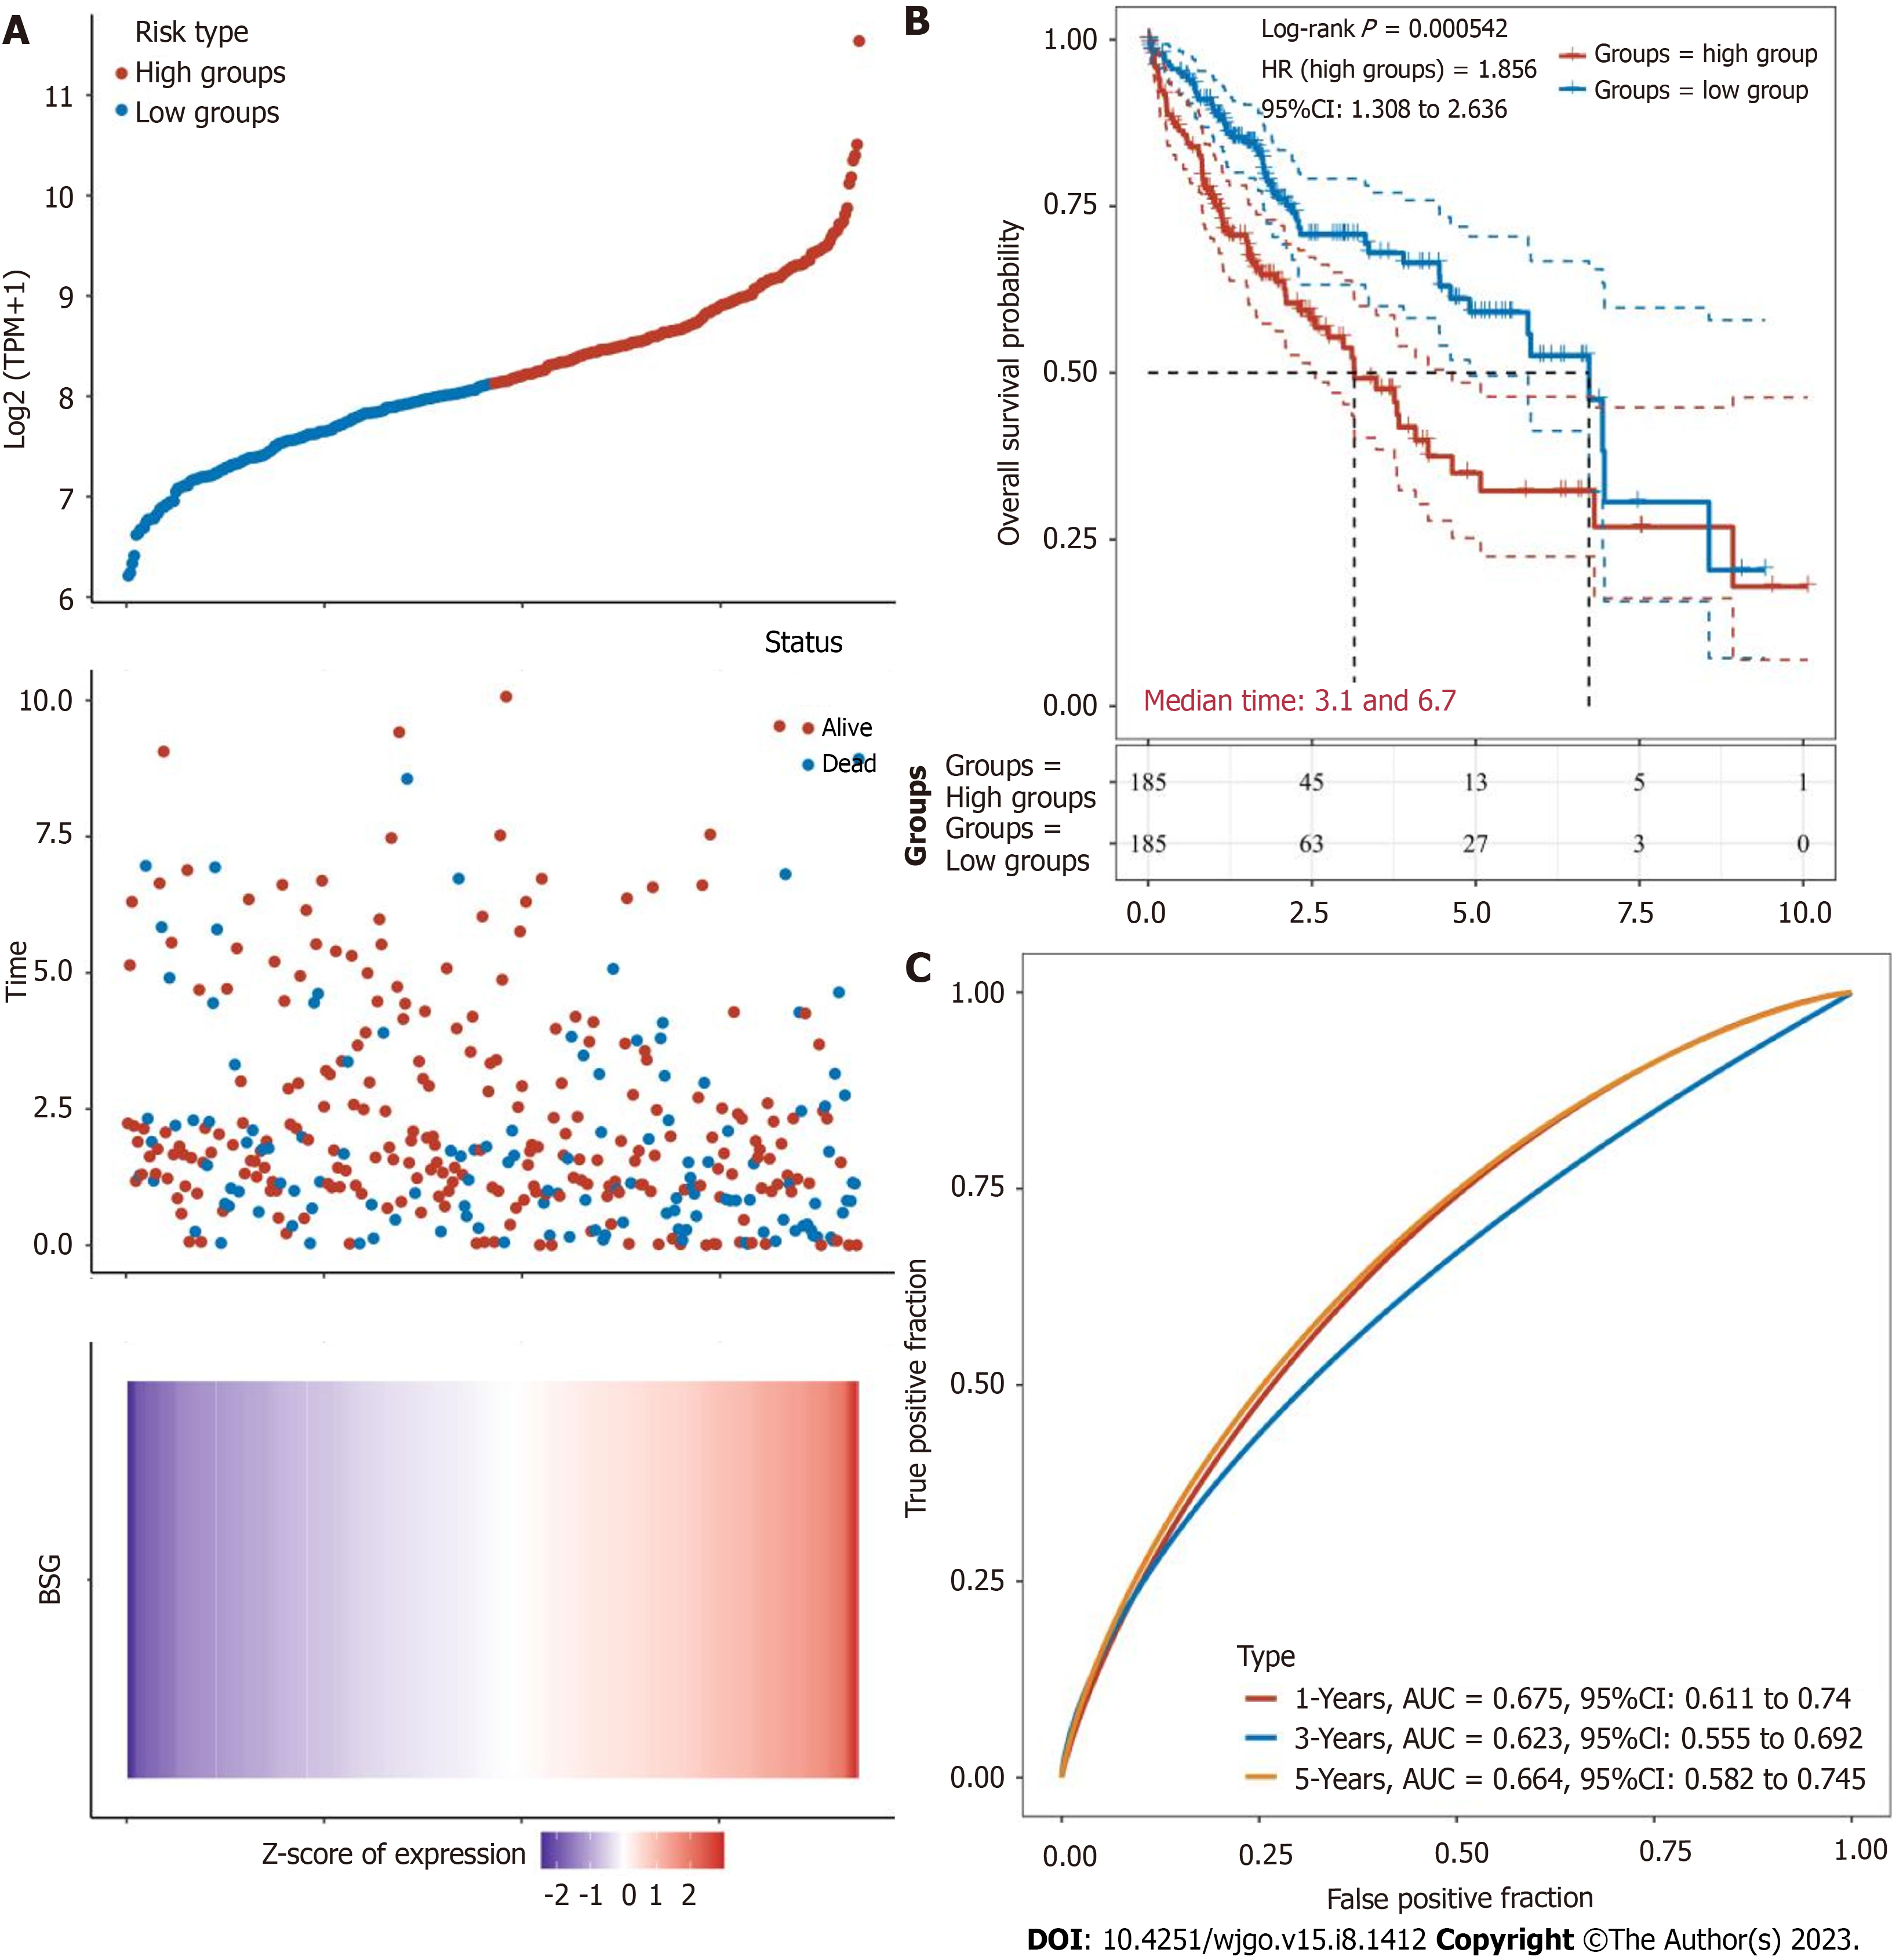
Figure 6 Kaplan-Meier curve based survival analysis in low-expression and high-expression groups of cluster of differentiation 147 conducted by the log-rank test.
A: The cluster of differentiation 147 expression, survival time and survival status, and the cluster of differentiation 147 expression heatmap of The Cancer Genome Atlas dataset; B: The high-expression groups demonstrated poor prognosis and hazard ratio > 1 (log-rank P = 0.000542, HR: 1.856, 95%CI: 1.308 to 2.636); C: Based on the area under the curve values obtained from receiver operating characteristic curves, the 1-year, 3-year, and 5-year survival rates were 0.675 (95%CI: 0.611 to 0.740), 0.623 (95%CI: 0.555 to 0.692), and 0.664 (95%CI: 0.582 to 9.745).
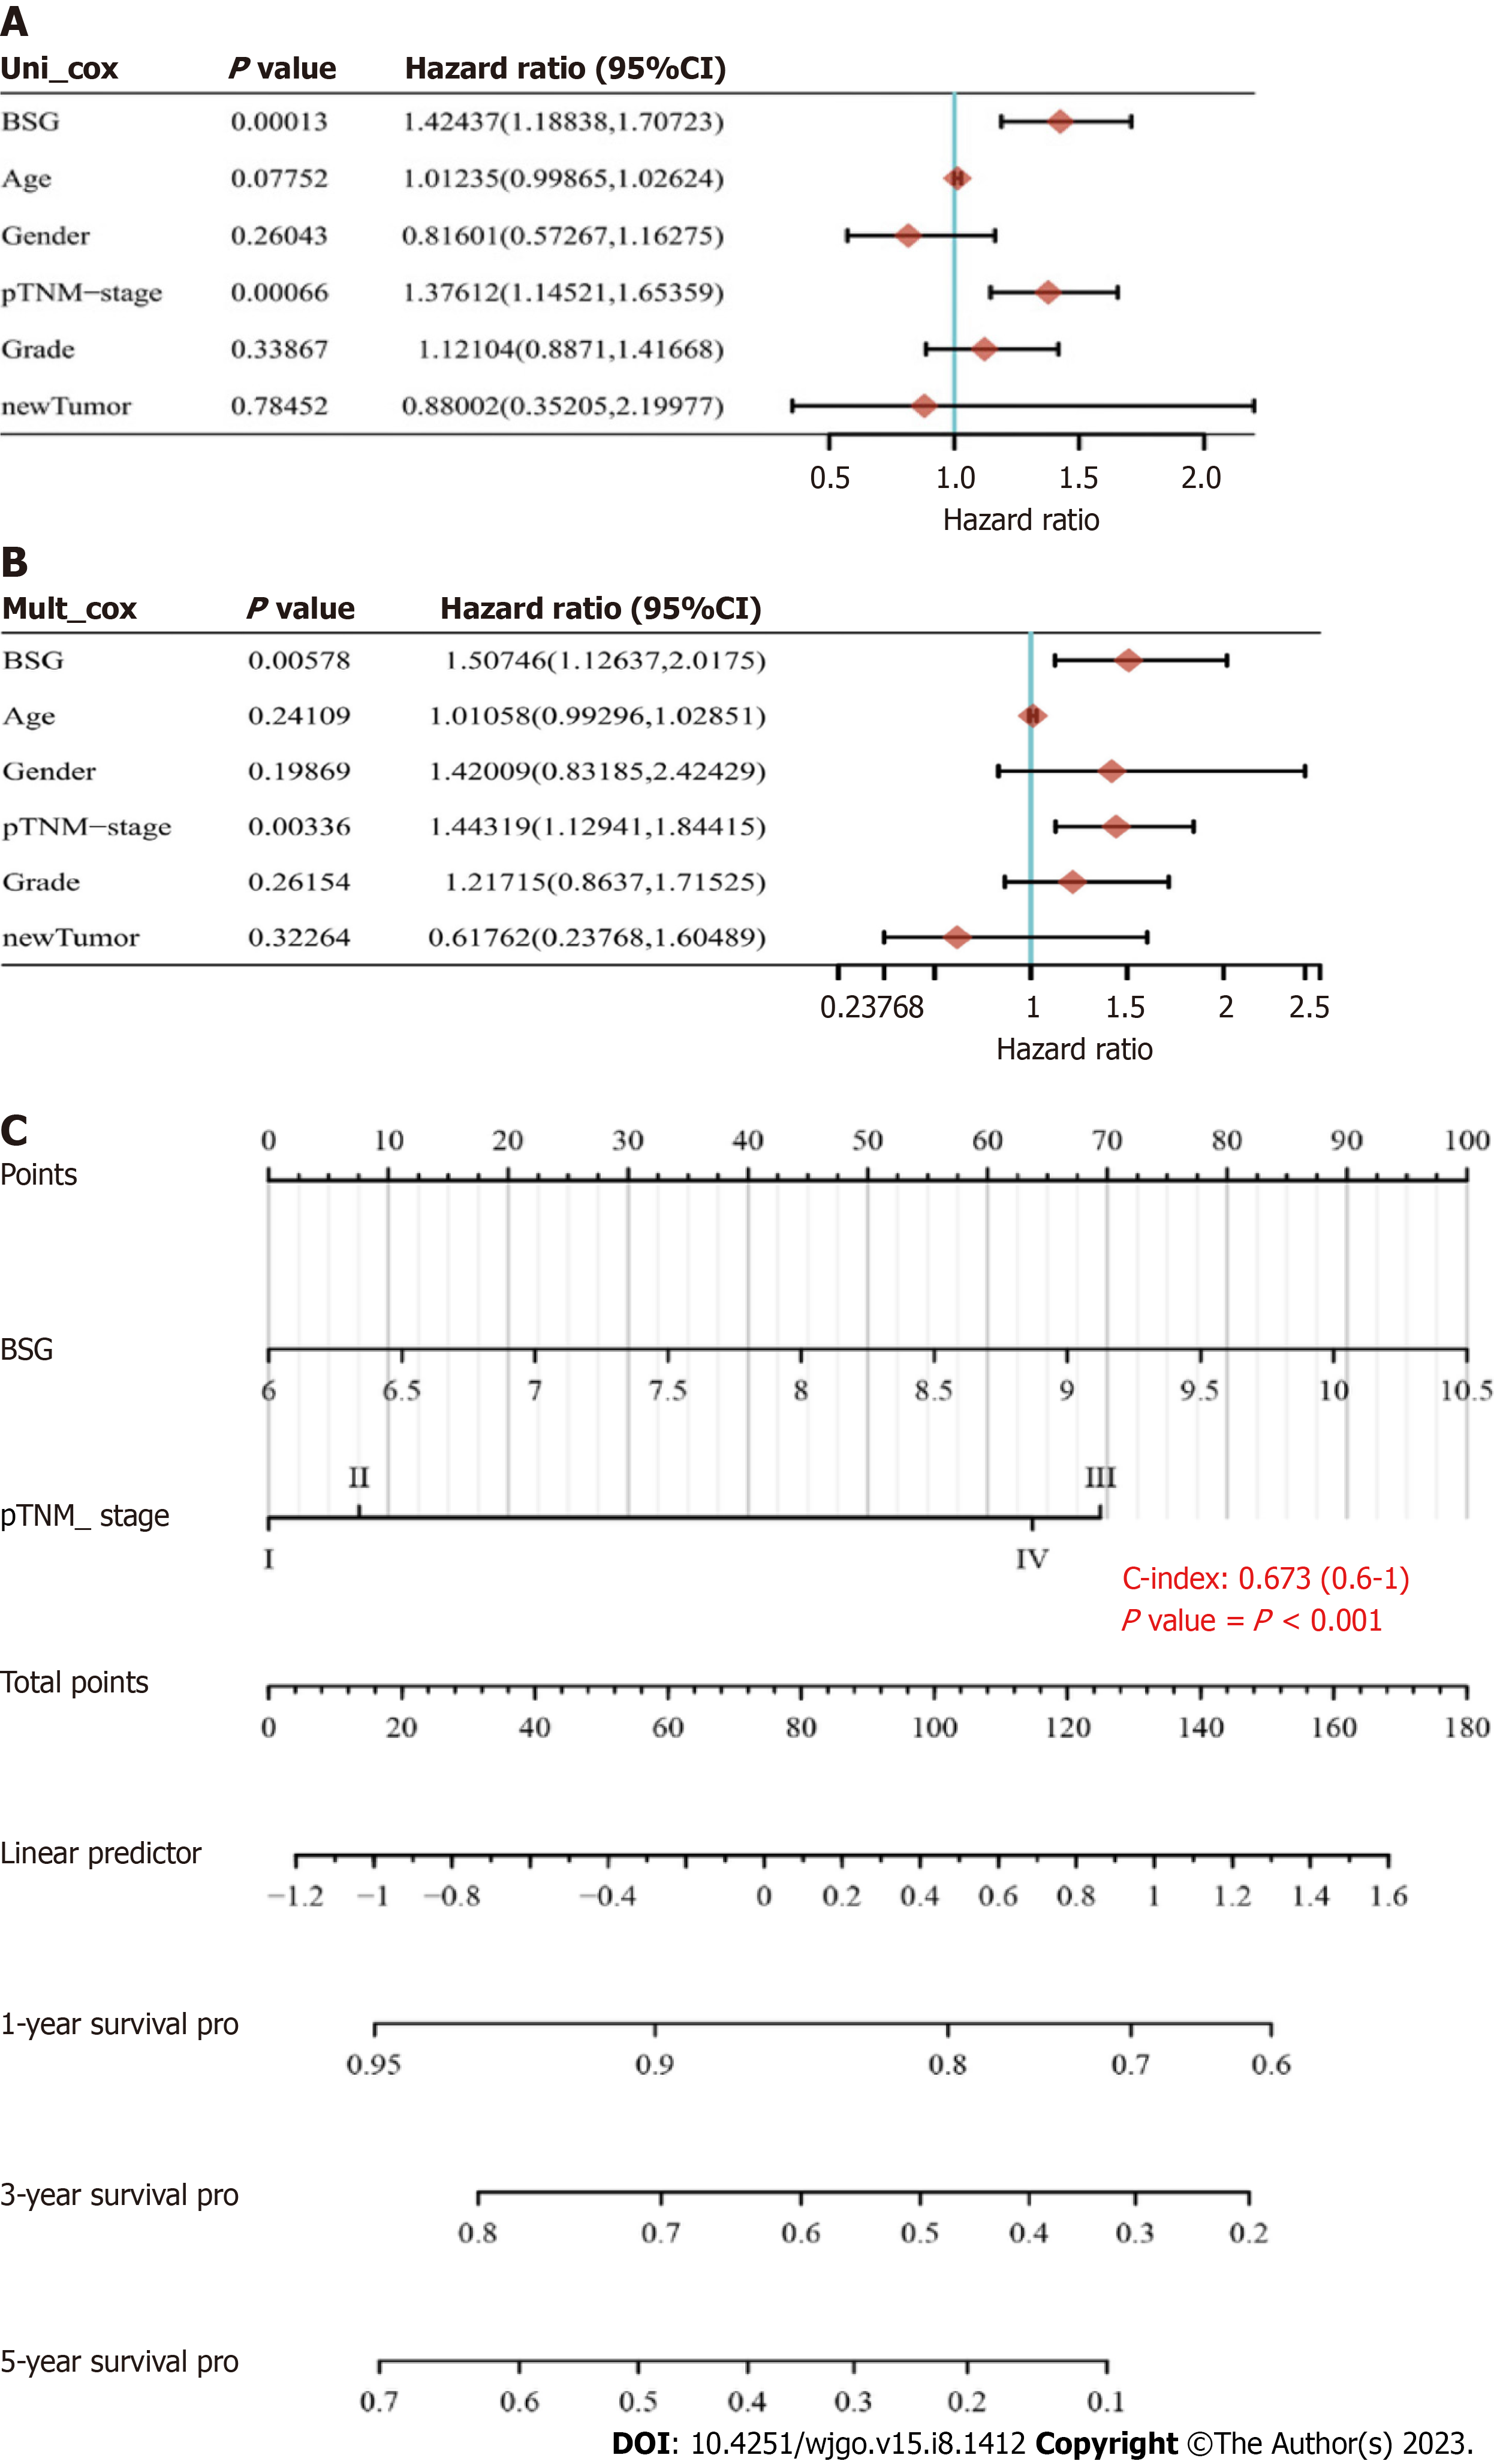
Figure 7 Univariate and multivariate Cox analysis of cluster of differentiation 147 expression and age, sex, pathological tumor-node-metastasis-stage, grade, and new hepatocellular carcinoma tumor.
A: Univariate Cox analysis (Uni_cox). The expression of cluster of differentiation 147 (CD147) and pathological tumor-node-metastasis (pTNM)-stage had significant differences [P = 0.00013, hazard ratio (HR): 1.424, 95% confidence interval (CI): 1.884 to 1.707 and P = 0.00066, HR = 1.376, 95%CI: 1.145 to 1.654, respectively]; B: Multivariate Cox analysis (Mult_cox). The expression of CD147 and pTNM-stage had significant differences (P = 0.00578, HR: 1.507, 95%CI: 1.126 to 2.018 and P = 0.00336, HR: 1.443, 95%CI: 1.129 to 1.844, respectively); C: Accordingly, the factors of CD147 expression and pTNM-stage (P < 0.05) were selected to establish a prognostic nomogram for hepatocellular carcinoma. The total points ranged from 0 to 180, and the C-index value was 0.673 (95%CI: 0.600 to 1.000, P < 0.01). BSG: Basigin.
- Citation: Xu YJ, He HJ, Wu P, Li WB. Expression patterns of cluster of differentiation 147 impact the prognosis of hepatocellular carcinoma. World J Gastrointest Oncol 2023; 15(8): 1412-1423
- URL: https://www.wjgnet.com/1948-5204/full/v15/i8/1412.htm
- DOI: https://dx.doi.org/10.4251/wjgo.v15.i8.1412


