Copyright
©The Author(s) 2023.
World J Gastrointest Oncol. May 15, 2023; 15(5): 787-809
Published online May 15, 2023. doi: 10.4251/wjgo.v15.i5.787
Published online May 15, 2023. doi: 10.4251/wjgo.v15.i5.787
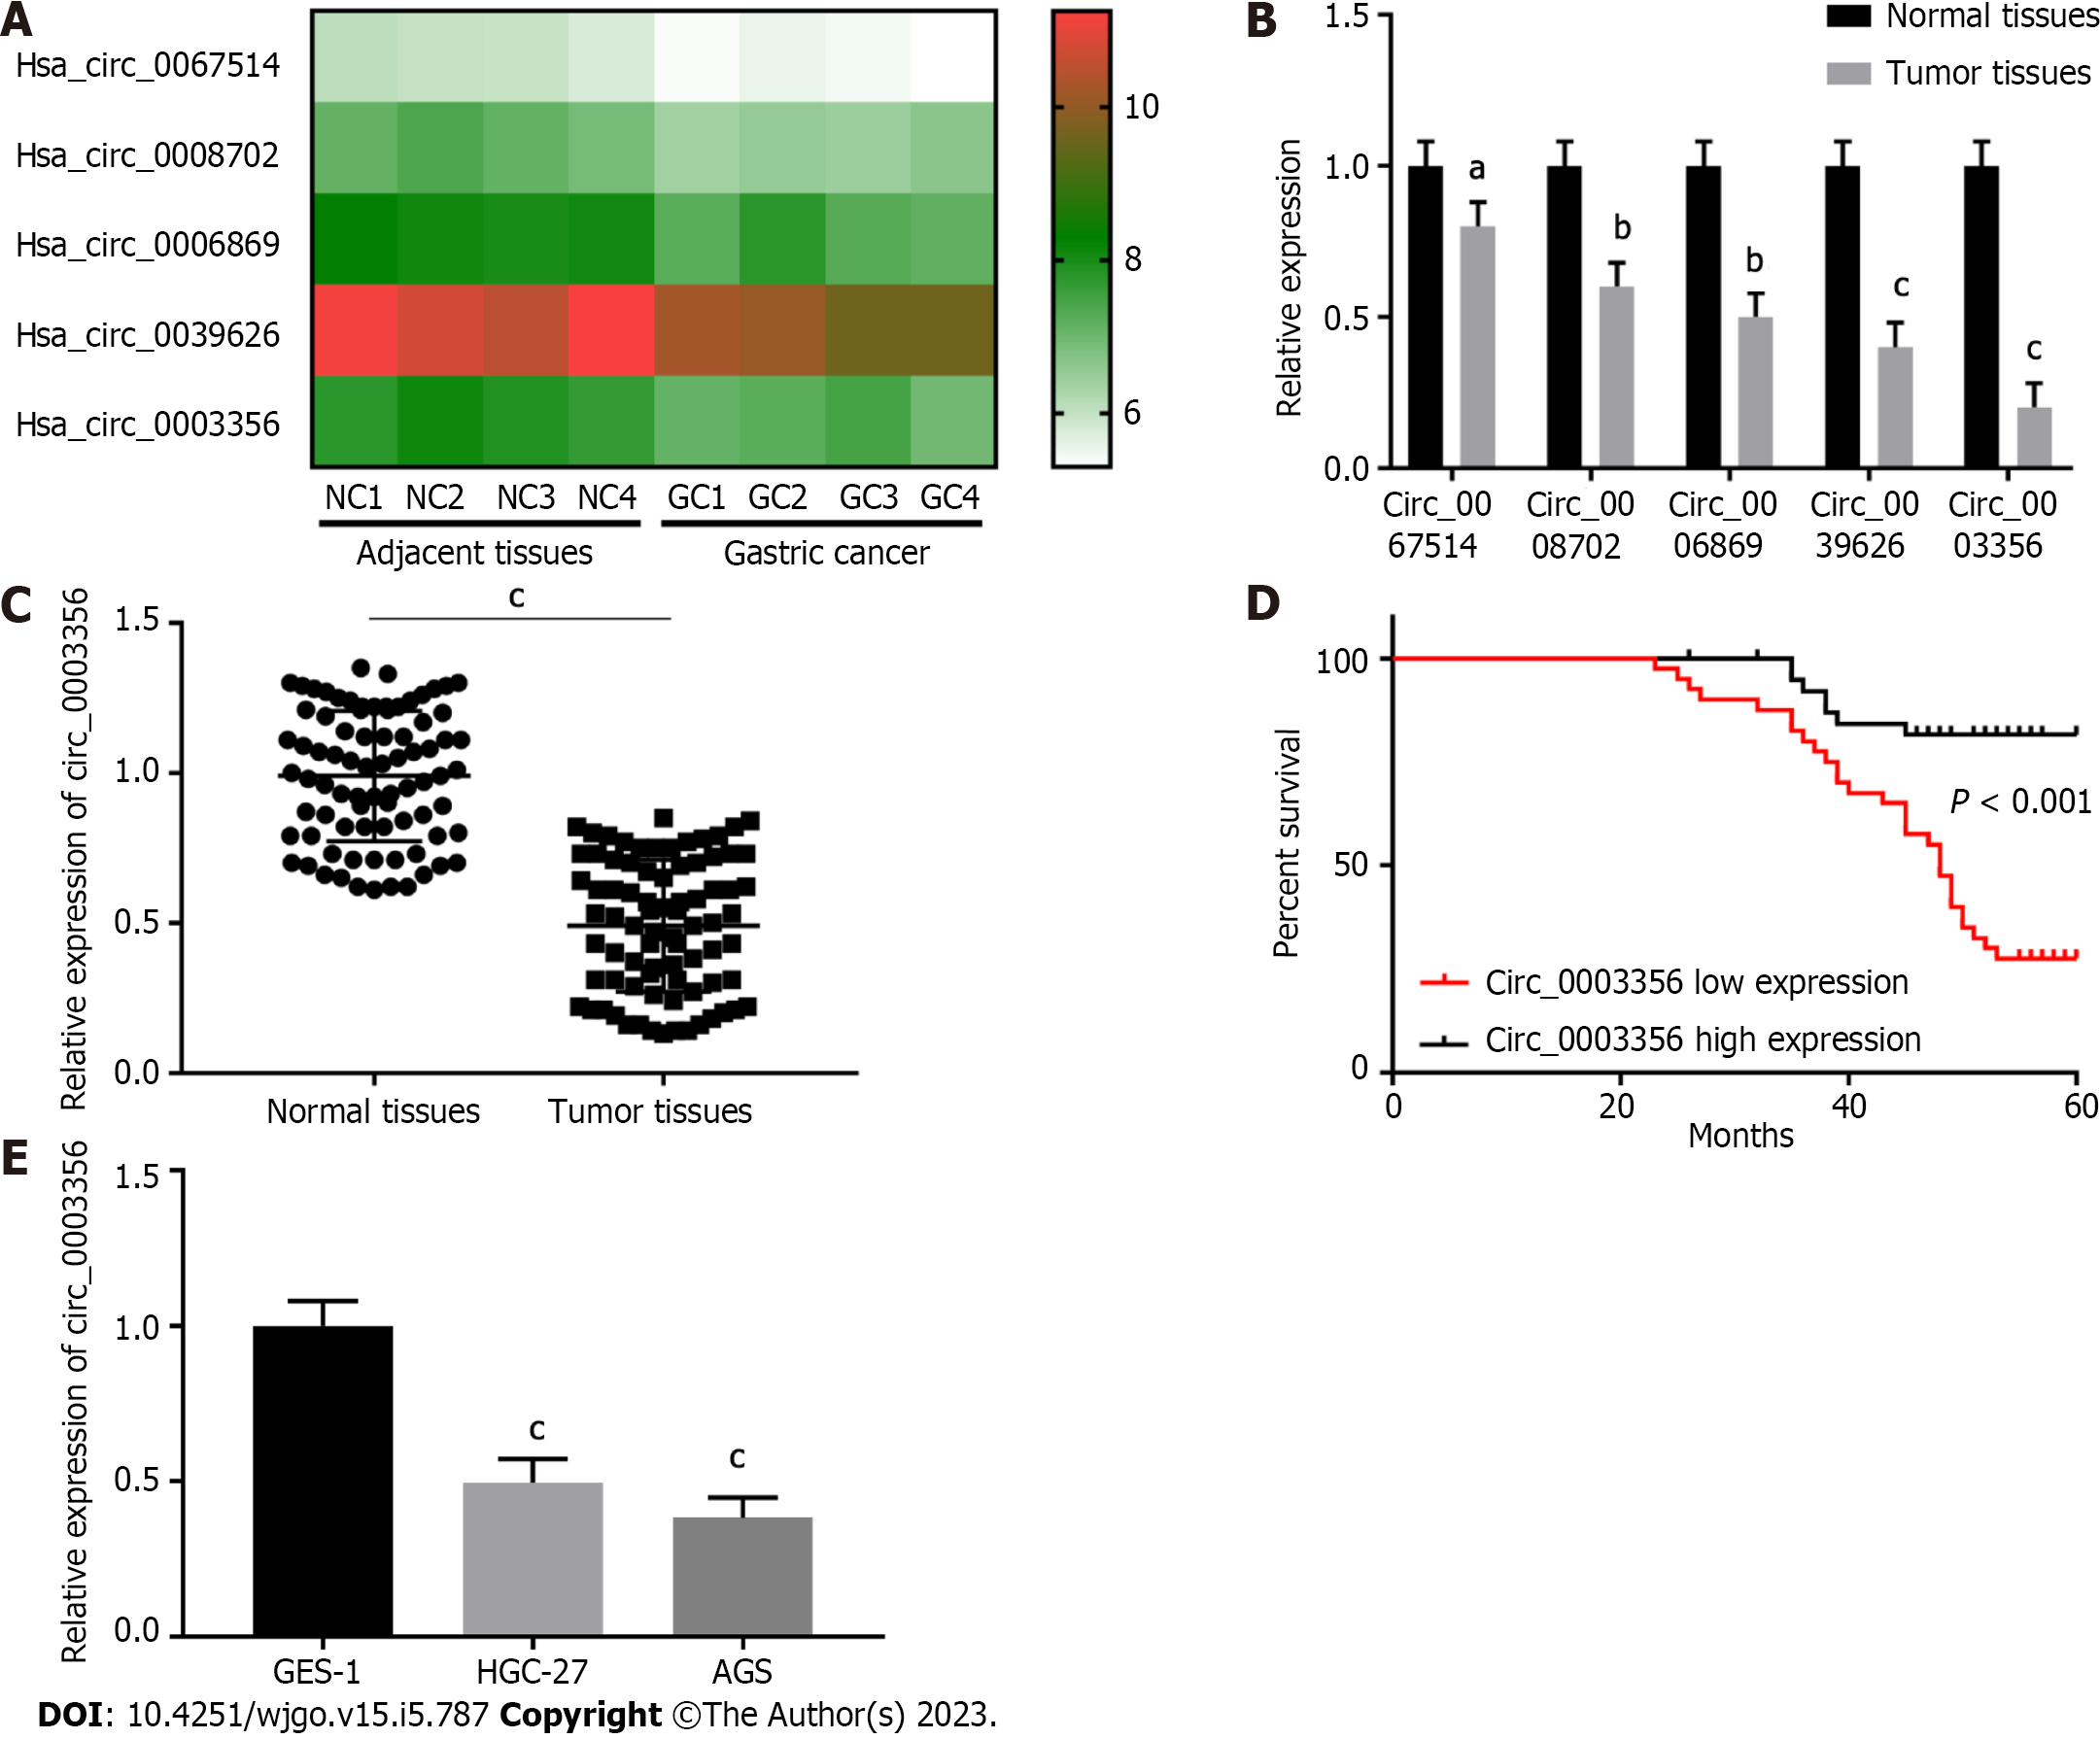
Figure 1 Circ_0003356 is expressed to low levels in gastric cancer tissues.
A: CircRNAs in GSE184882 were analyzed and five with the most significant expression differences in gastric cancer (GC) were used for heat map analysis; B: Relative expression of circRNAs in tumor and normal tissues determined by quantitative real-time polymerase chain reaction (qRT-PCR); C: Relative expression of circ_0003356 in tumor and normal tissues determined by qRT-PCR; D: Kaplan-Meier analysis of the correlation between circ_0003356 expression and overall survival of GC patients; E: Relative expression of circ_0003356 in GES-1, HGC-27, and AGS cells determined by qRT-PCR. aP < 0.05, bP < 0.01, cP < 0.001. NC: Negative control; GC: Gastric cancer.
Figure 2 Upregulation of circ_0003356 promotes cell apoptosis and suppresses proliferation, migration, invasion, and epithelial-mesenchymal transition of AGS and HGC-27 cells.
A: Relative expression of circ_0003356 in AGS and HGC-27 cells detected by quantitative real-time polymerase chain reaction; B: Cell viability in AGS and HGC-27 cells assessed by CCK-8 assay; C: Proliferation of AGS and HGC-27 cells assessed by EdU assays. D: Apoptosis of AGS and HGC-27 cells assessed by flow cytometry; E: Migration of AGS and HGC-27 cells detected by wound healing assays; F: Invasion of AGS and HGC-27 cells detected by transwell assay; G: Levels of epithelial-mesenchymal transition-related proteins (E-cadherin and N-cadherin) in AGS and HGC-27 cells determined using western blotting. bP < 0.01, cP < 0.001.
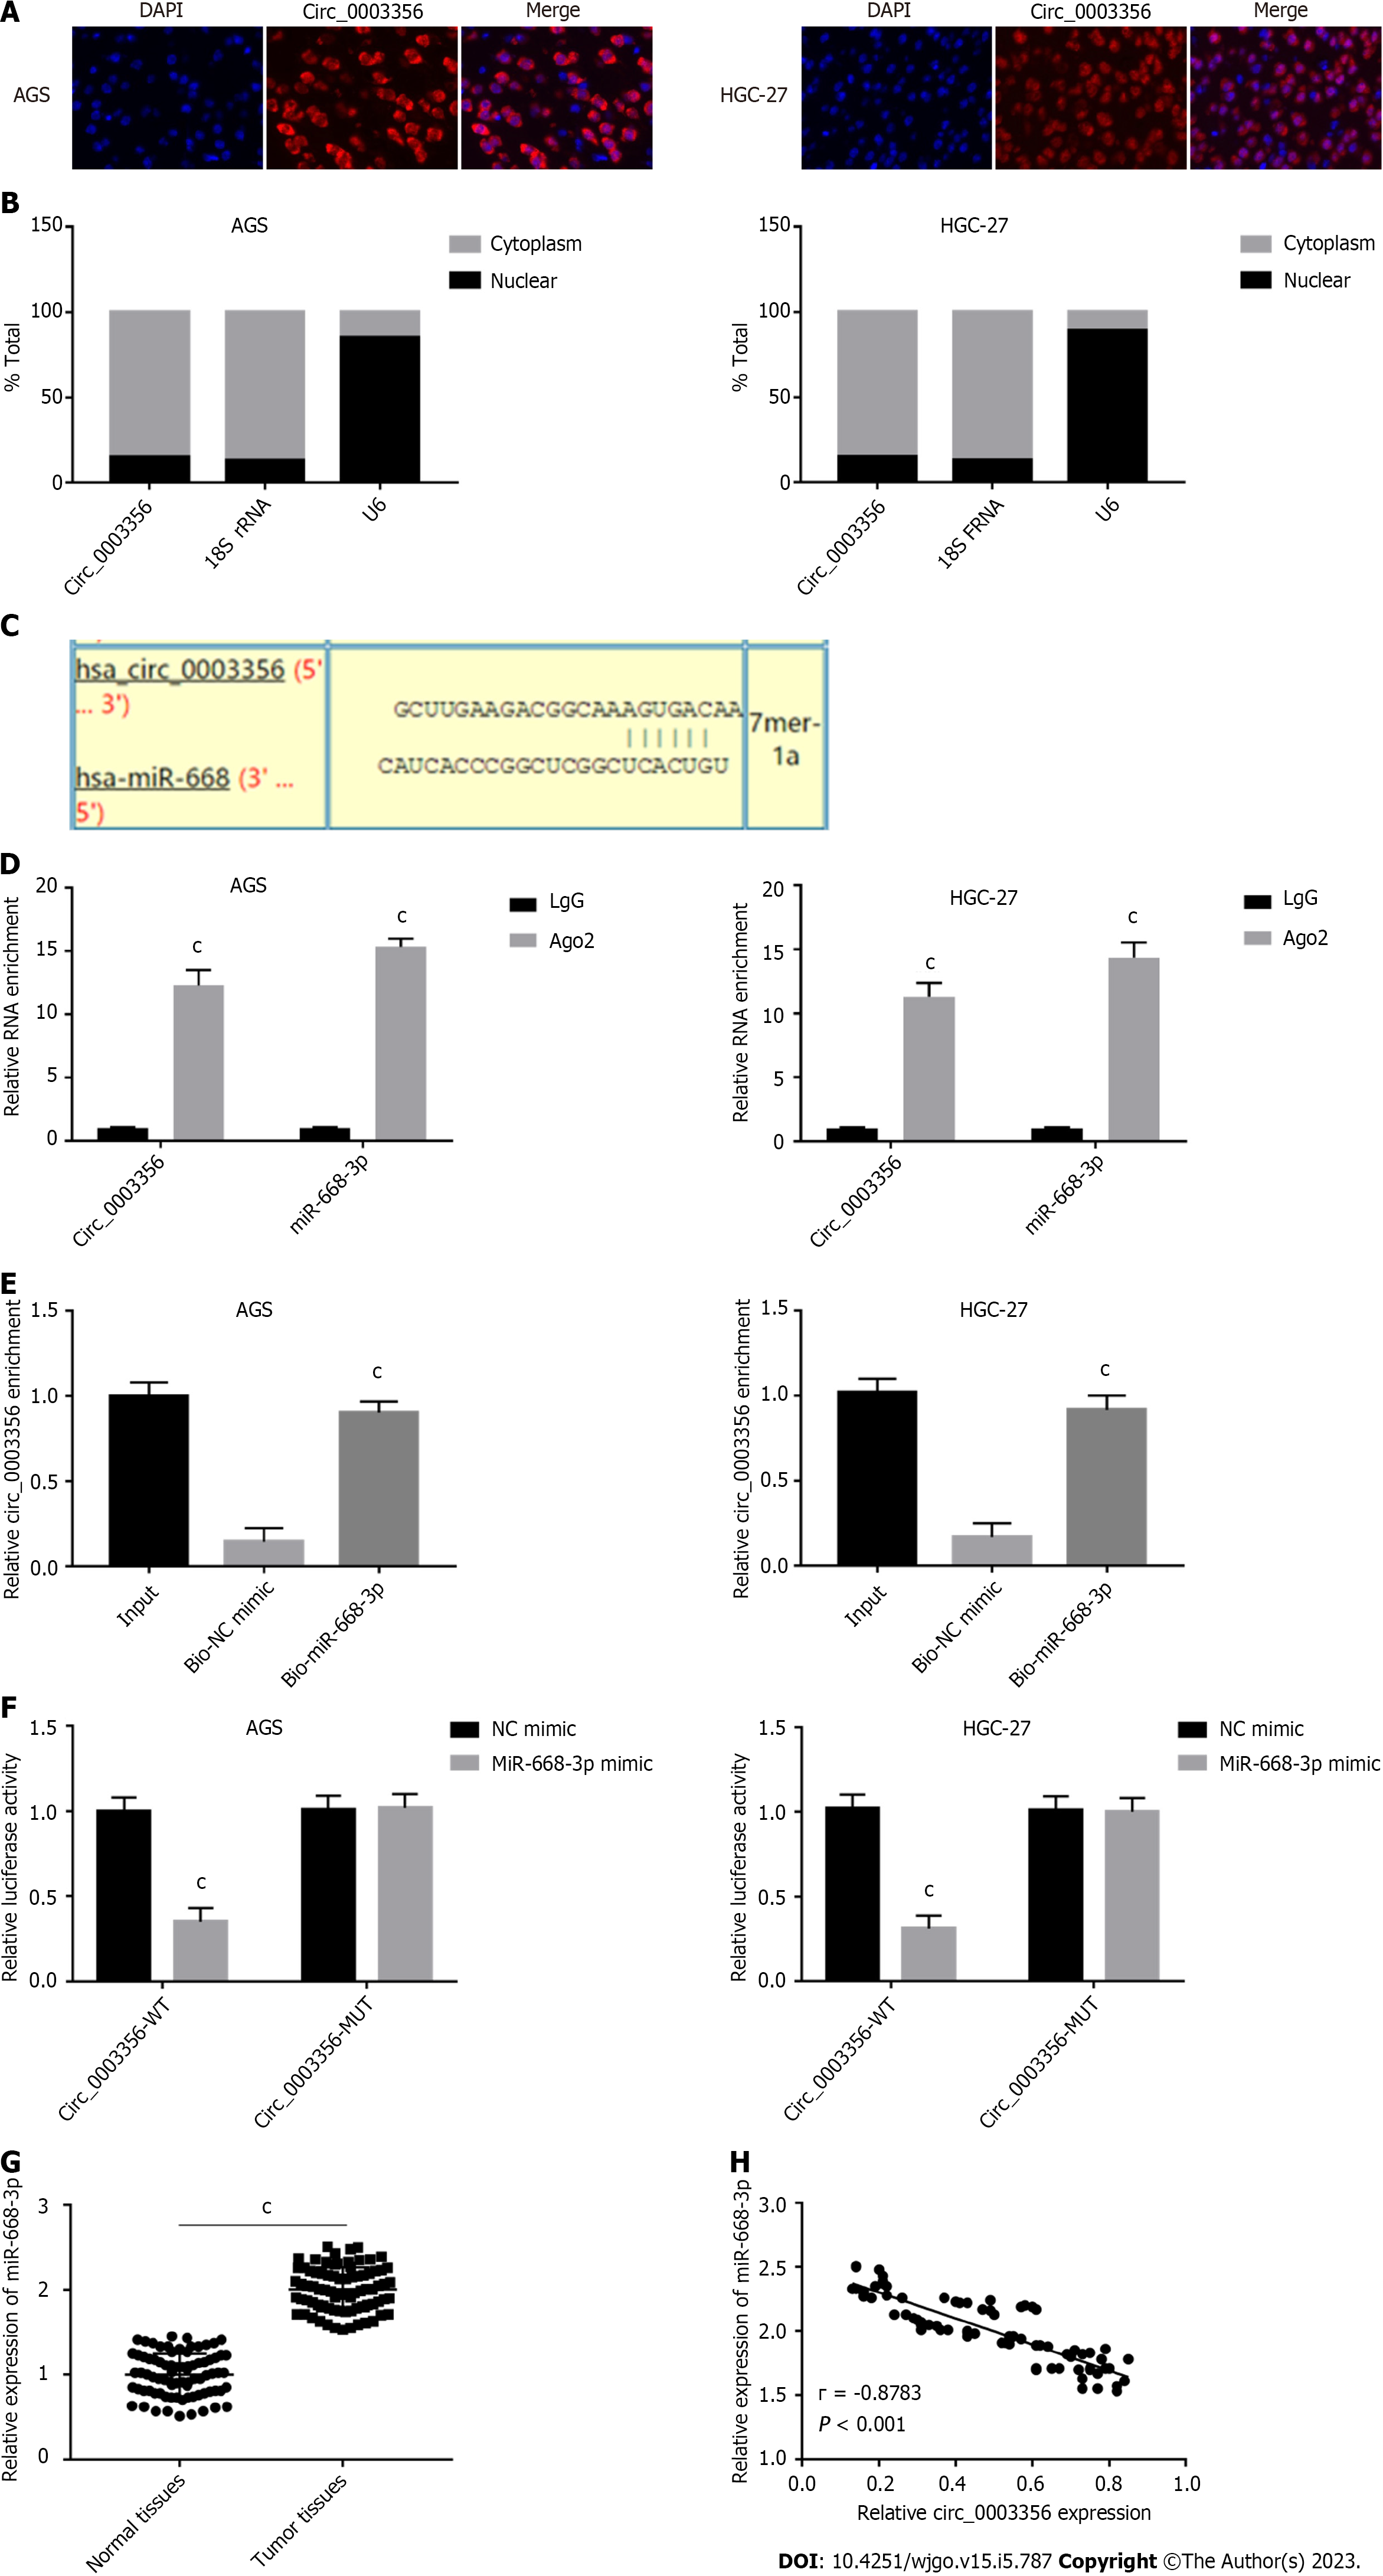
Figure 3 Circ_0003356 directly binds to miR-668-3p.
A: Fluorescence in situ hybridization assays were used to detect the sub-cellular localization of circ_0003356 in AGS and HGC-27 cells; B: Quantitative real-time polymerase chain reaction (qRT-PCR) was used to detect the expression of circ_0003356 in the nucleus and cytoplasm; C: Binding sequences between circ_0003356 and miR-668-3p predicted by circinteractome; D: Interaction between circ_0003356 and miR-668-3p in AGS and HGC-27 cells validated by RIP-qRT-PCR; E: interaction between circ_0003356 and miR-668-3p in AGS and HGC-27 cells validated by RNA pull-down assays; F: Interaction between circ_0003356 and miR-668-3p in AGS and HGC-27 cells validated by dual-luciferase reporter assays; G: Relative expression of miR-668-3p detected by qRT-PCR in tumor tissues and normal tissues; H: Correlation between circ_0003356 and miR-668-3p in gastric cancer tissues analyzed by Pearson’s correlation analysis. cP < 0.001.
Figure 4 Suppression of miR-668-3p promotes cell apoptosis and impairs the proliferation, migration, invasion, and epithelial-mesenchymal transition of AGS and HGC-27 cells.
A: Relative expression of miR-668-3p in GES-1, AGS, and HGC-27 cells detected by quantitative real-time polymerase chain reaction (qRT-PCR); B: Cell viability in AGS and HGC-27 cells assessed by CCK-8 assay; C: Proliferation of AGS and HGC-27 cells assessed by EdU assays; D: Apoptosis of AGS and HGC-27 cells assessed by flow cytometry; E: Relative migration of AGS and HGC-27 cells detected by wound healing assays; F: Invasion of AGS and HGC-27 cells detected by transwell assays; G: Levels of epithelial-mesenchymal transition-related proteins (E-cadherin and N-cadherin) in AGS and HGC-27 cells determined using western blotting. bP < 0.01, cP < 0.001.
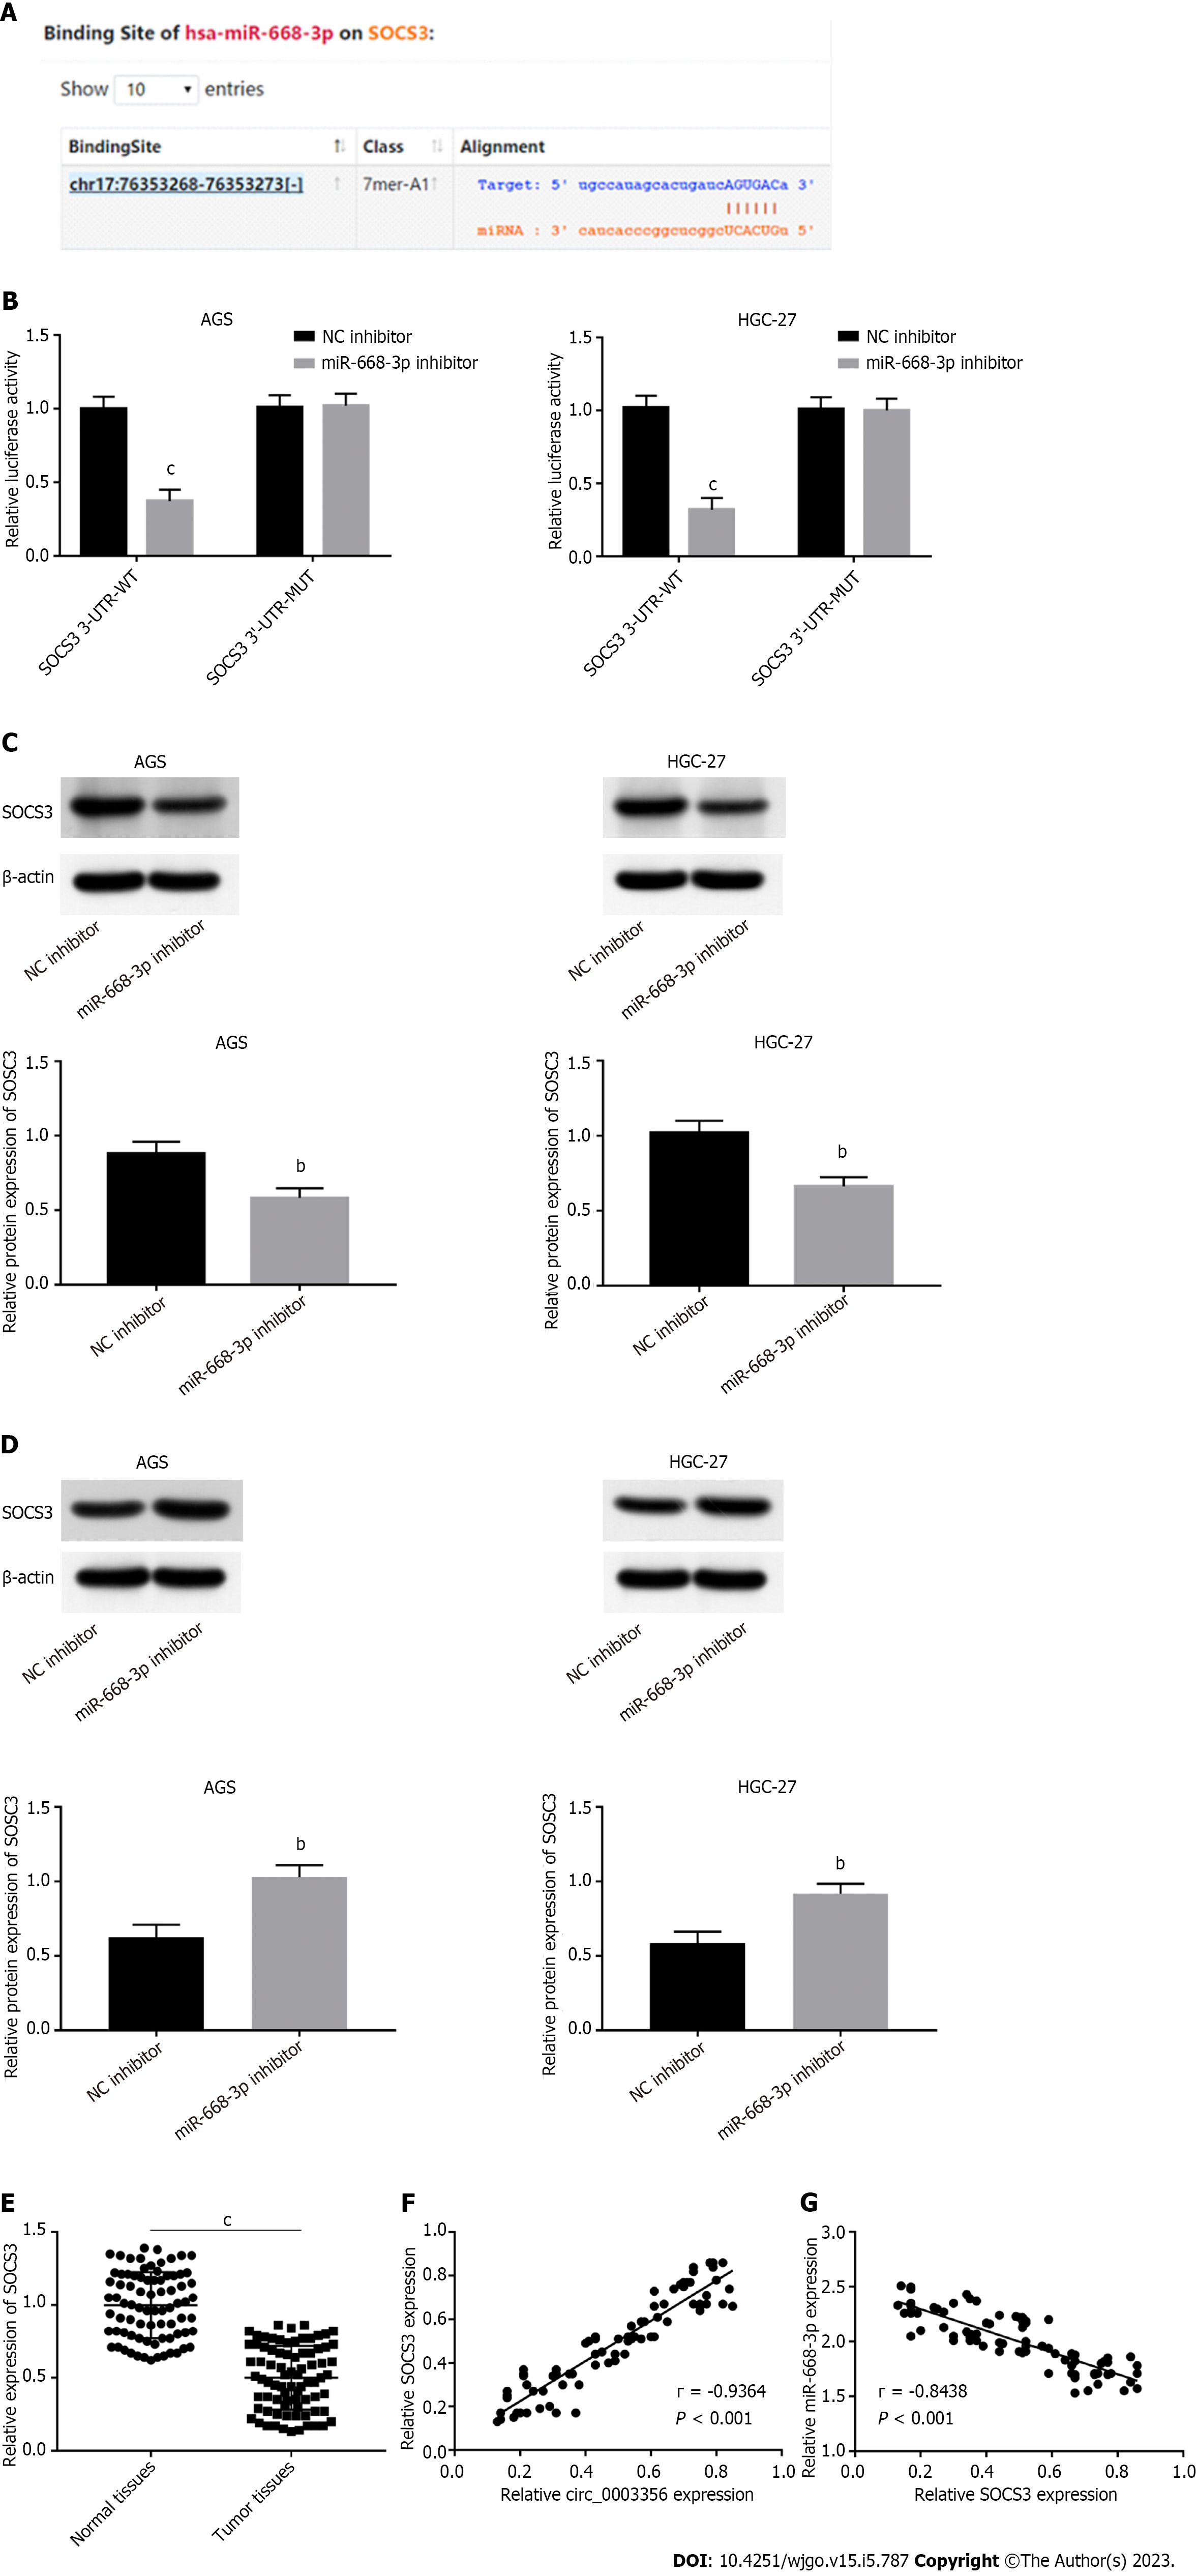
Figure 5 SOCS3 is targeted by miR-668-3p.
A: Binding sites between SOCS3 and miR-668-3p were predicted by Starbase v2.0 software; B: Dual-luciferase reporter assays were used to confirm the targeting relationship between SOCS3 and miR-668-3p in AGS and HGC-27 cells; C: Relative expression of SOCS3 in AGS and HGC-27 cells detected by western blotting following miR-668-3p overexpression; D: Relative protein expression of SOCS3 in AGS and HGC-27 cells detected by western blotting after miR-668-3p inhibition; E: Relative mRNA expression of SOCS3 was detected by quantitative real-time polymerase chain reaction in tumor tissues and normal tissues; F: Correlation between circ_0003356 and SOCS3 in gastric cancer (GC) tissues analyzed by Pearson’s correlation analysis; G: Correlation between miR-668-3p and SOCS3 in GC tissues analyzed by Pearson’s correlation analysis. bP < 0.01, cP < 0.001.
Figure 6 Circ_0003356 overexpression suppresses the malignant behavior of gastric cancer cells via sponging miR-668-3p to target SOCS3.
A and B: Protein expression of SOCS3 in AGS and HGC-27 cells detected by western blot; C: Cell viability in AGS and HGC-27 cells detected by CCK-8 assay; D: Proliferation of AGS and HGC-27 cells assessed by EdU assay; E: Apoptosis of AGS and HGC-27 cells assessed by flow cytometry; F: Relative migration of AGS and HGC-27 cells detected by wound healing assay; G: Relative invasion of AGS and HGC-27 cells detected by transwell assay; H: Levels of epithelial-mesenchymal transition-related proteins (E-cadherin and N-cadherin) in AGS and HGC-27 cells determined by western blotting. aP < 0.05, bP < 0.01, cP < 0.001.
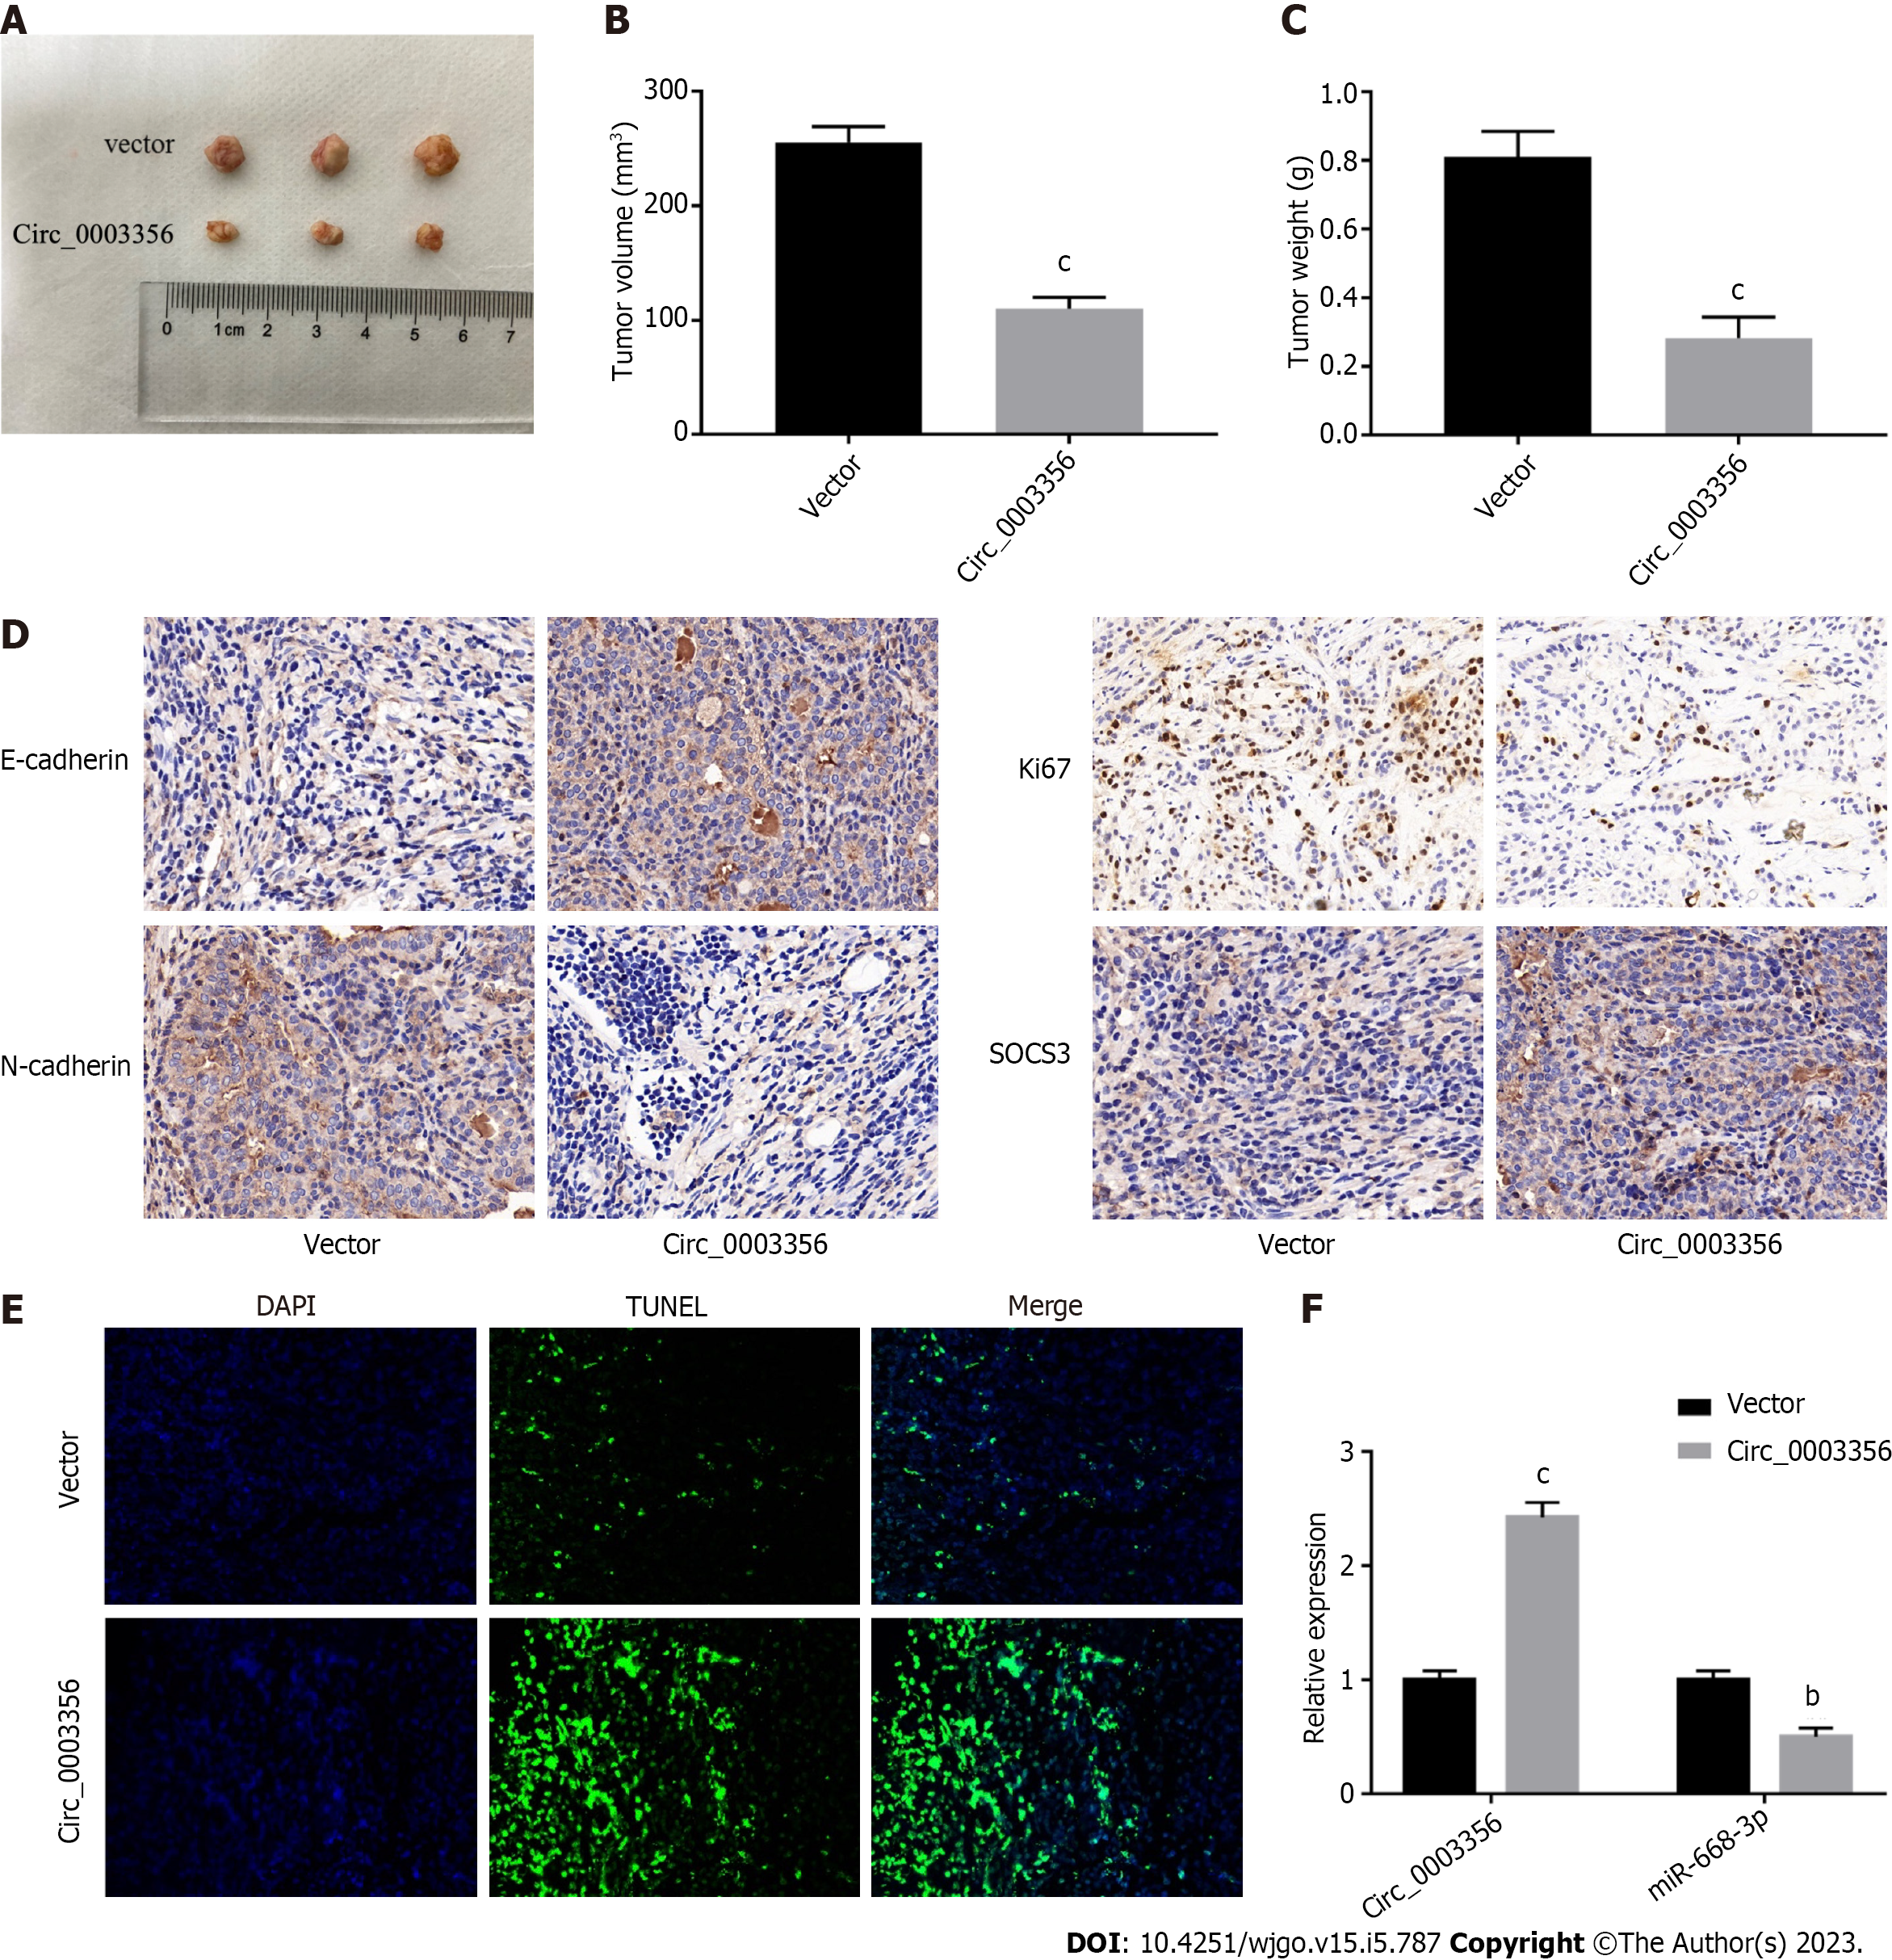
Figure 7 Circ_0003356 upregulation impedes gastric cancer tumorigenesis in vivo.
A: Representative images of tumor in xenograft mice; B: Average volumes of xenograft mice; C: Average tumor weights of xenograft mice; D: Expression of E-cadherin, N-cadherin, Ki67, and SOCS3 in tumor tissues of xenograft mice determined by immunohistochemical staining; E: TUNEL staining to detect cell apoptosis in tumor tissues of mice; F: Expression of circ_0003356 and miR-668-3p determined by quantitative real-time polymerase chain reaction in tumor tissues of mice. bP < 0.01, cP < 0.001.
- Citation: Li WD, Wang HT, Huang YM, Cheng BH, Xiang LJ, Zhou XH, Deng QY, Guo ZG, Yang ZF, Guan ZF, Wang Y. Circ_0003356 suppresses gastric cancer growth through targeting the miR-668-3p/SOCS3 axis. World J Gastrointest Oncol 2023; 15(5): 787-809
- URL: https://www.wjgnet.com/1948-5204/full/v15/i5/787.htm
- DOI: https://dx.doi.org/10.4251/wjgo.v15.i5.787


