Copyright
©The Author(s) 2023.
World J Gastrointest Oncol. Mar 15, 2023; 15(3): 546-561
Published online Mar 15, 2023. doi: 10.4251/wjgo.v15.i3.546
Published online Mar 15, 2023. doi: 10.4251/wjgo.v15.i3.546
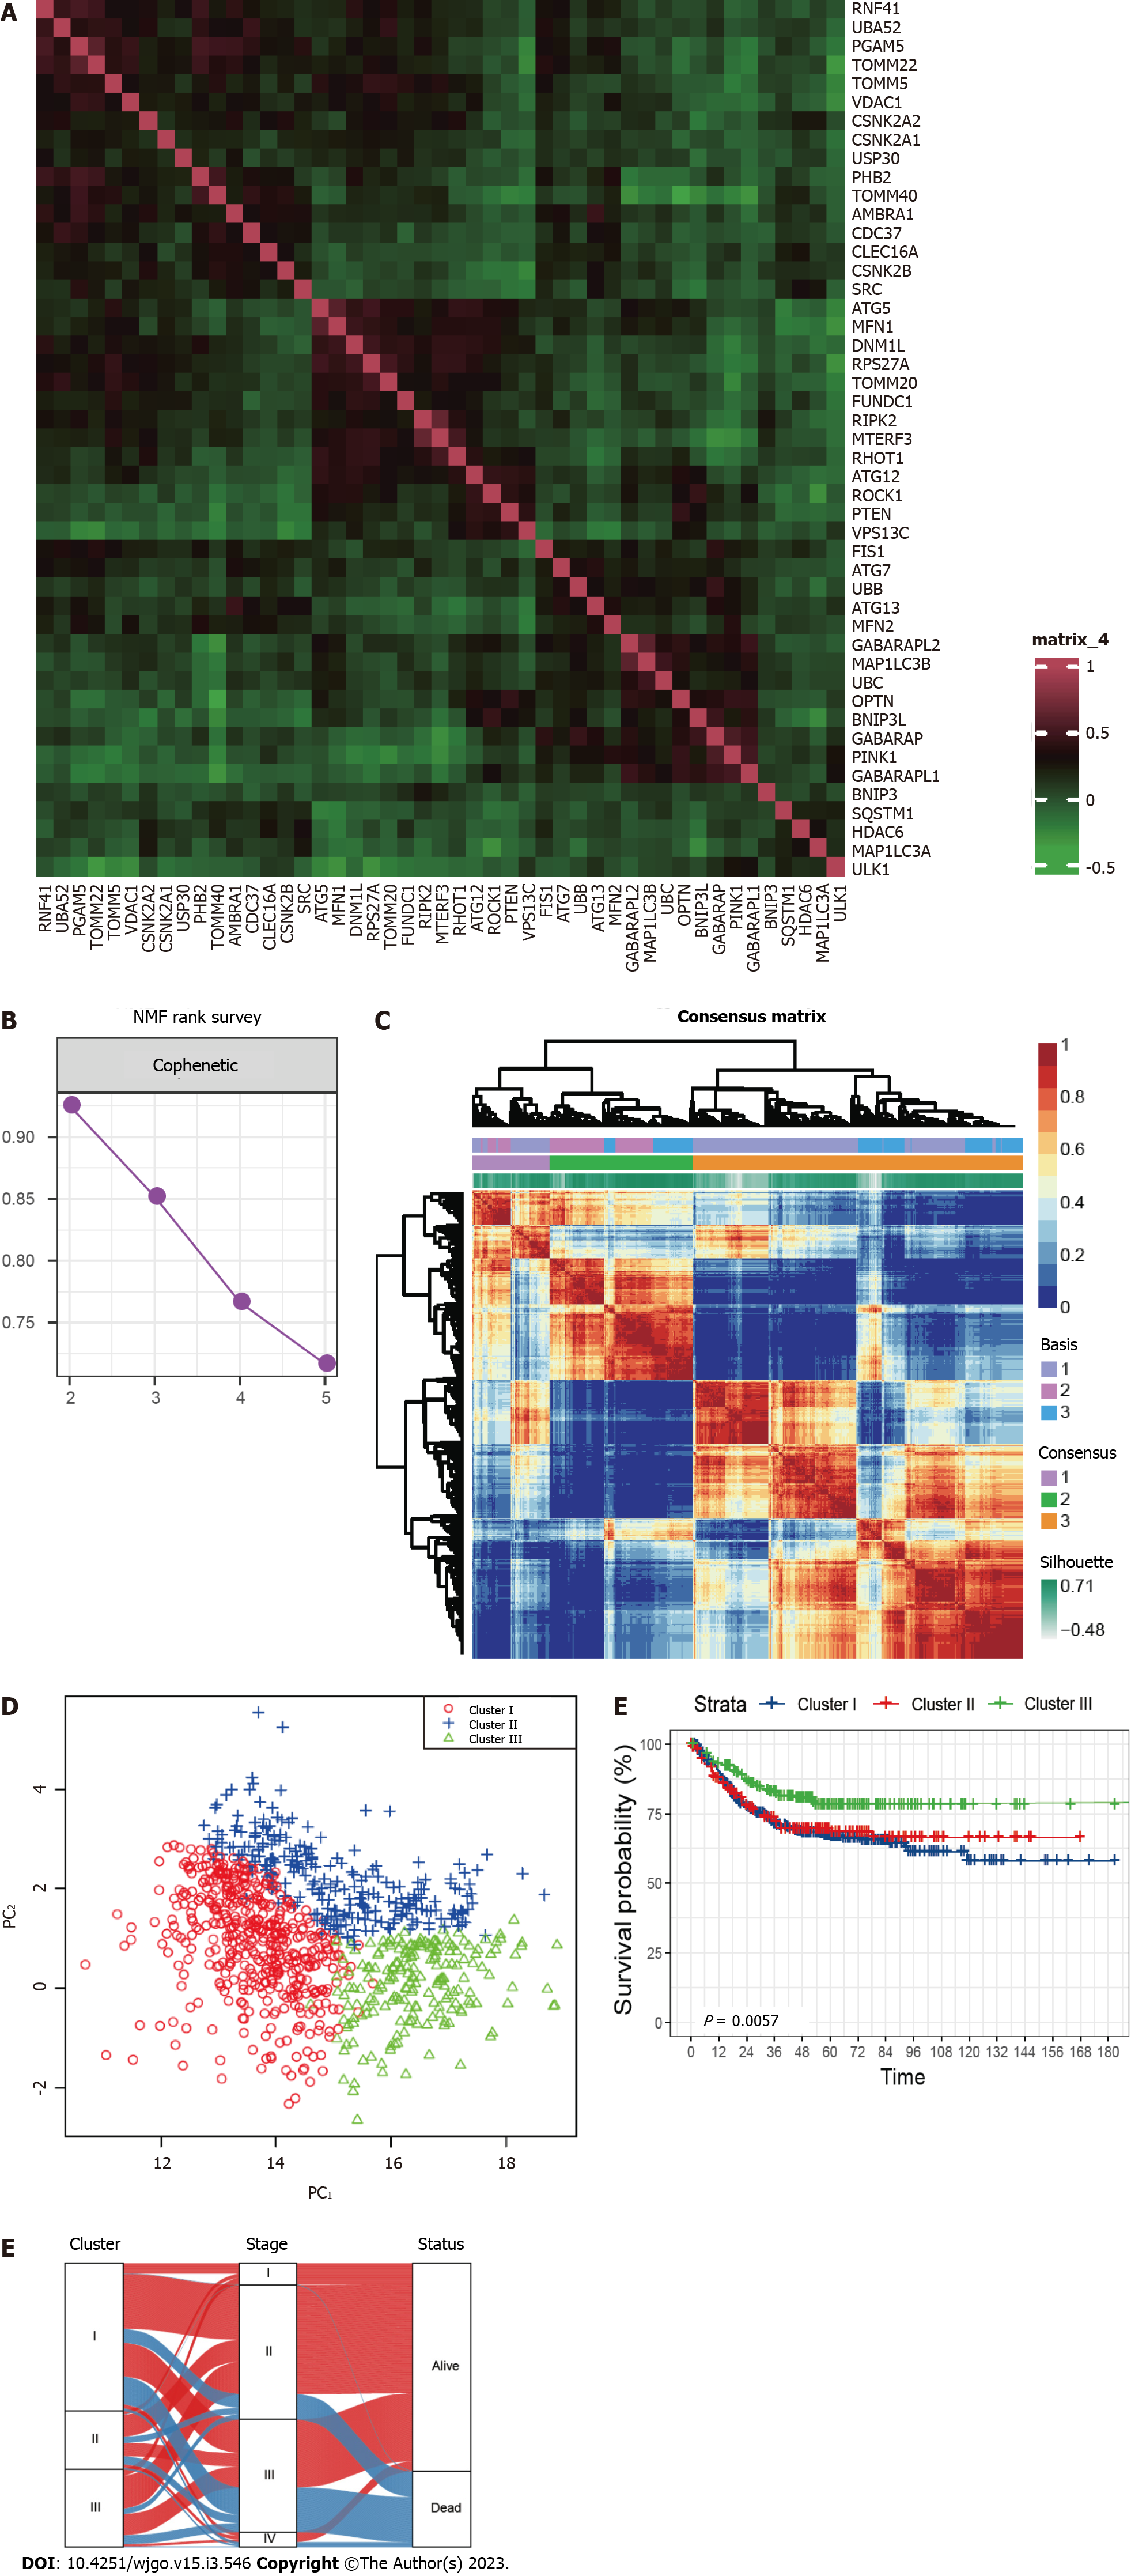
Figure 1 Grouping of mitophagy-related clusters in colorectal cancer.
A: Expression correlation among mitophagy-related genes; B: The cophenetic plot of NMF clustering analyses; C: Heatmap showing three clusters were identified, along with the optimal value for consensus clustering; D: Principal component analysis of three mitophagy-related clusters; E: Kaplan-Meier curves for survival rate of three clusters showing patients in cluster III have the best prognosis (P = 0.0057). The P value was calculated using the log-rank test; F: Alluvial diagram of clusters shows patients in cluster III tend to be early-stage. NMF: Nonnegative Matrix Factorization.
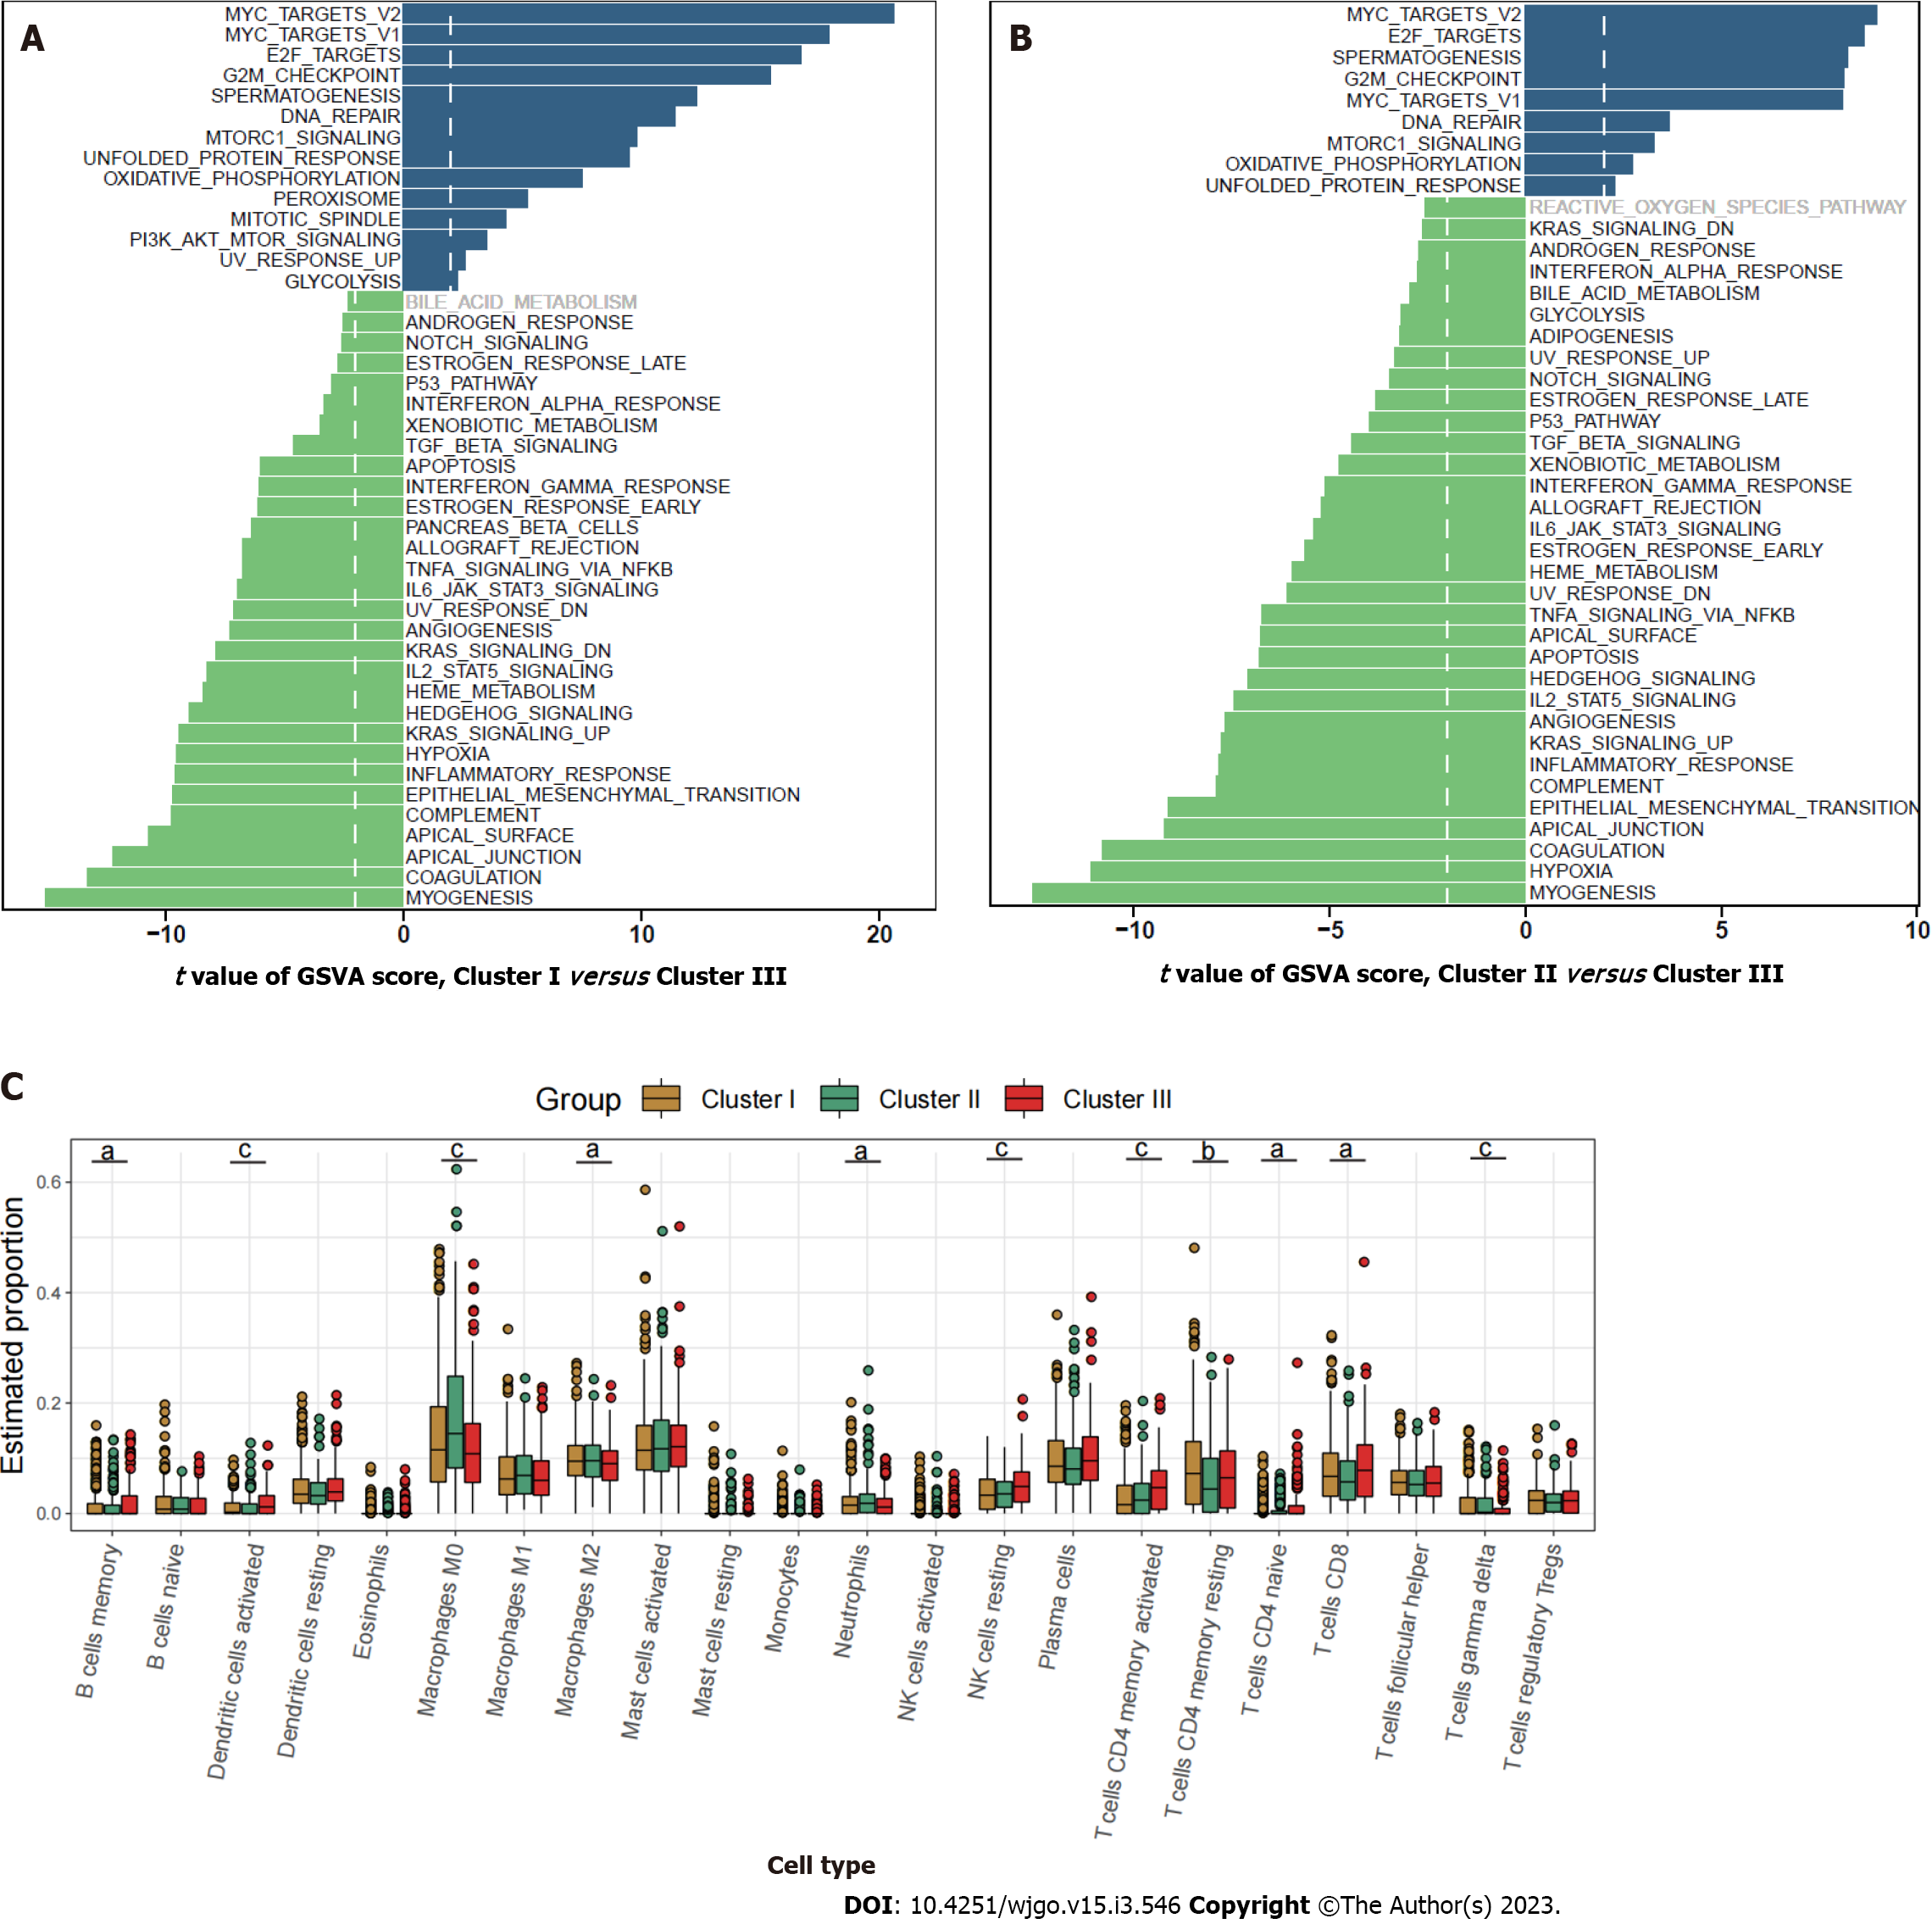
Figure 2 Characterization of the three clusters.
A: Differences in metastasis-related pathways scored by gene set variation analysis (GSVA) between cluster I and cluster III; B: Differences in pathway activities scored by GSVA between cluster II and cluster III; C: Relative abundance of 22 tumor-infiltrating immune cells in each of the three clusters. The statistical differences between the three clusters as determined through the Kruskal-Wallis H test. aP < 0.05; bP < 0.01; cP < 0.001.
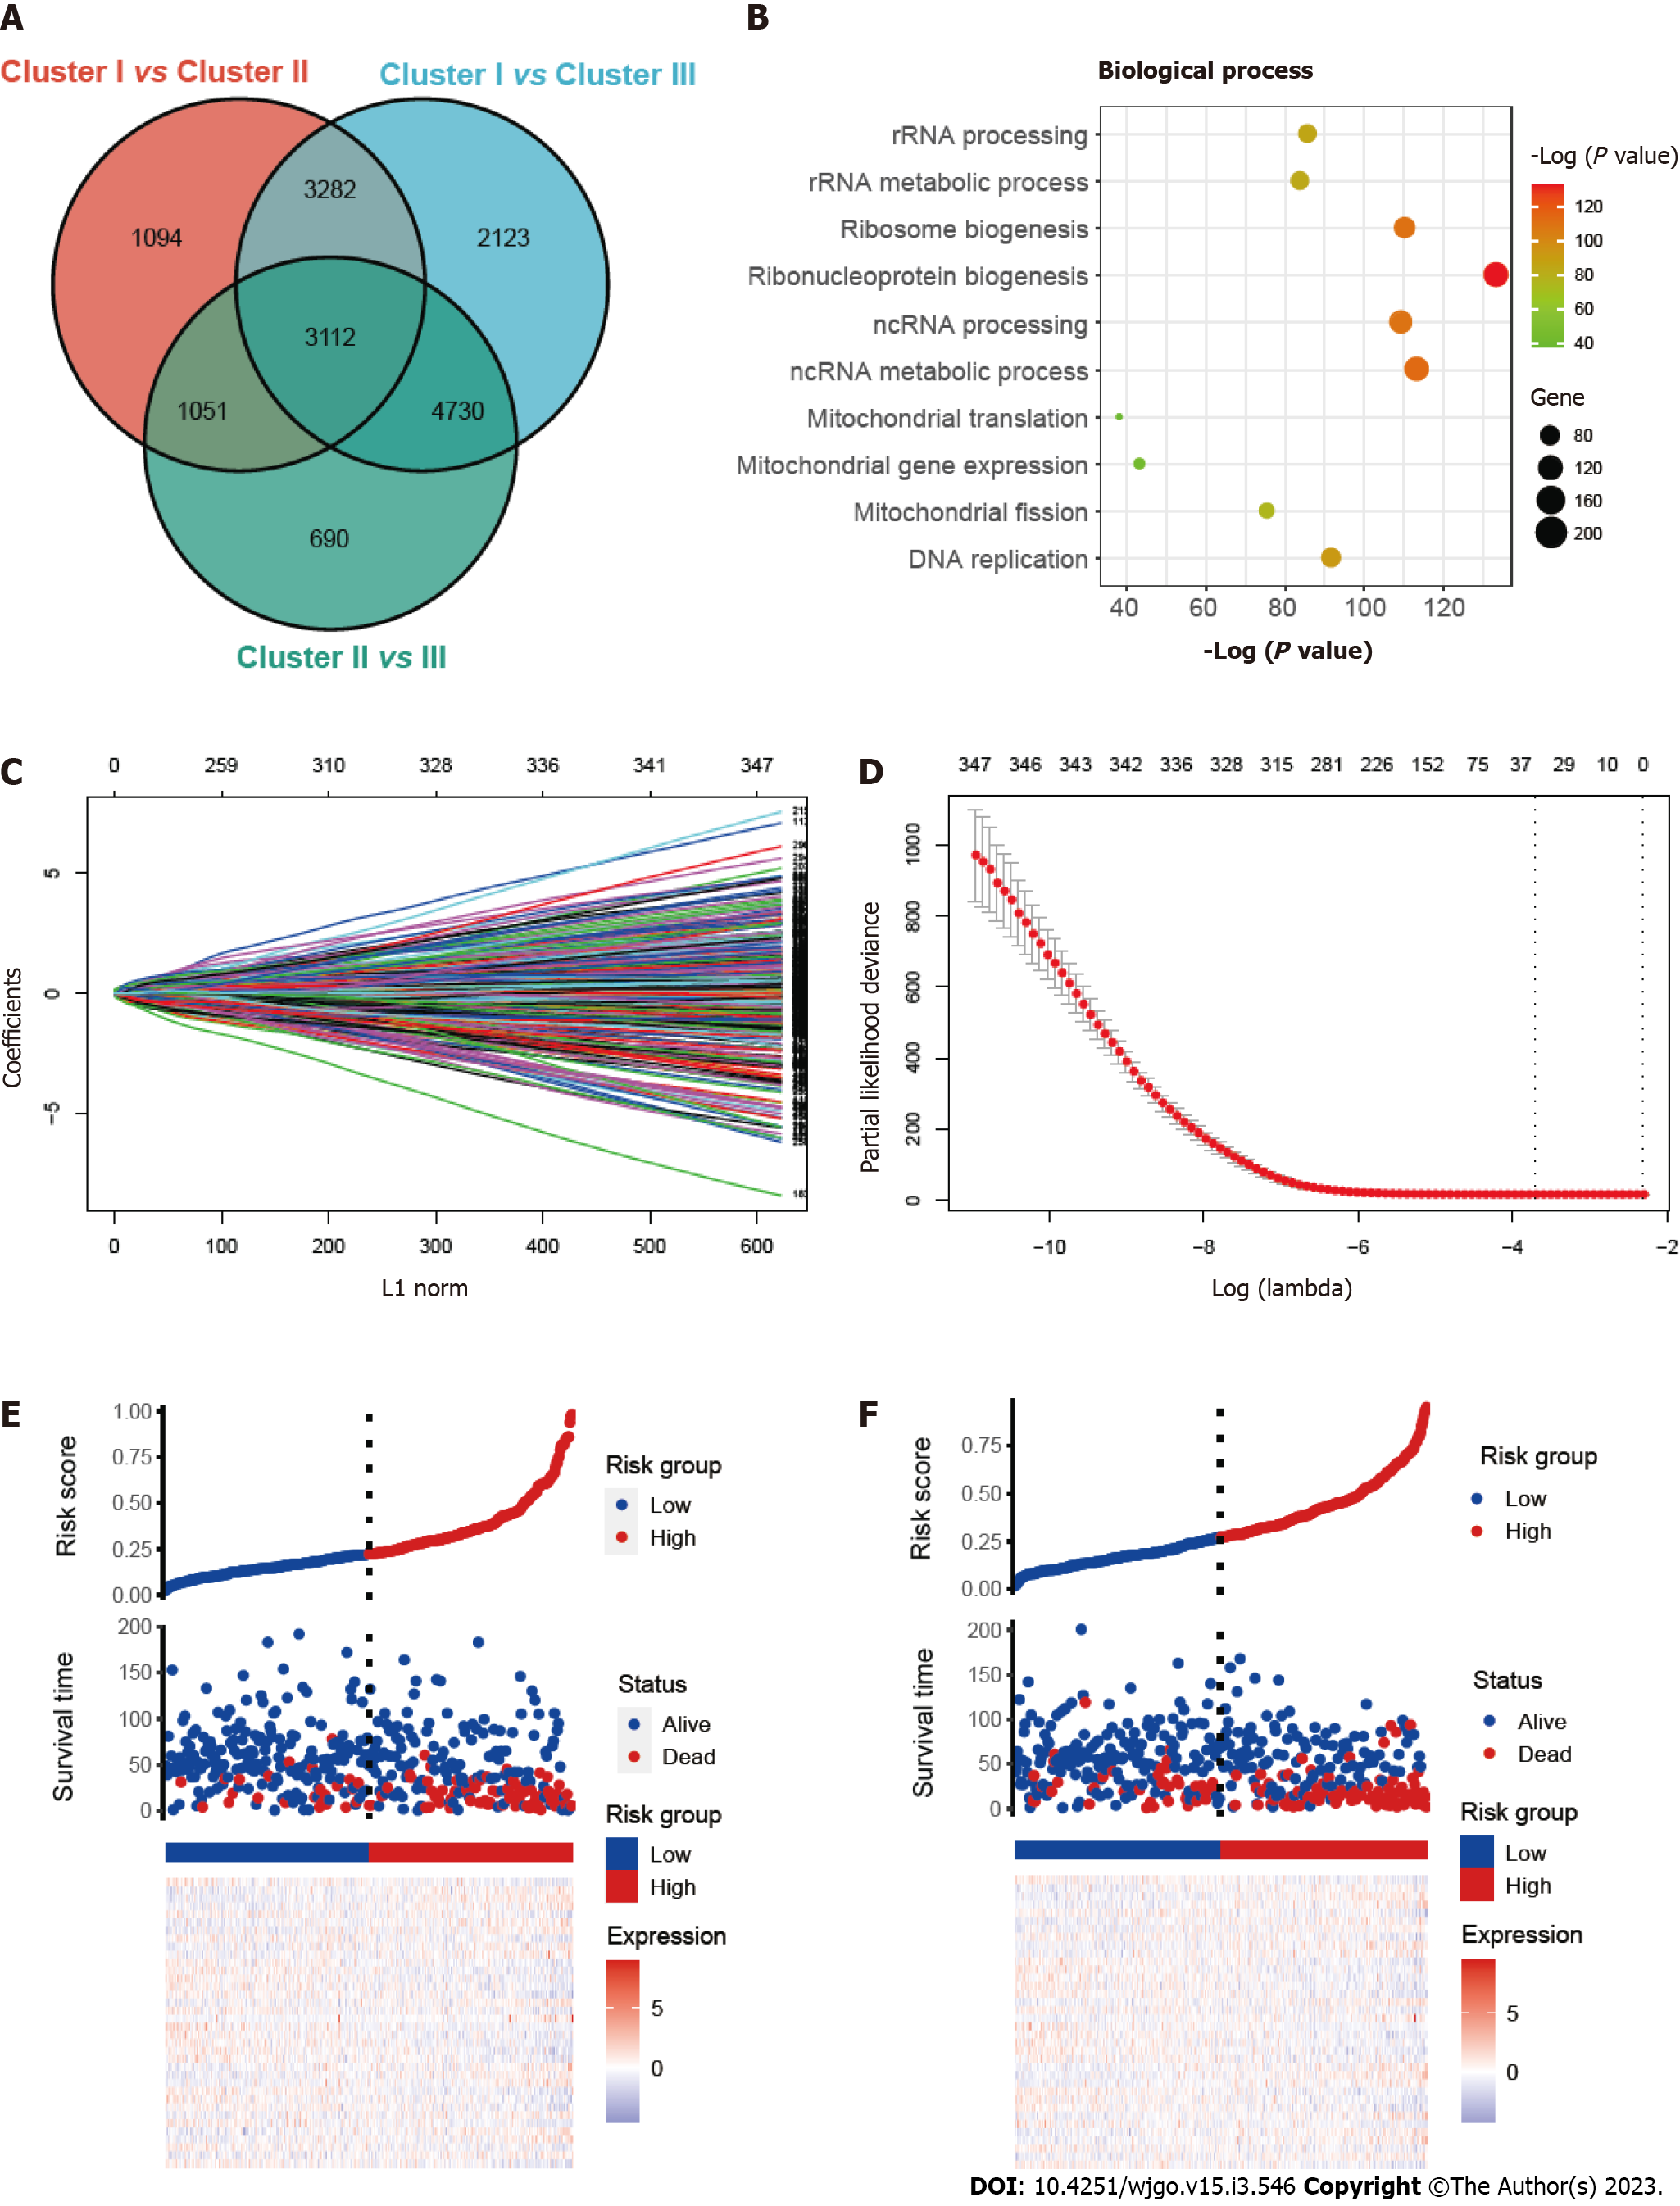
Figure 3 Construction and validation of the prognostic risk_score.
A: Venn diagram showing overlapped genes between the three clusters; B: Gene ontology enrichment (GO) analysis of mitophagy-related genes; C and D: Thirty-six candidate genes screened out by least absolute shrinkage and selection operator method analysis with minimal lambda; E and F: Ranked dot and scatter plots showing risk_score distribution, patient survival status, survival time and expression of 36 mitophagy-related genes in training set and validation set.
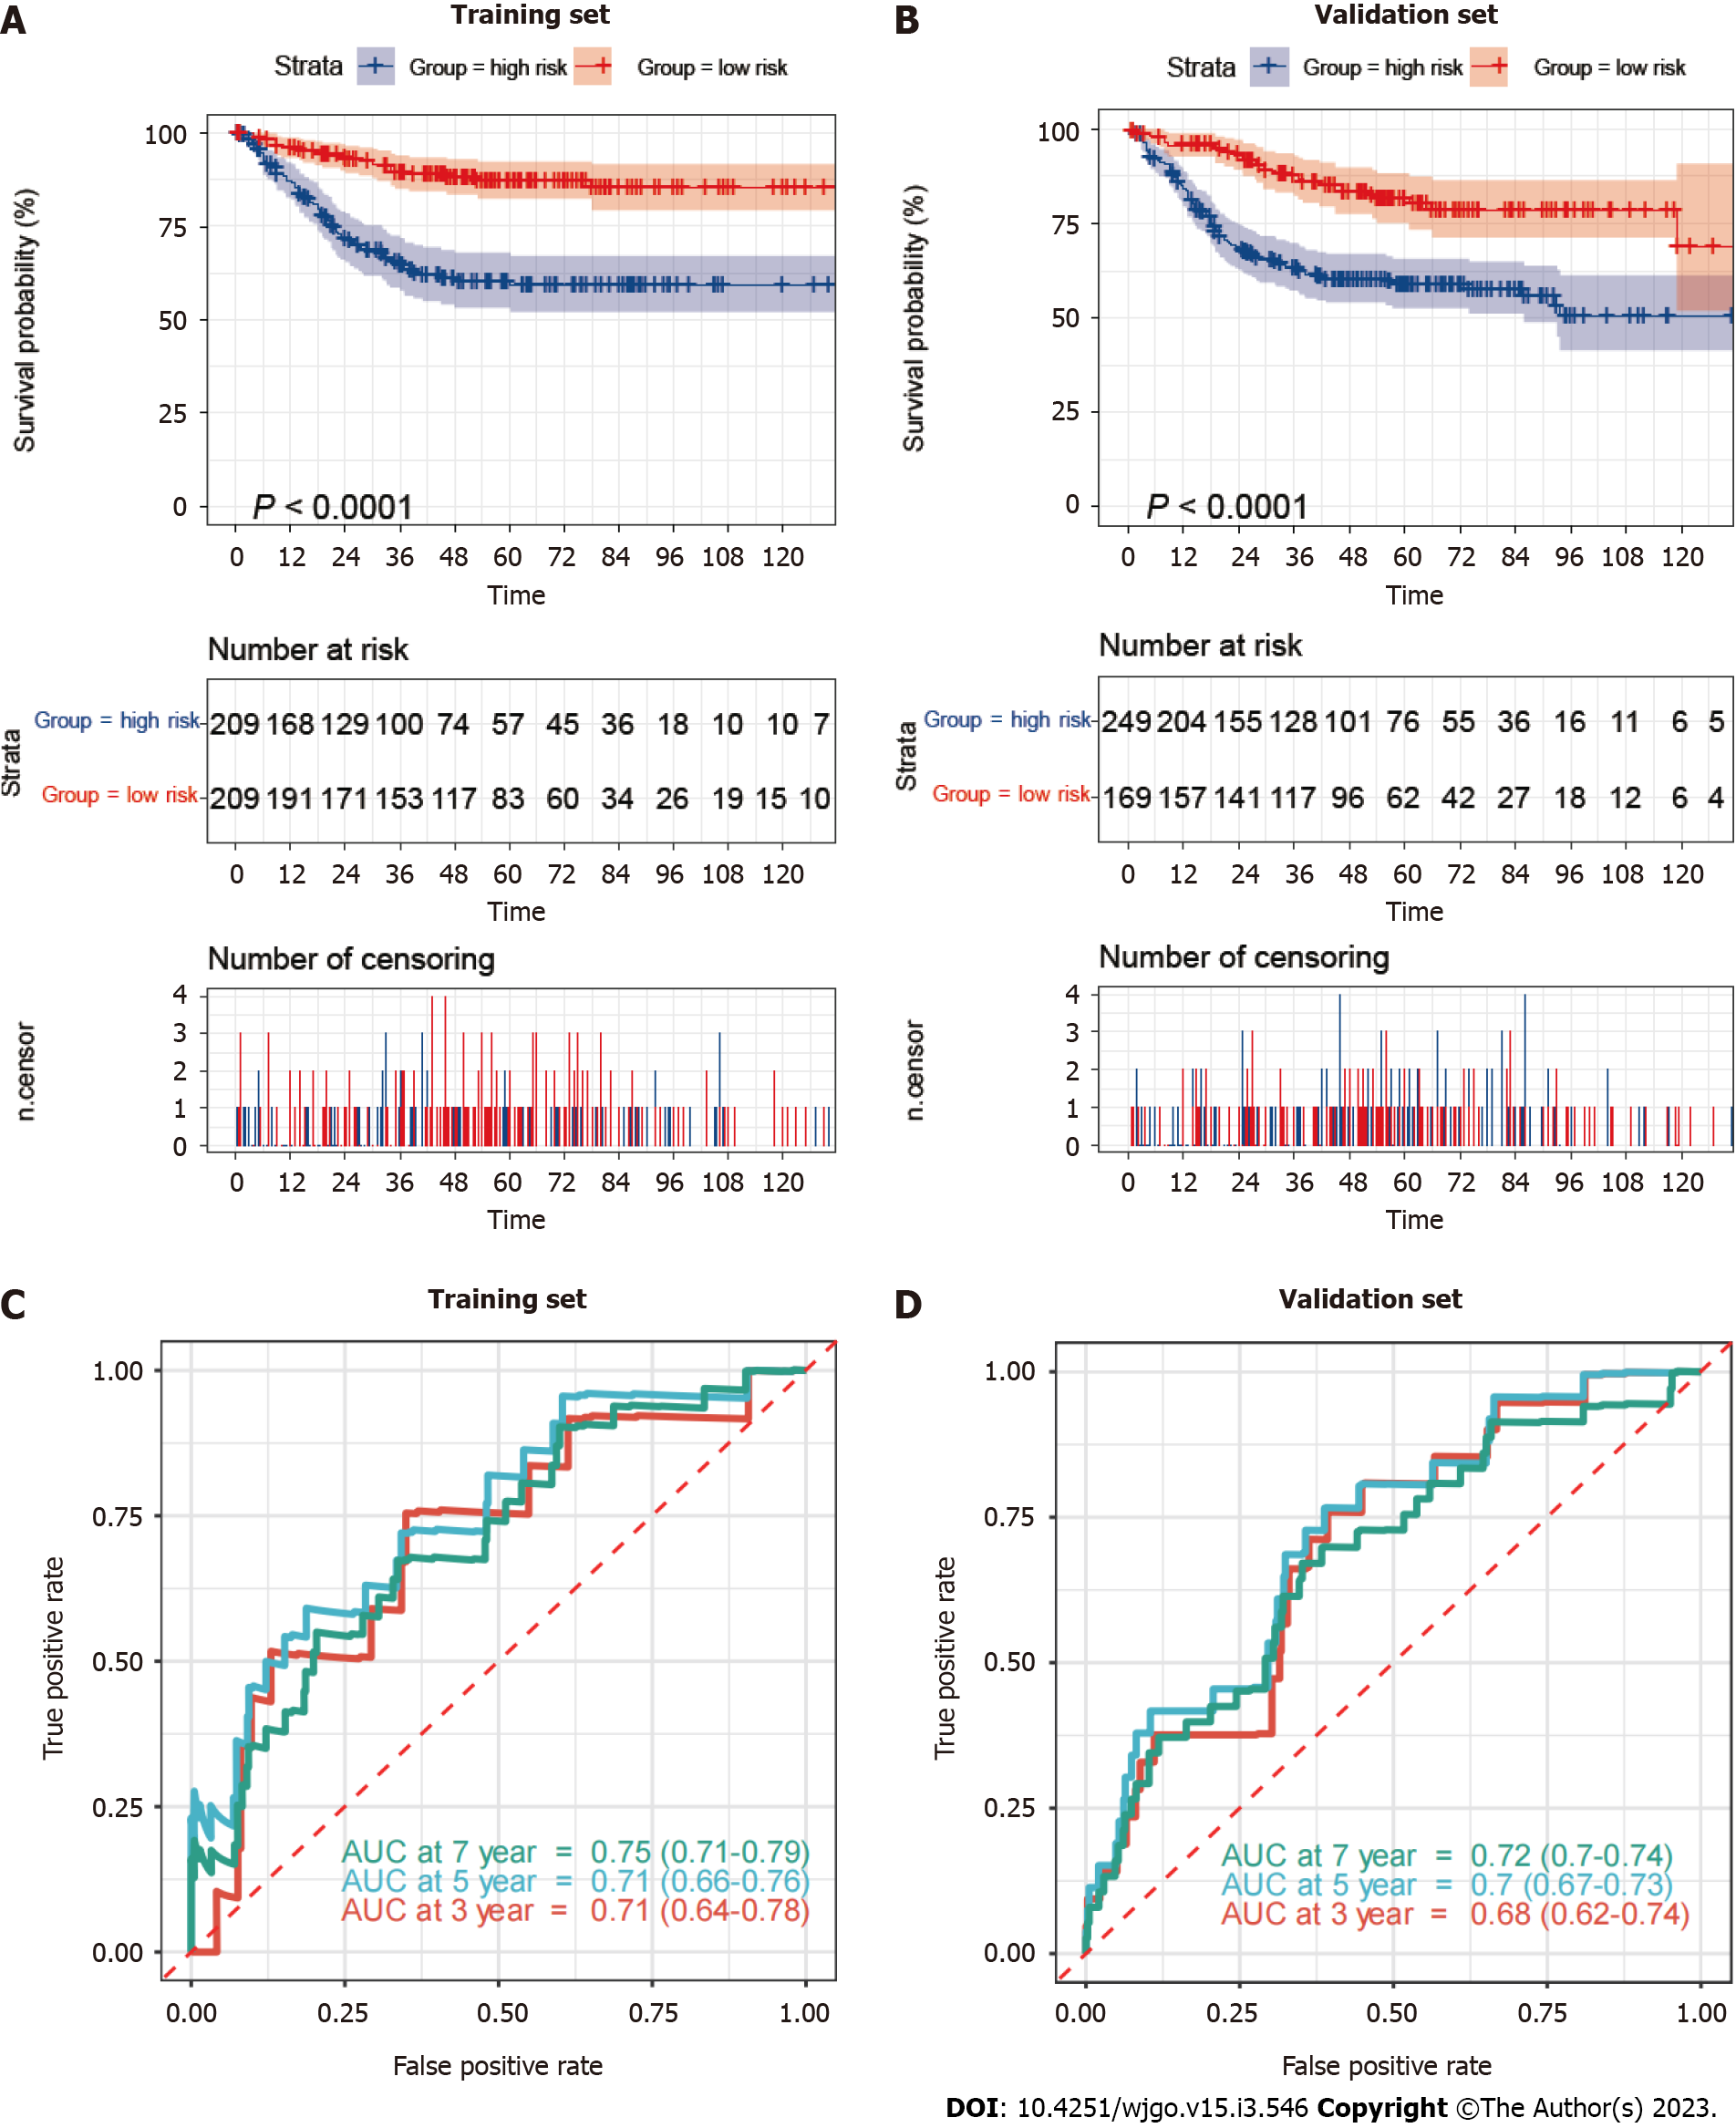
Figure 4 Mitophagy-related gene signatures in training and validation sets.
A and B: Kaplan–Meier survival analysis between high-risk and low-risk patients; C and D: Receiver operator characteristic curves and area under the curve to predict the sensitivity and specificity of 3-, 5-, and 7-year survival according to the risk_score. AUC: Area under the curve.
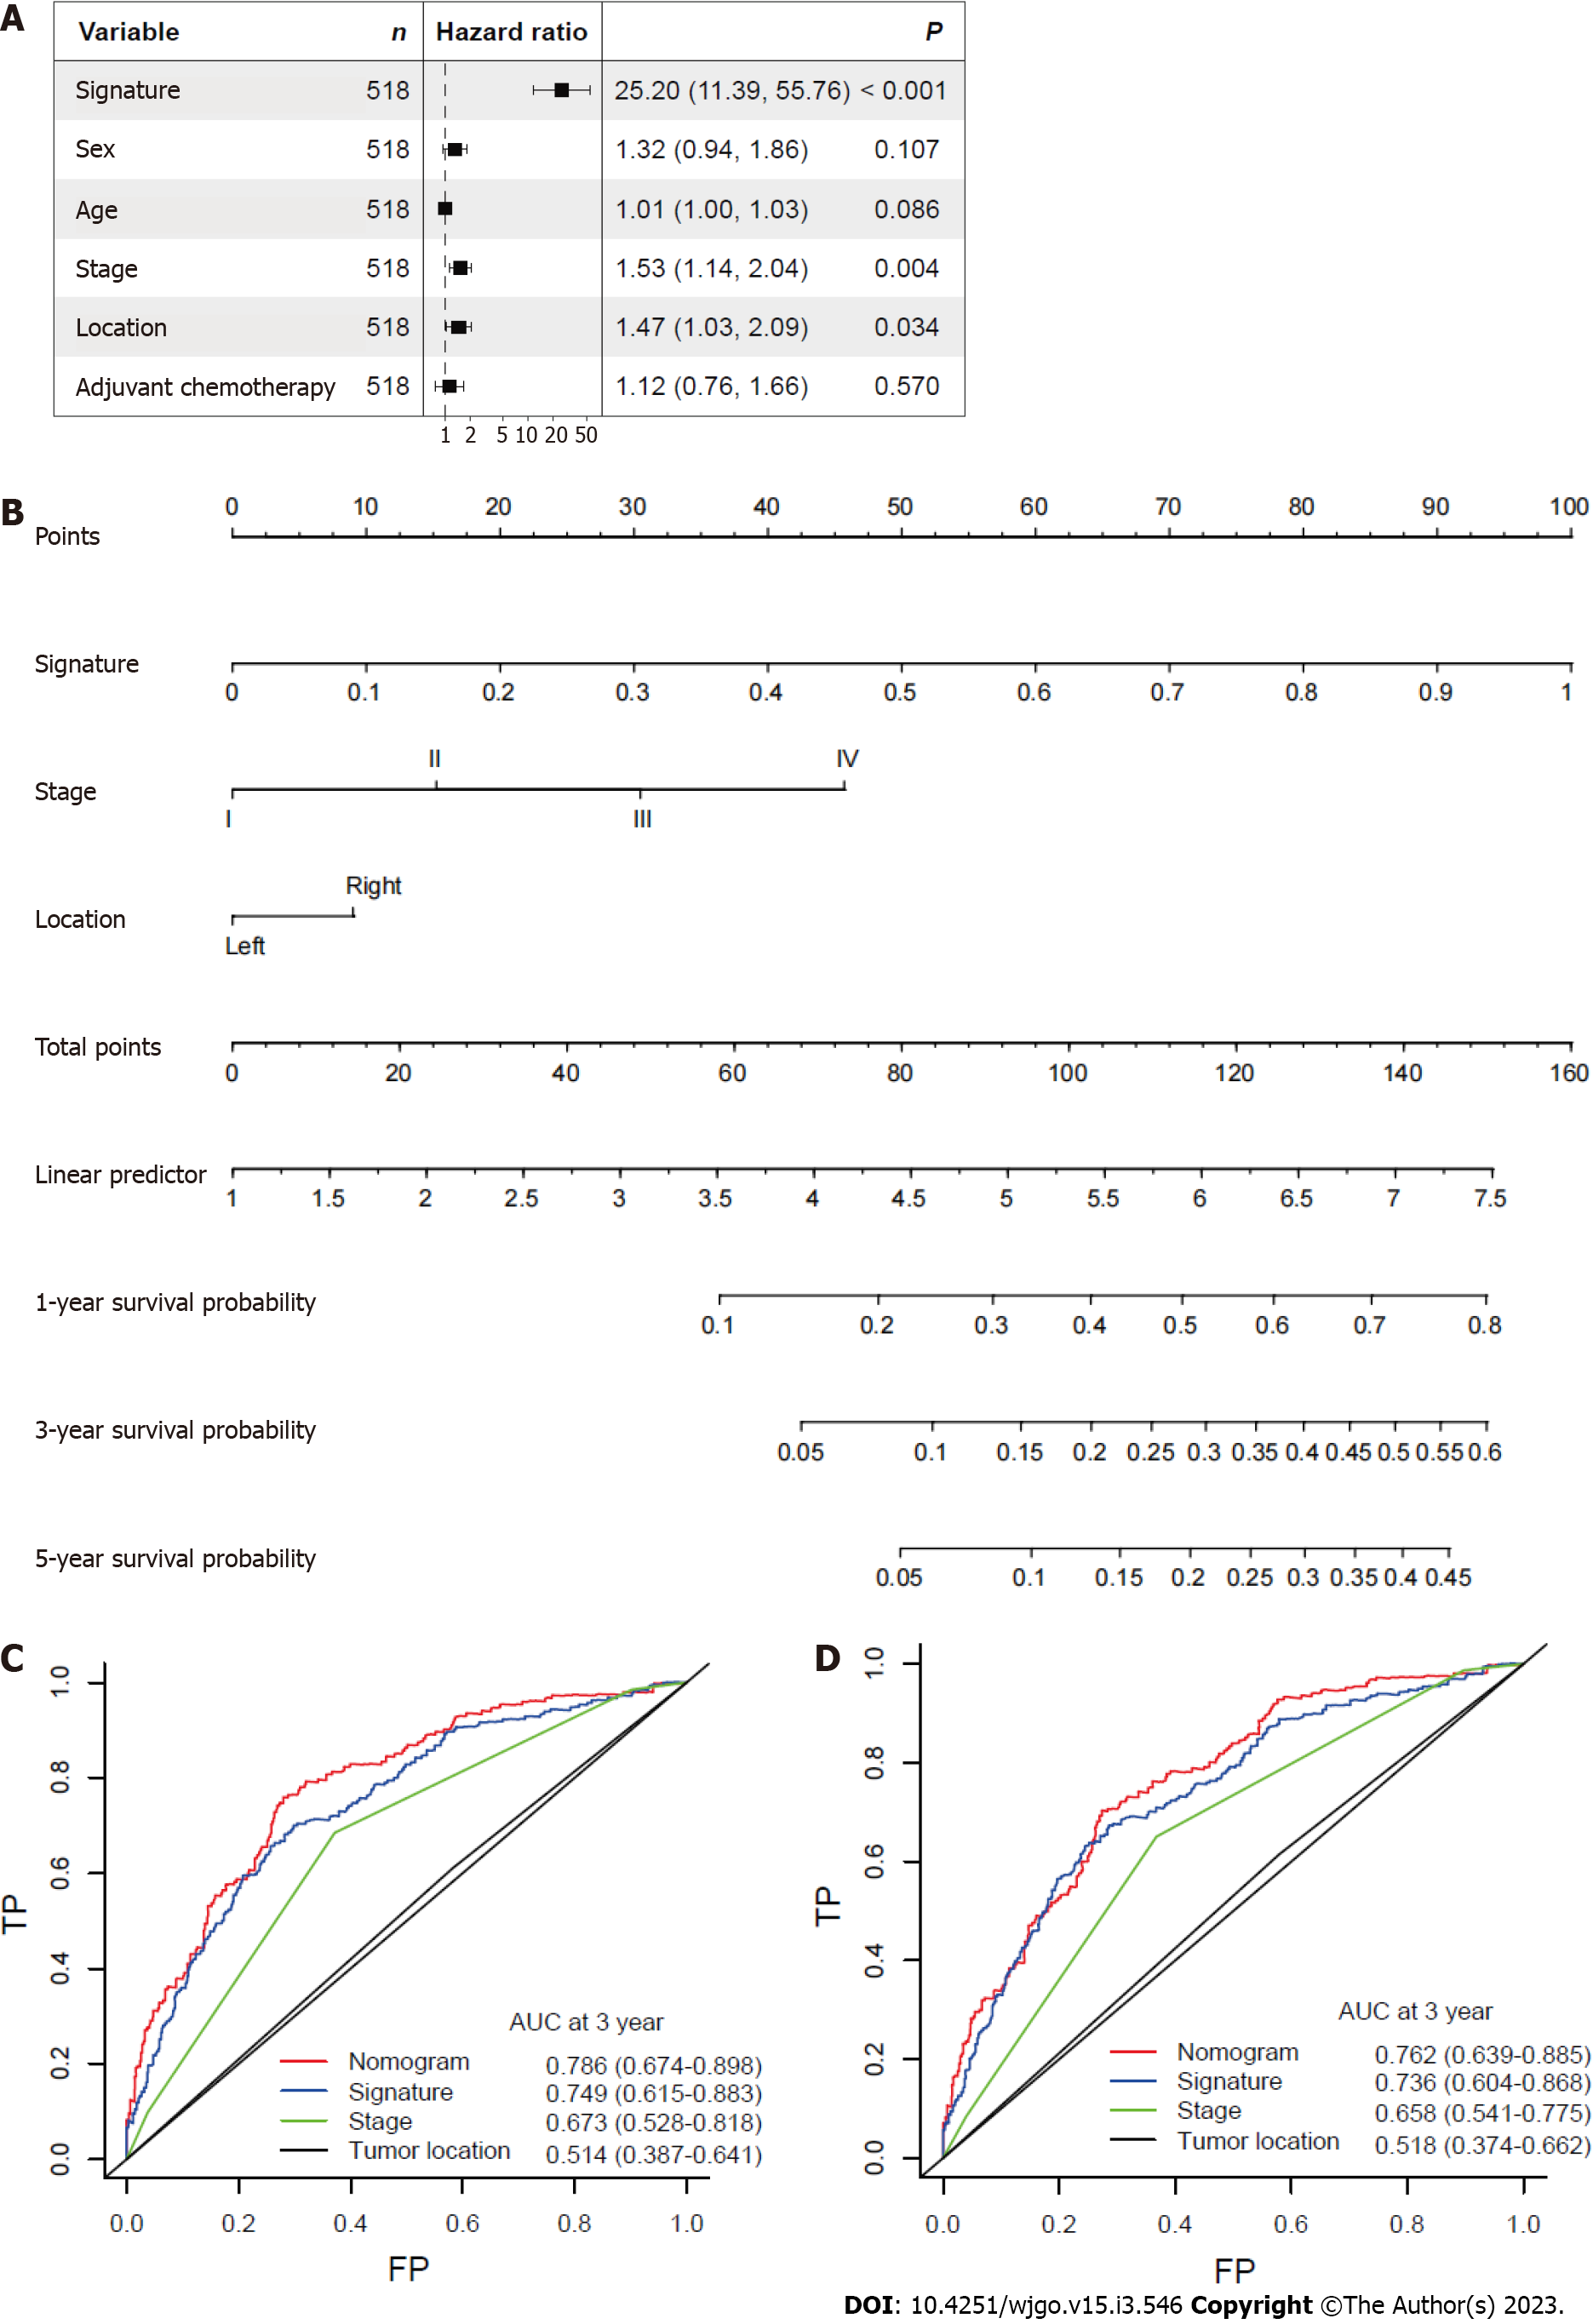
Figure 5 Nomogram based on gene signature.
A: Hazard ratios of the mitophagy-related gene signature after adjusting for other clinicopathological variables by multivariate Cox regression analysis; B: Nomogram integrating risk_score and clinical characteristics; C: Receiver operator characteristic curves of the nomogram, gene signature, stage and tumor location at 3 years; D: Receiver operator characteristic curves of the nomogram, gene signature, stage and tumor location at 5 years. AUC: Area under the curve.
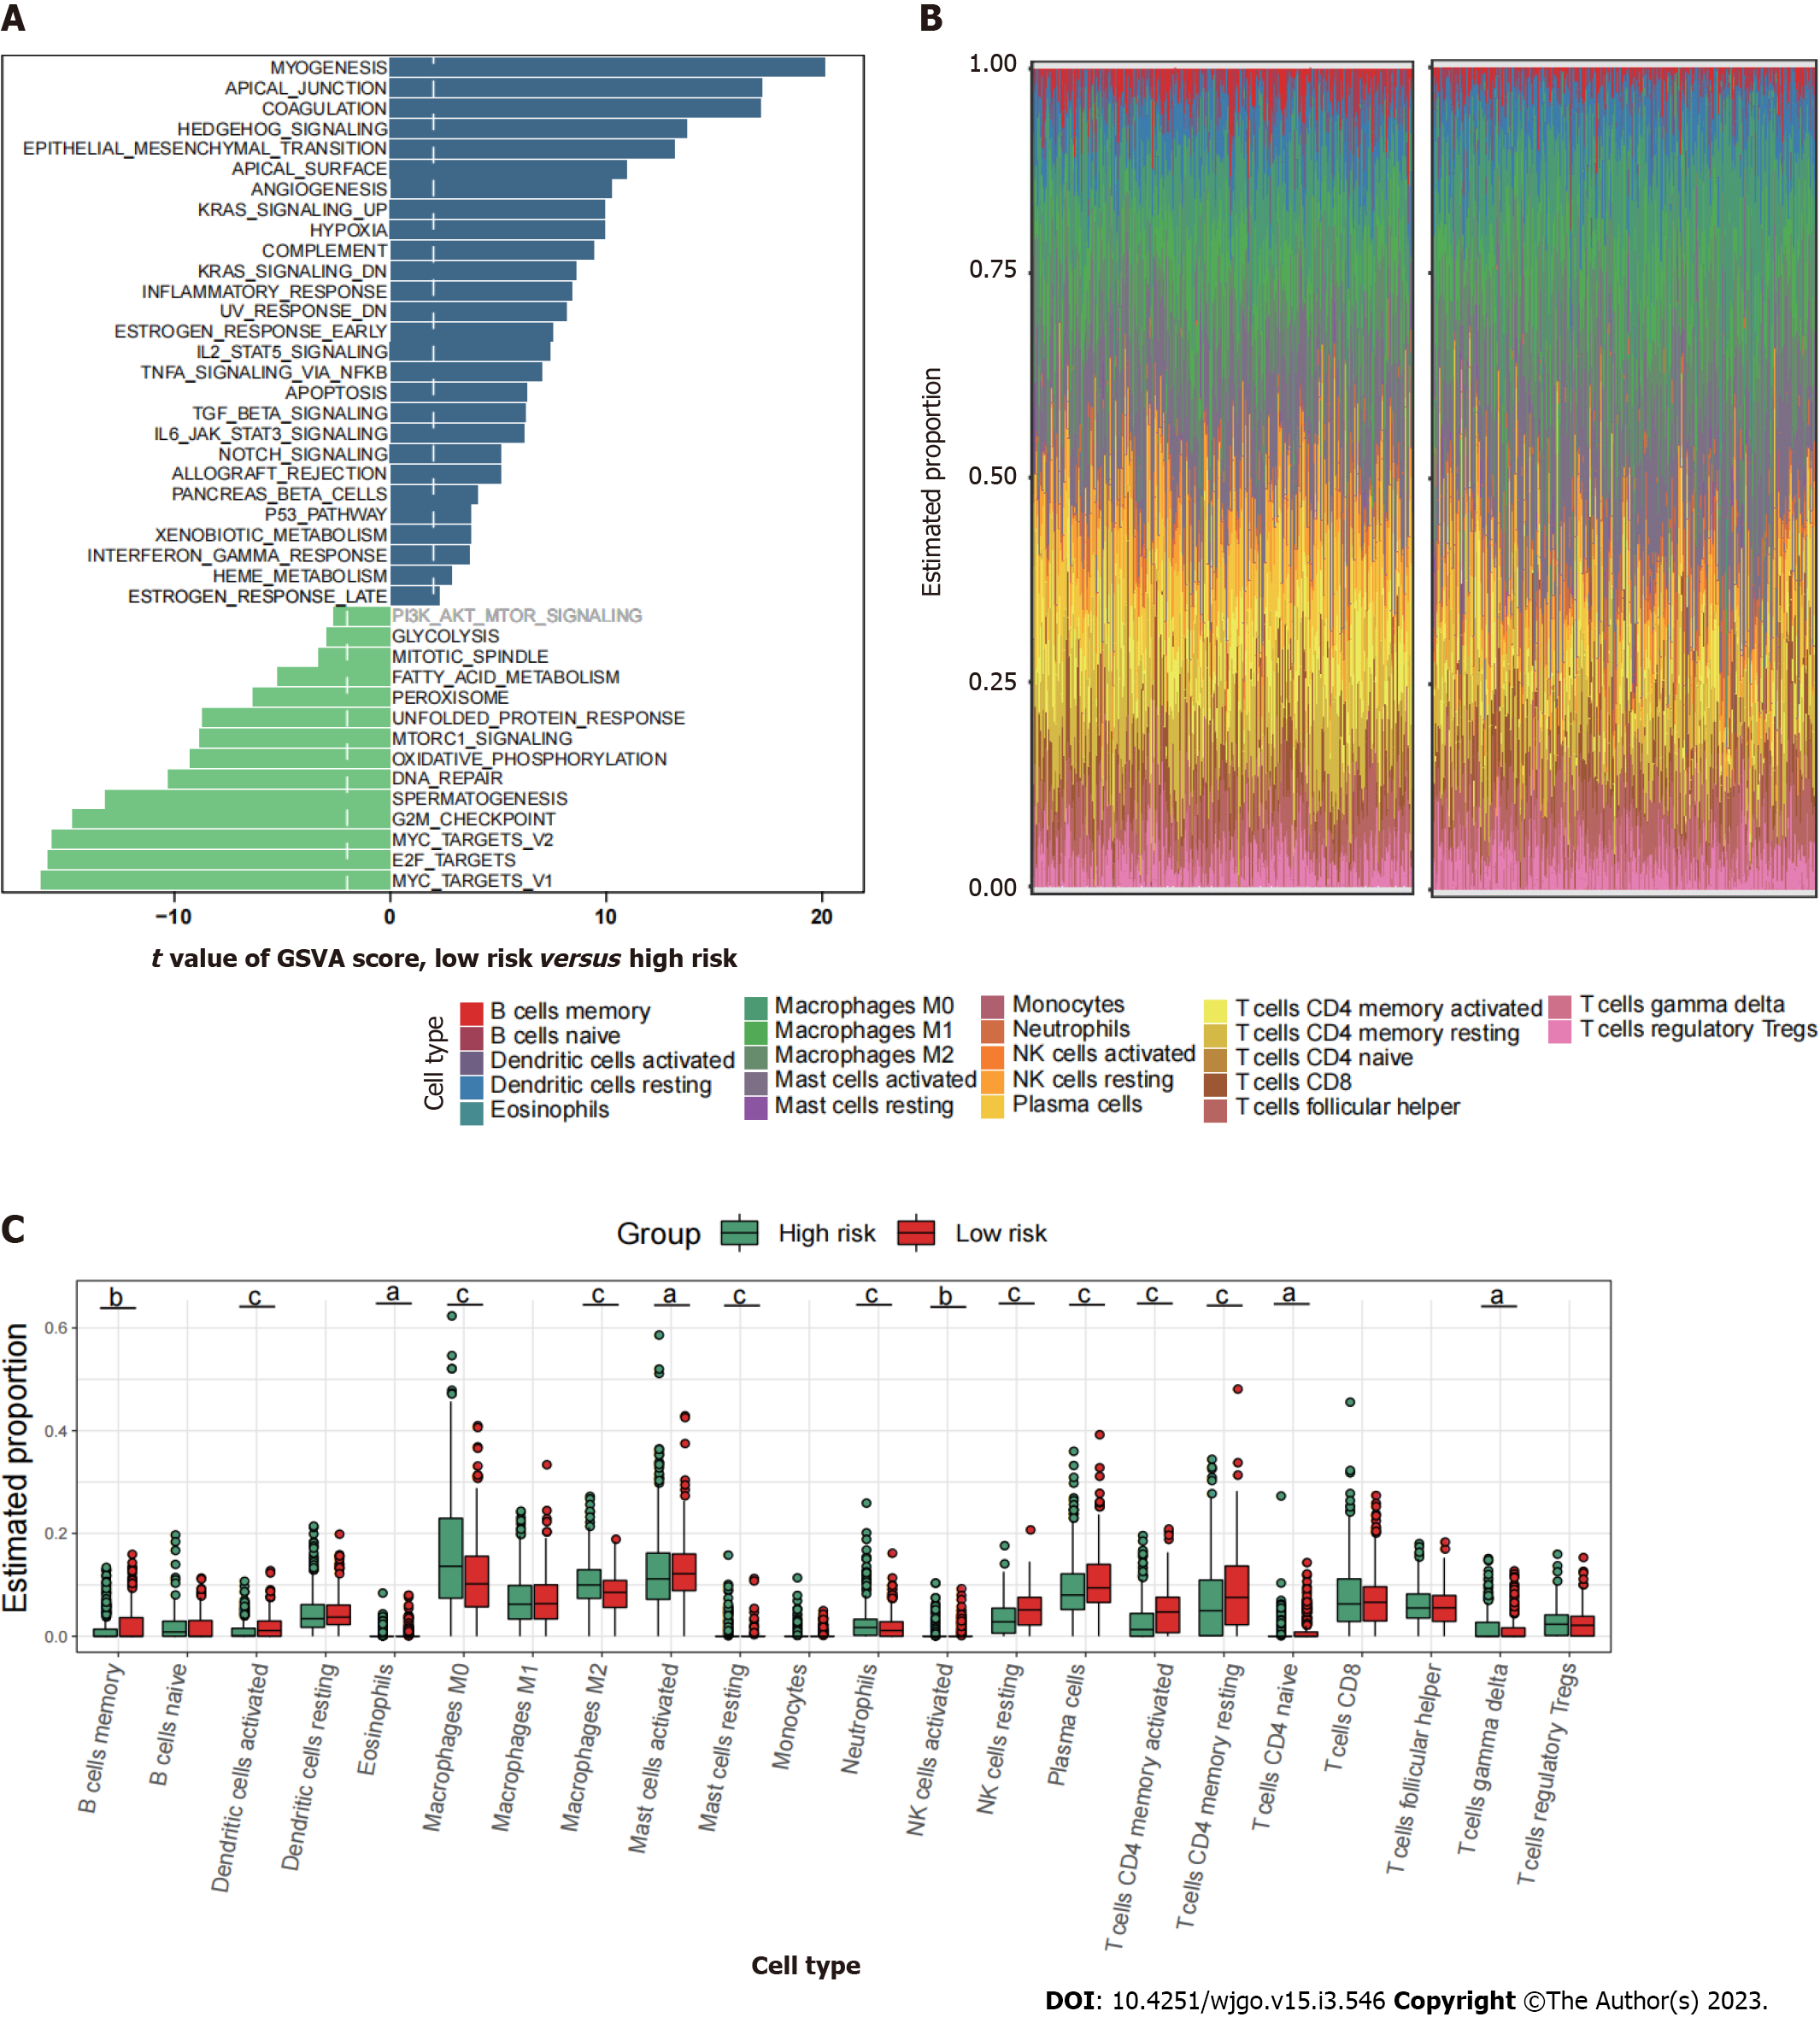
Figure 6 Immune characteristics of the high- and low-risk groups.
A: Differences in metastasis-related pathways scored by gene set variation analysis; B and C: Comparison of the TIICs between the two risk groups. aP < 0.05; bP < 0.01; cP < 0.001.
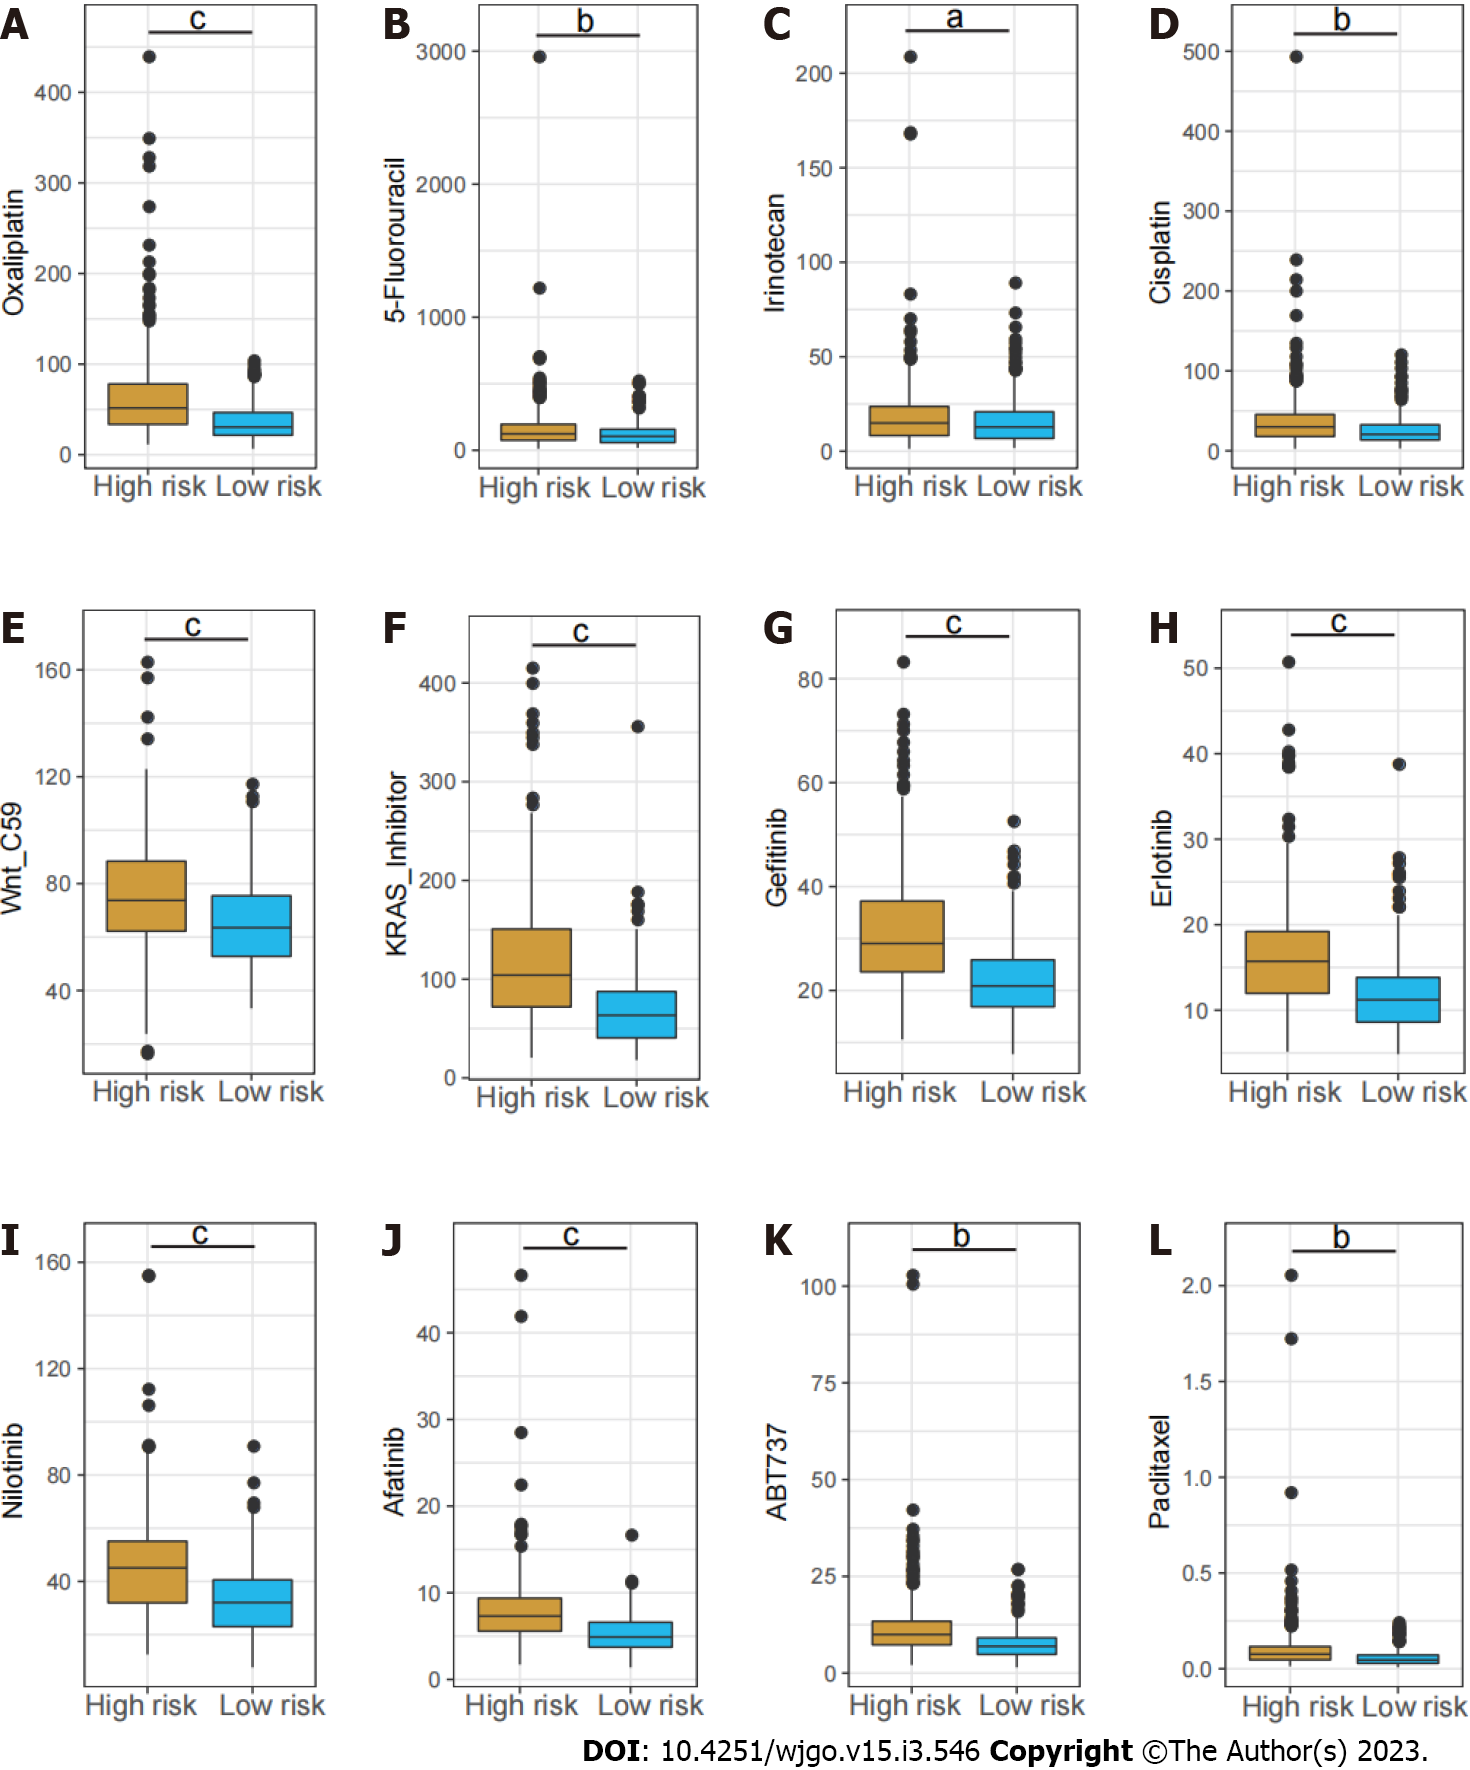
Figure 7 Estimated IC50 of different chemotherapy drugs between the high- and low-risk groups.
A: Oxaliplatin; B: 5-Fluorouracil; C: Irinotecan; D: Cisplatin; E: Wnt_C59; F: KRAS_Inhibitor; G: Gefitinib; H: Erlotinib; I: Nilotinib; J: Afatinib; K: ABT737; L: Paclitaxel. aP < 0.05; bP < 0.01; cP < 0.001.
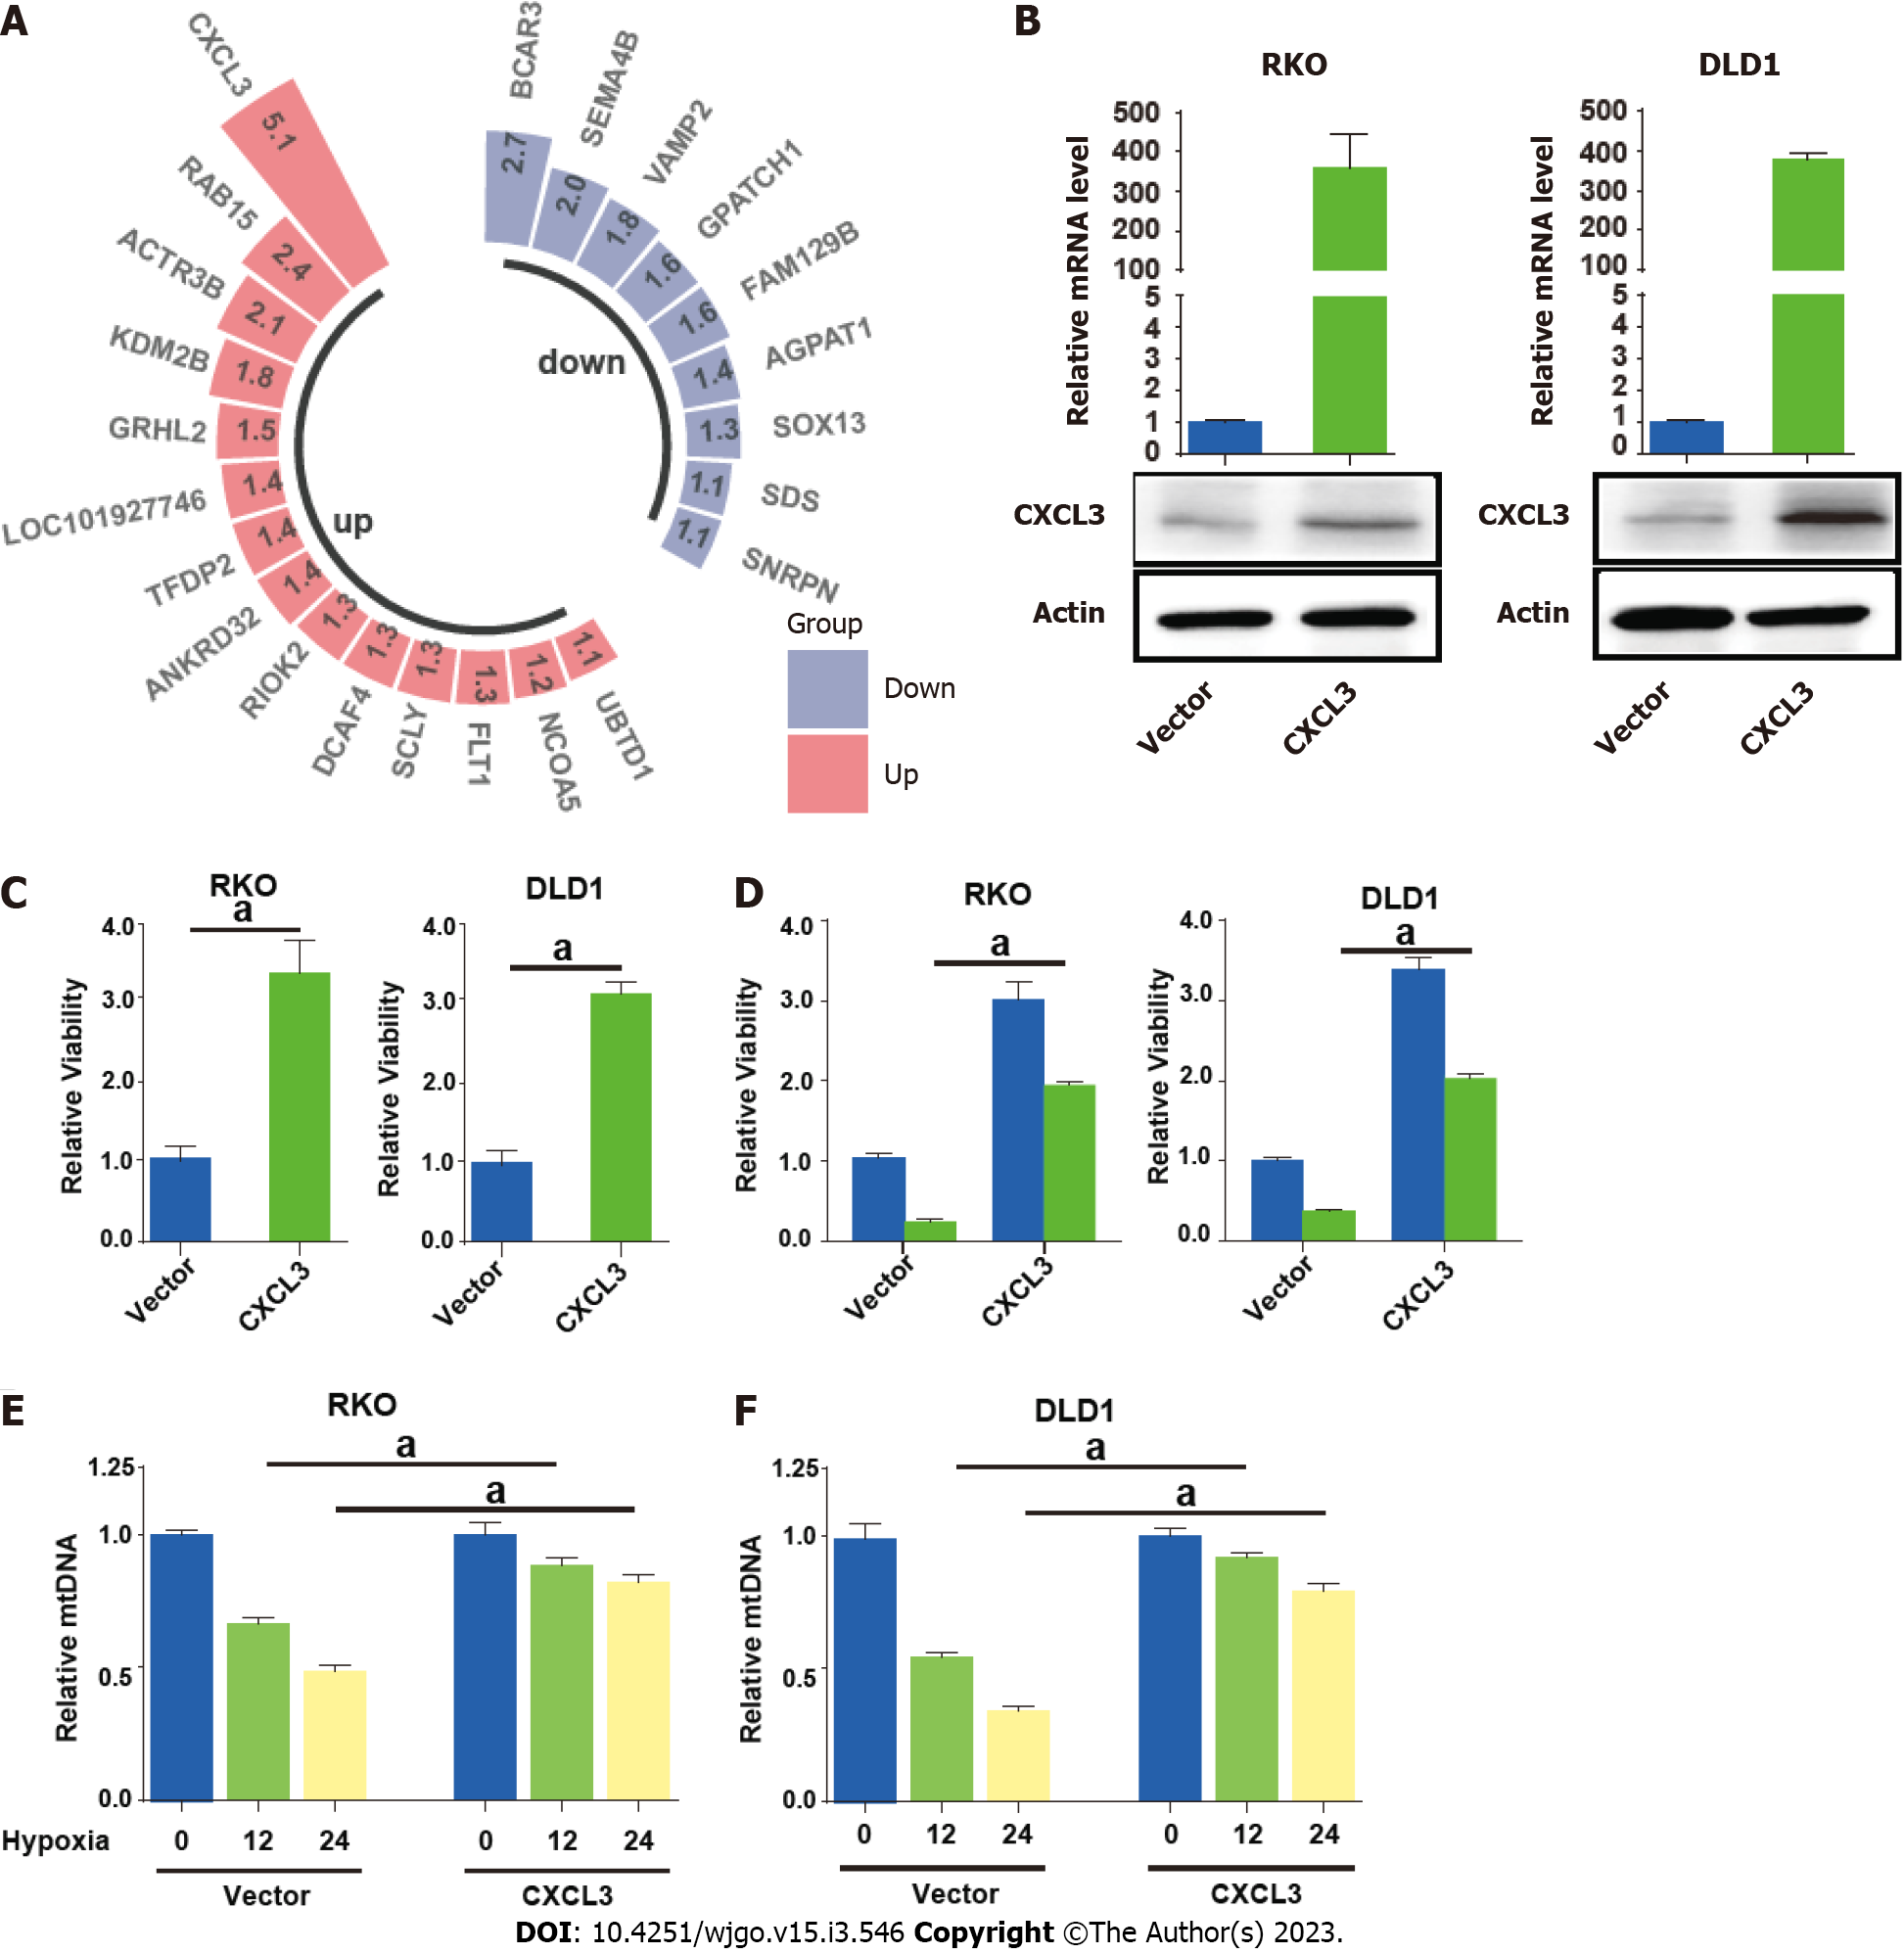
Figure 8 CXCL3 attenuates mitophagy in colorectal cancer cells.
A: Differentially expressed mitophagy related genes included in the signature; B: quantitative reverse transcriptase polymerase chain reaction (qRT-PCR) and Western blot showing enforced expression of CXCL3 in colorectal cancer (CRC) cells; C: CXCL3 overexpression significantly enhanced cell proliferation and cell viability; D: CXCL3 overexpression weakened the sensitivity of CRC cells to oxaliplatin treatment; E and F: The mtDNA of CRC cells with or with CXCL3 overexpression was detected using qRT-PCR. aP < 0.05; bP < 0.01; cP < 0.001.
- Citation: Weng JS, Huang JP, Yu W, Xiao J, Lin F, Lin KN, Zang WD, Ye Y, Lin JP. Mitophagy-related gene signature predicts prognosis, immune infiltration and chemotherapy sensitivity in colorectal cancer. World J Gastrointest Oncol 2023; 15(3): 546-561
- URL: https://www.wjgnet.com/1948-5204/full/v15/i3/546.htm
- DOI: https://dx.doi.org/10.4251/wjgo.v15.i3.546


