Copyright
©The Author(s) 2022.
World J Gastrointest Oncol. Apr 15, 2022; 14(4): 920-934
Published online Apr 15, 2022. doi: 10.4251/wjgo.v14.i4.920
Published online Apr 15, 2022. doi: 10.4251/wjgo.v14.i4.920
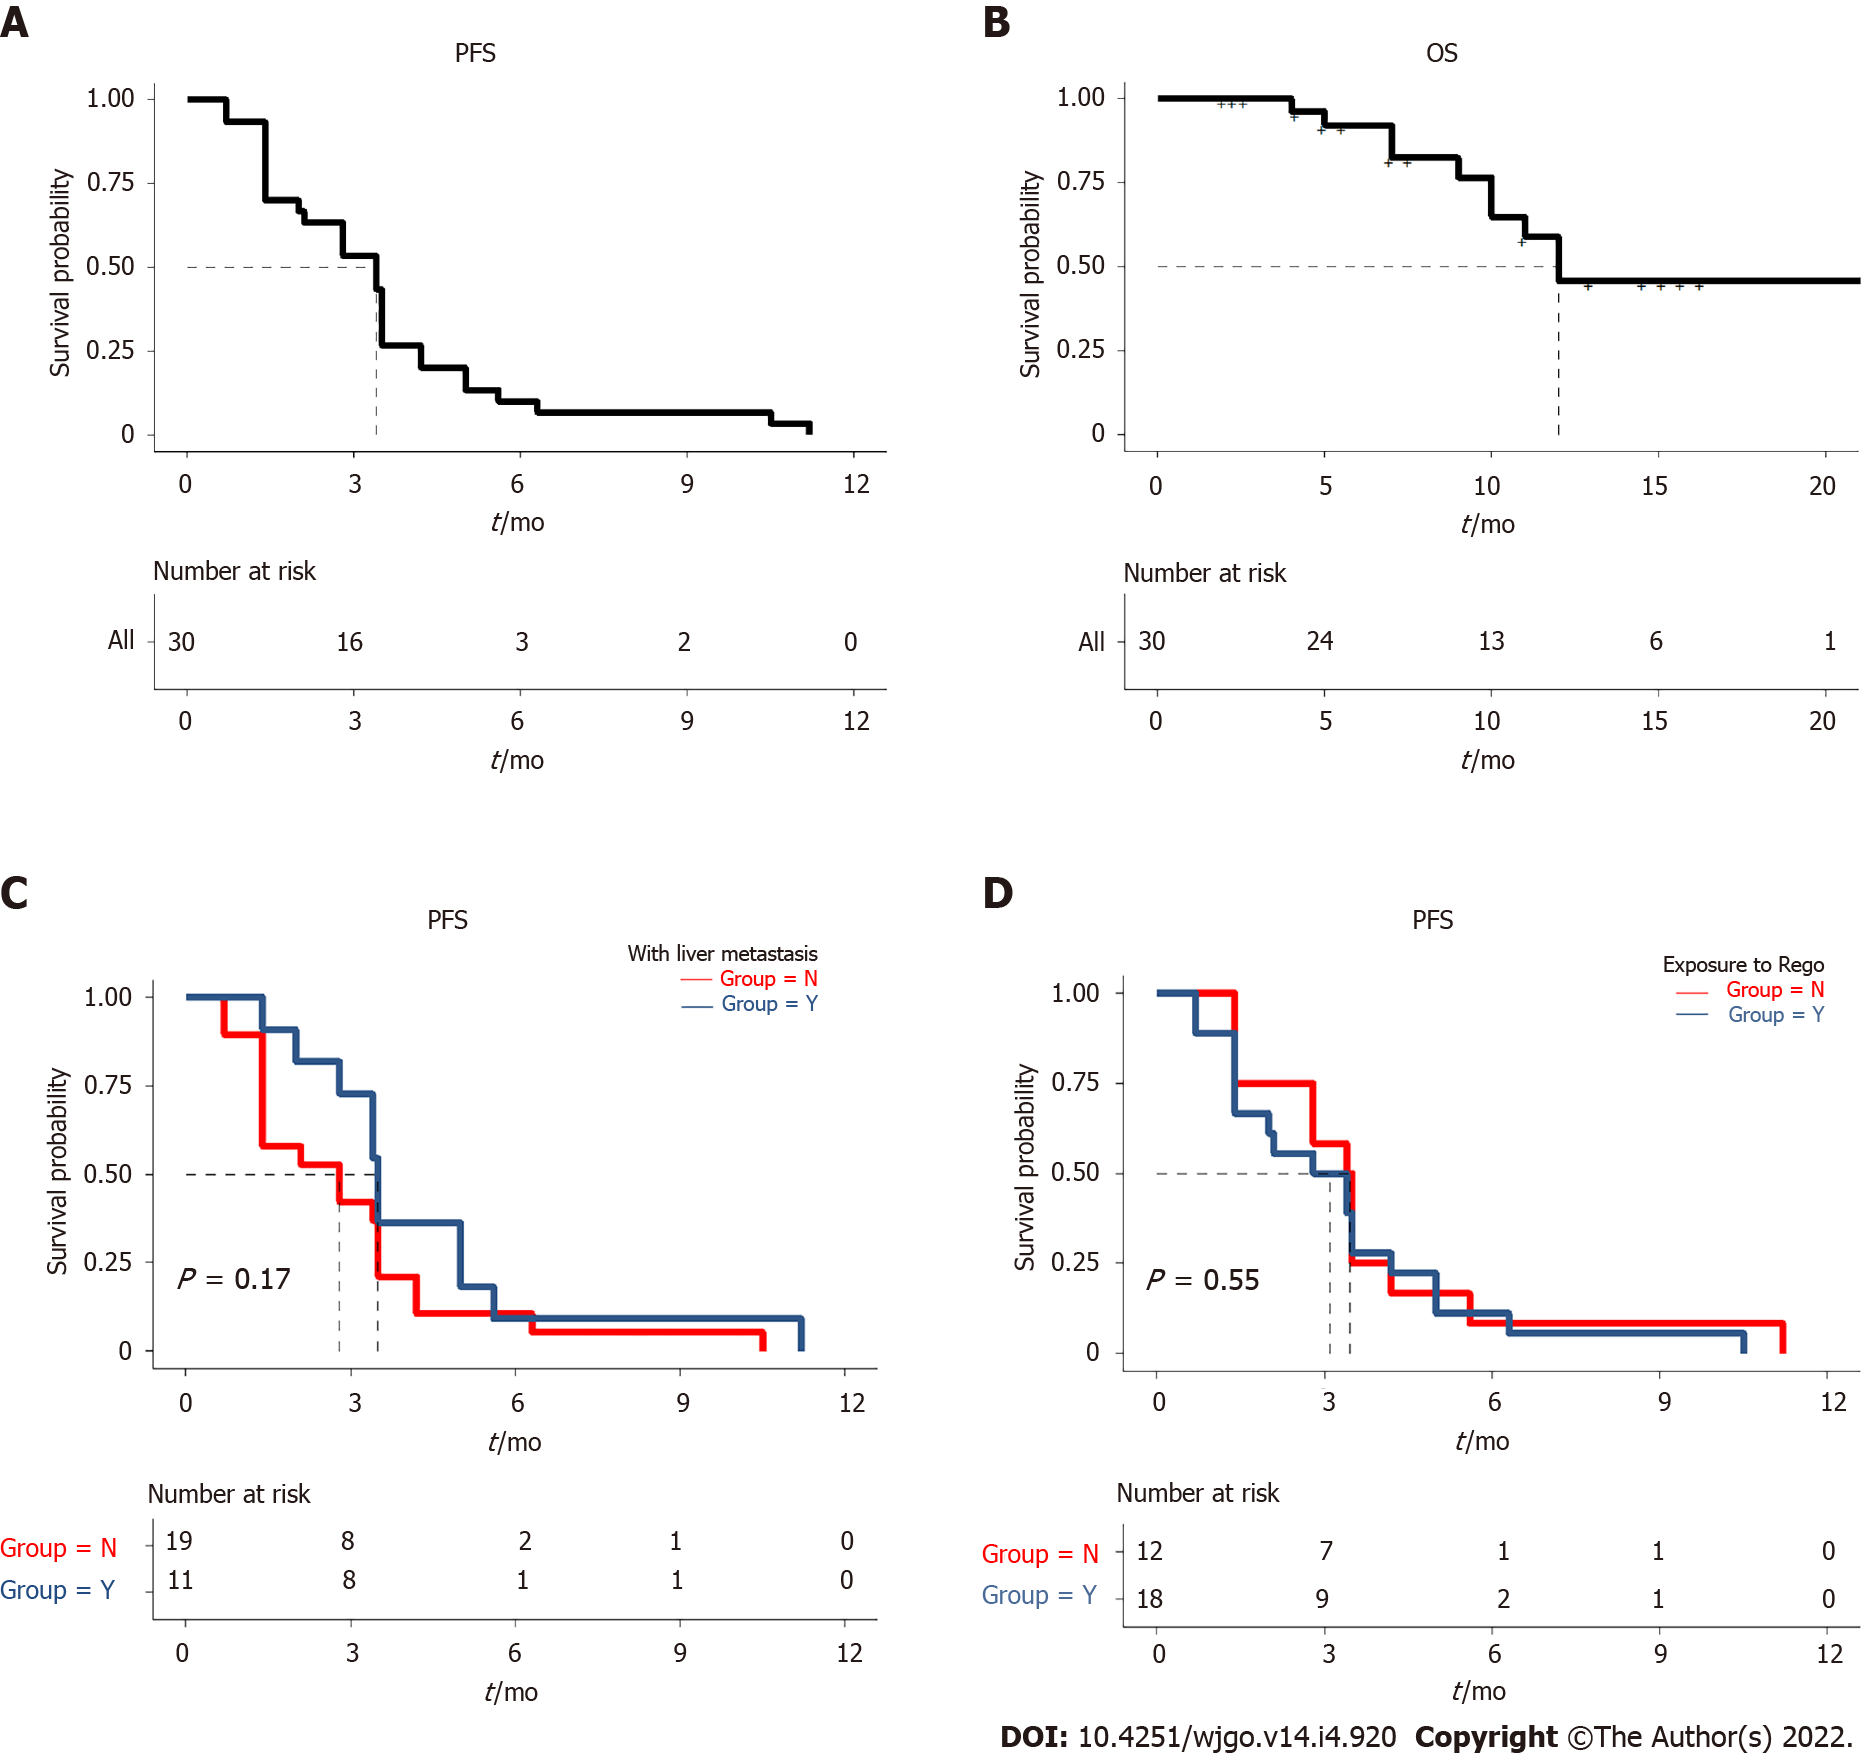
Figure 1 Kaplan-Meier survival curves.
A: Progression-free survival (PFS) of 30 patients; B: Overall survival of the whole cohort; C: PFS according to the patients with or without liver metastasis (P > 0.05); D: PFS according to previous exposure to regorafenib or not (P > 0.05). PFS: Progression-free survival; OS: Overall survival.
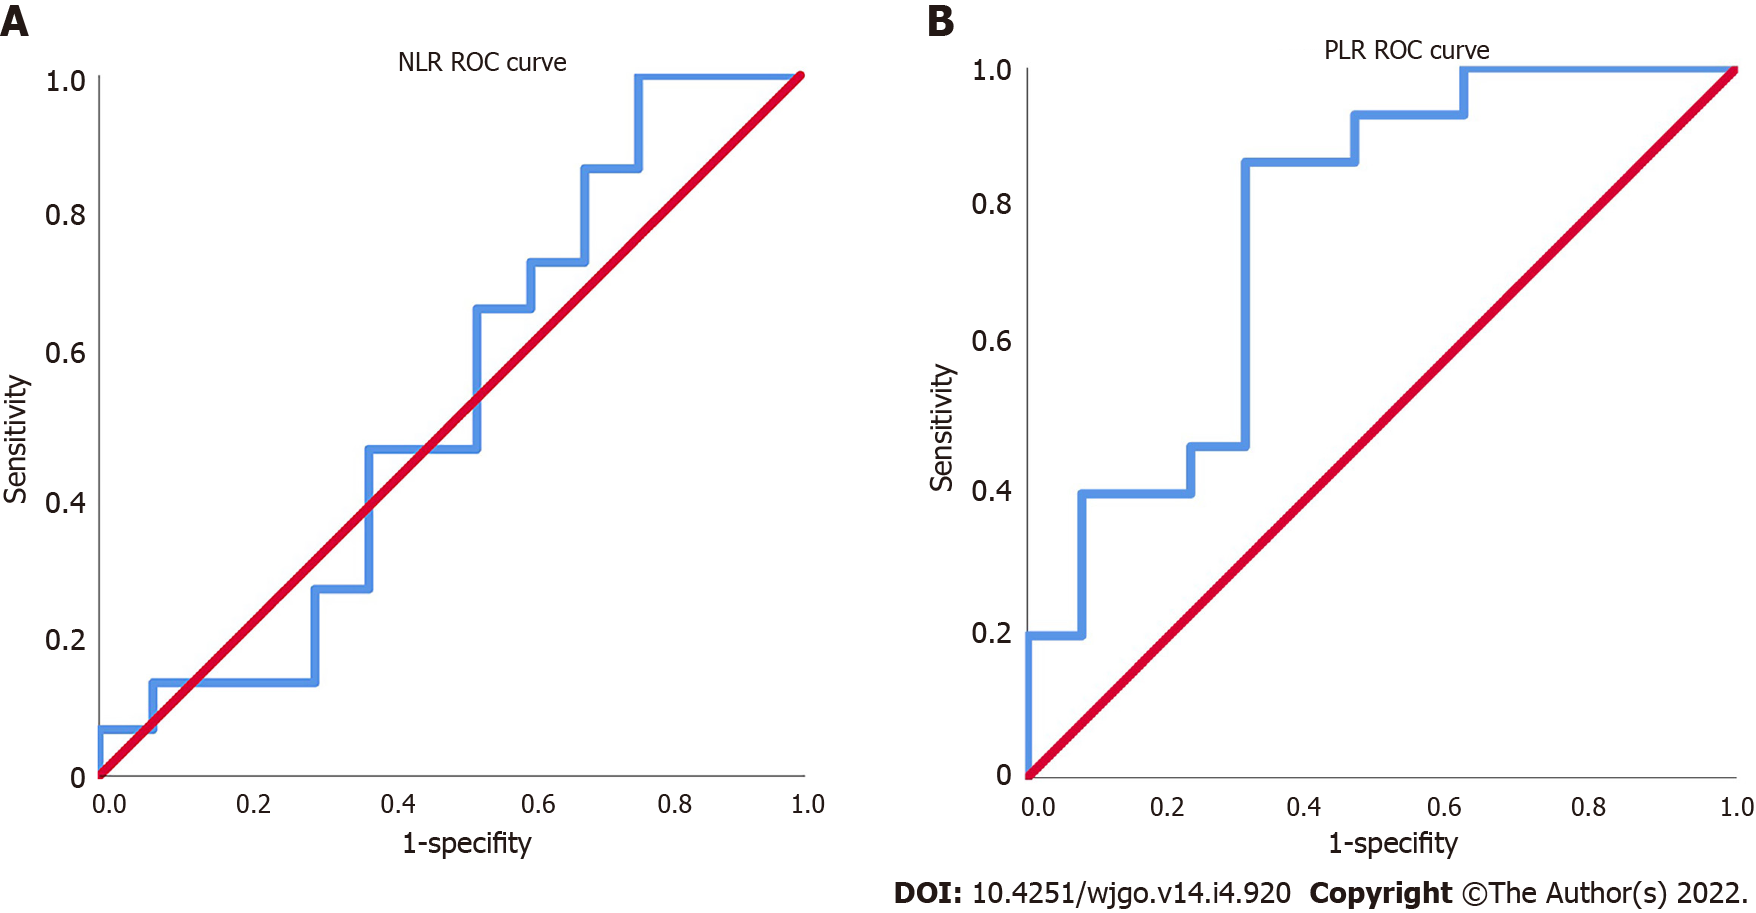
Figure 2 Receiver operating characteristics curves.
A: The receiver operating characteristics curves of neutrophil-to-lymphocyte ratio; B: The receiver operating characteristics curves of platelet-to-lymphocyte ratio. NLR: Platelet -to-lymphocyte ratio; PLR: Neutrophil-to-lymphocyte ratio; ROC: Receiver operating characteristics.
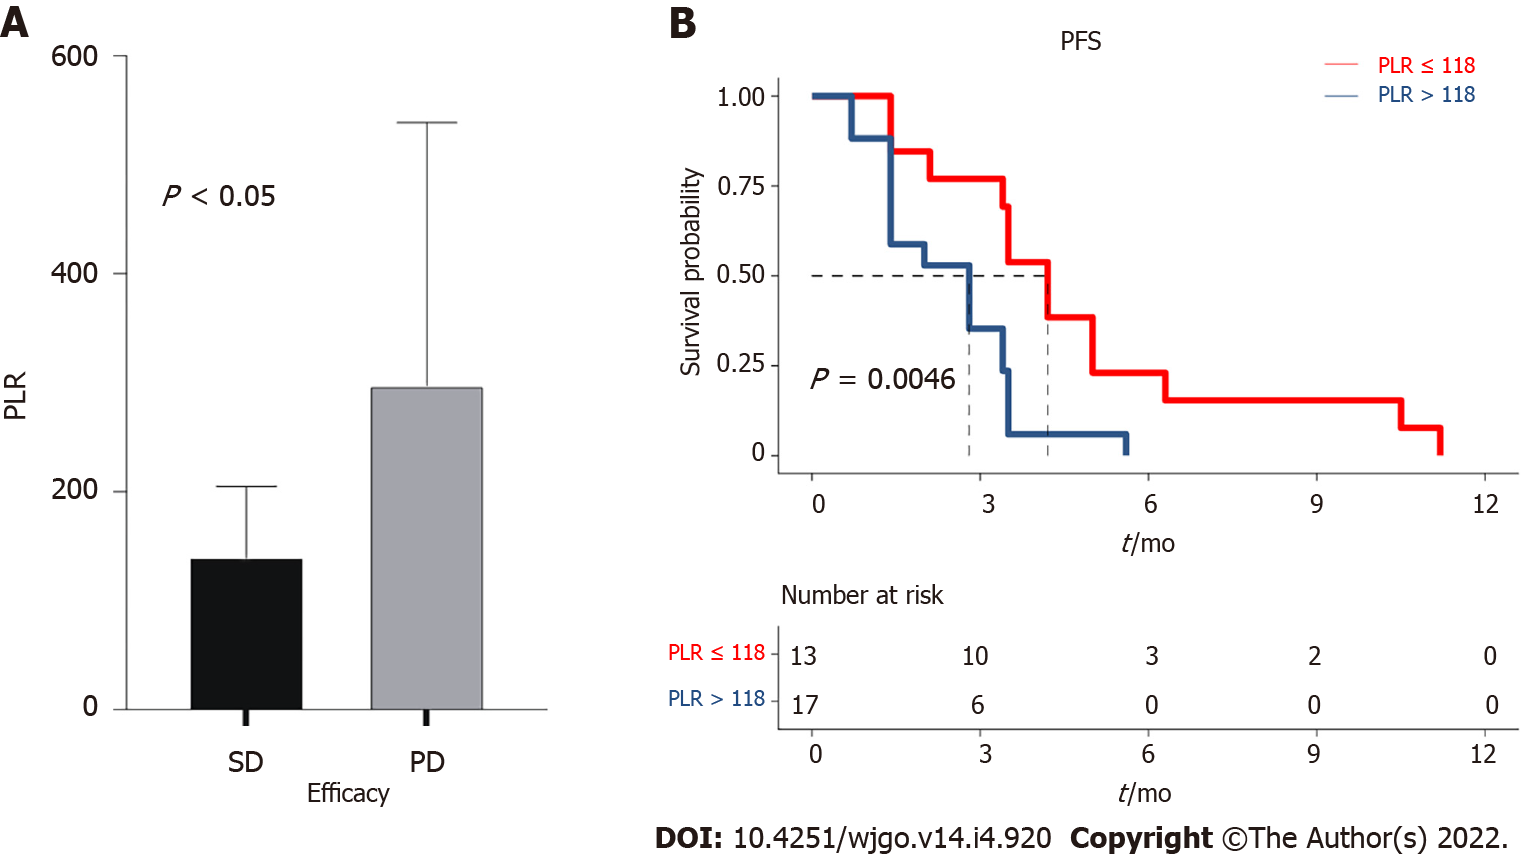
Figure 3 Relationship between platelet-to-lymphocyte ratio and treatment response.
A: Difference in platelet-to-lymphocyte ratio according to stable disease and progressive disease; B: Progression-free survival according to the platelet-to-lymphocyte ratio (P < 0.05). PLR: Platelet-to-lymphocyte ratio; PFS: Progression-free survival; SD: Stable disease; PD: Progressive disease.
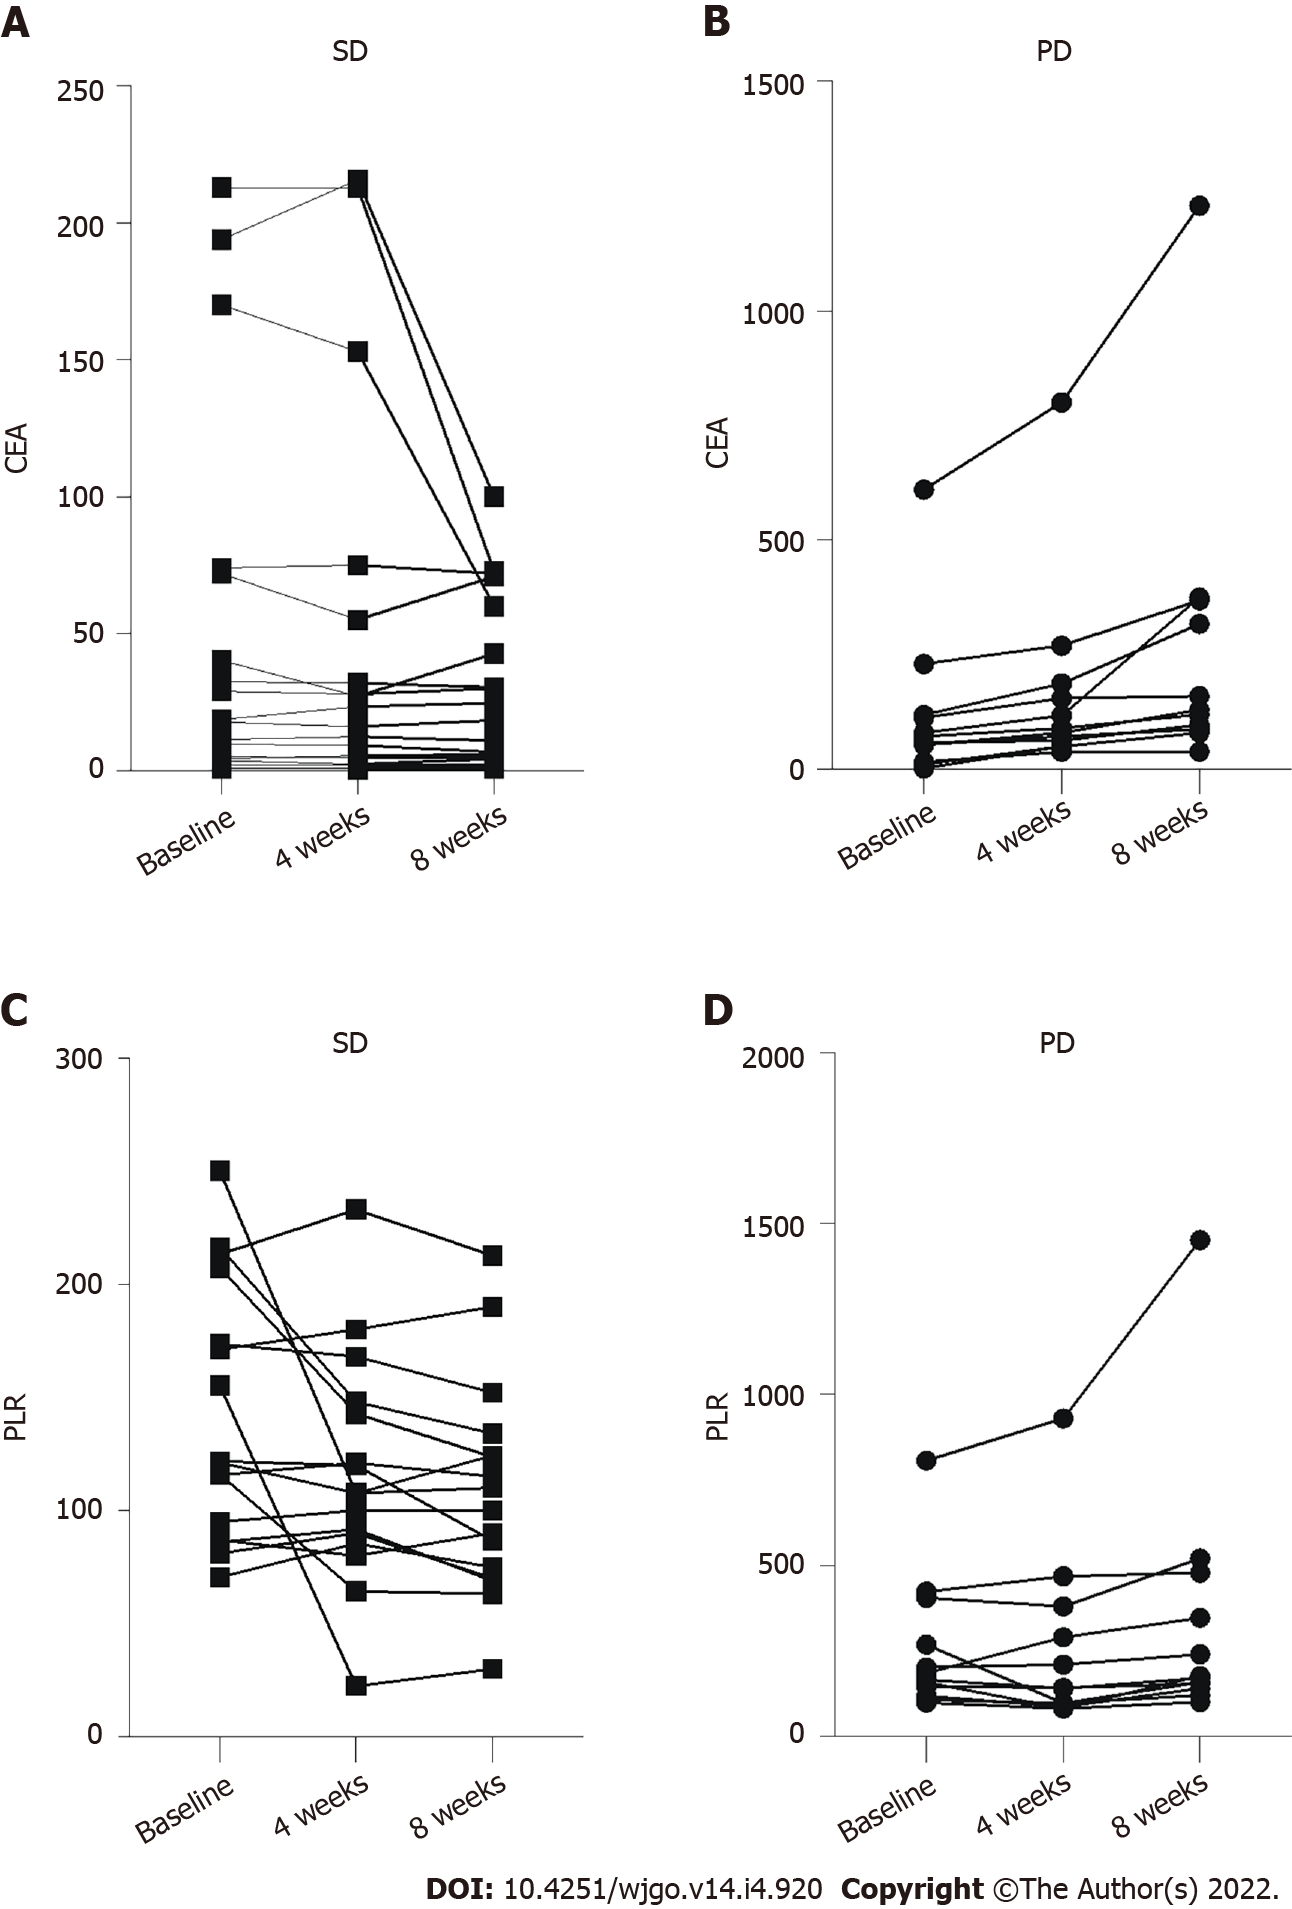
Figure 4 Dynamic changes in carcinoembryonic antigen (μg/mL) and platelet-to-lymphocyte ratio after one and two treatment cycles.
A: Carcinoembryonic antigen (μg/mL) in time in patients with stable disease; B: Carcinoembryonic antigen (μg/mL) in time in patients with progressive disease; C: Platelet-to-lymphocyte in time in patients with stable disease; D: Platelet-to-lymphocyte in time in patients with progressive disease. PLR: Platelet-to-lymphocyte ratio; SD: Stable disease; PD: Progressive disease.
- Citation: Xu YJ, Zhang P, Hu JL, Liang H, Zhu YY, Cui Y, Niu P, Xu M, Liu MY. Regorafenib combined with programmed cell death-1 inhibitor against refractory colorectal cancer and the platelet-to-lymphocyte ratio’s prediction on effectiveness. World J Gastrointest Oncol 2022; 14(4): 920-934
- URL: https://www.wjgnet.com/1948-5204/full/v14/i4/920.htm
- DOI: https://dx.doi.org/10.4251/wjgo.v14.i4.920


