Copyright
©The Author(s) 2022.
World J Gastrointest Oncol. Apr 15, 2022; 14(4): 897-919
Published online Apr 15, 2022. doi: 10.4251/wjgo.v14.i4.897
Published online Apr 15, 2022. doi: 10.4251/wjgo.v14.i4.897
Figure 1 Representative hematoxylin and eosin staining patterns of samples of each tumor infiltrative pattern type.
A: The expansive growth type; B: The intermediate type; C: The infiltrative growth type. INFa: The expansive growth type; INFb: The intermediate type; INFc: The infiltrative growth type.
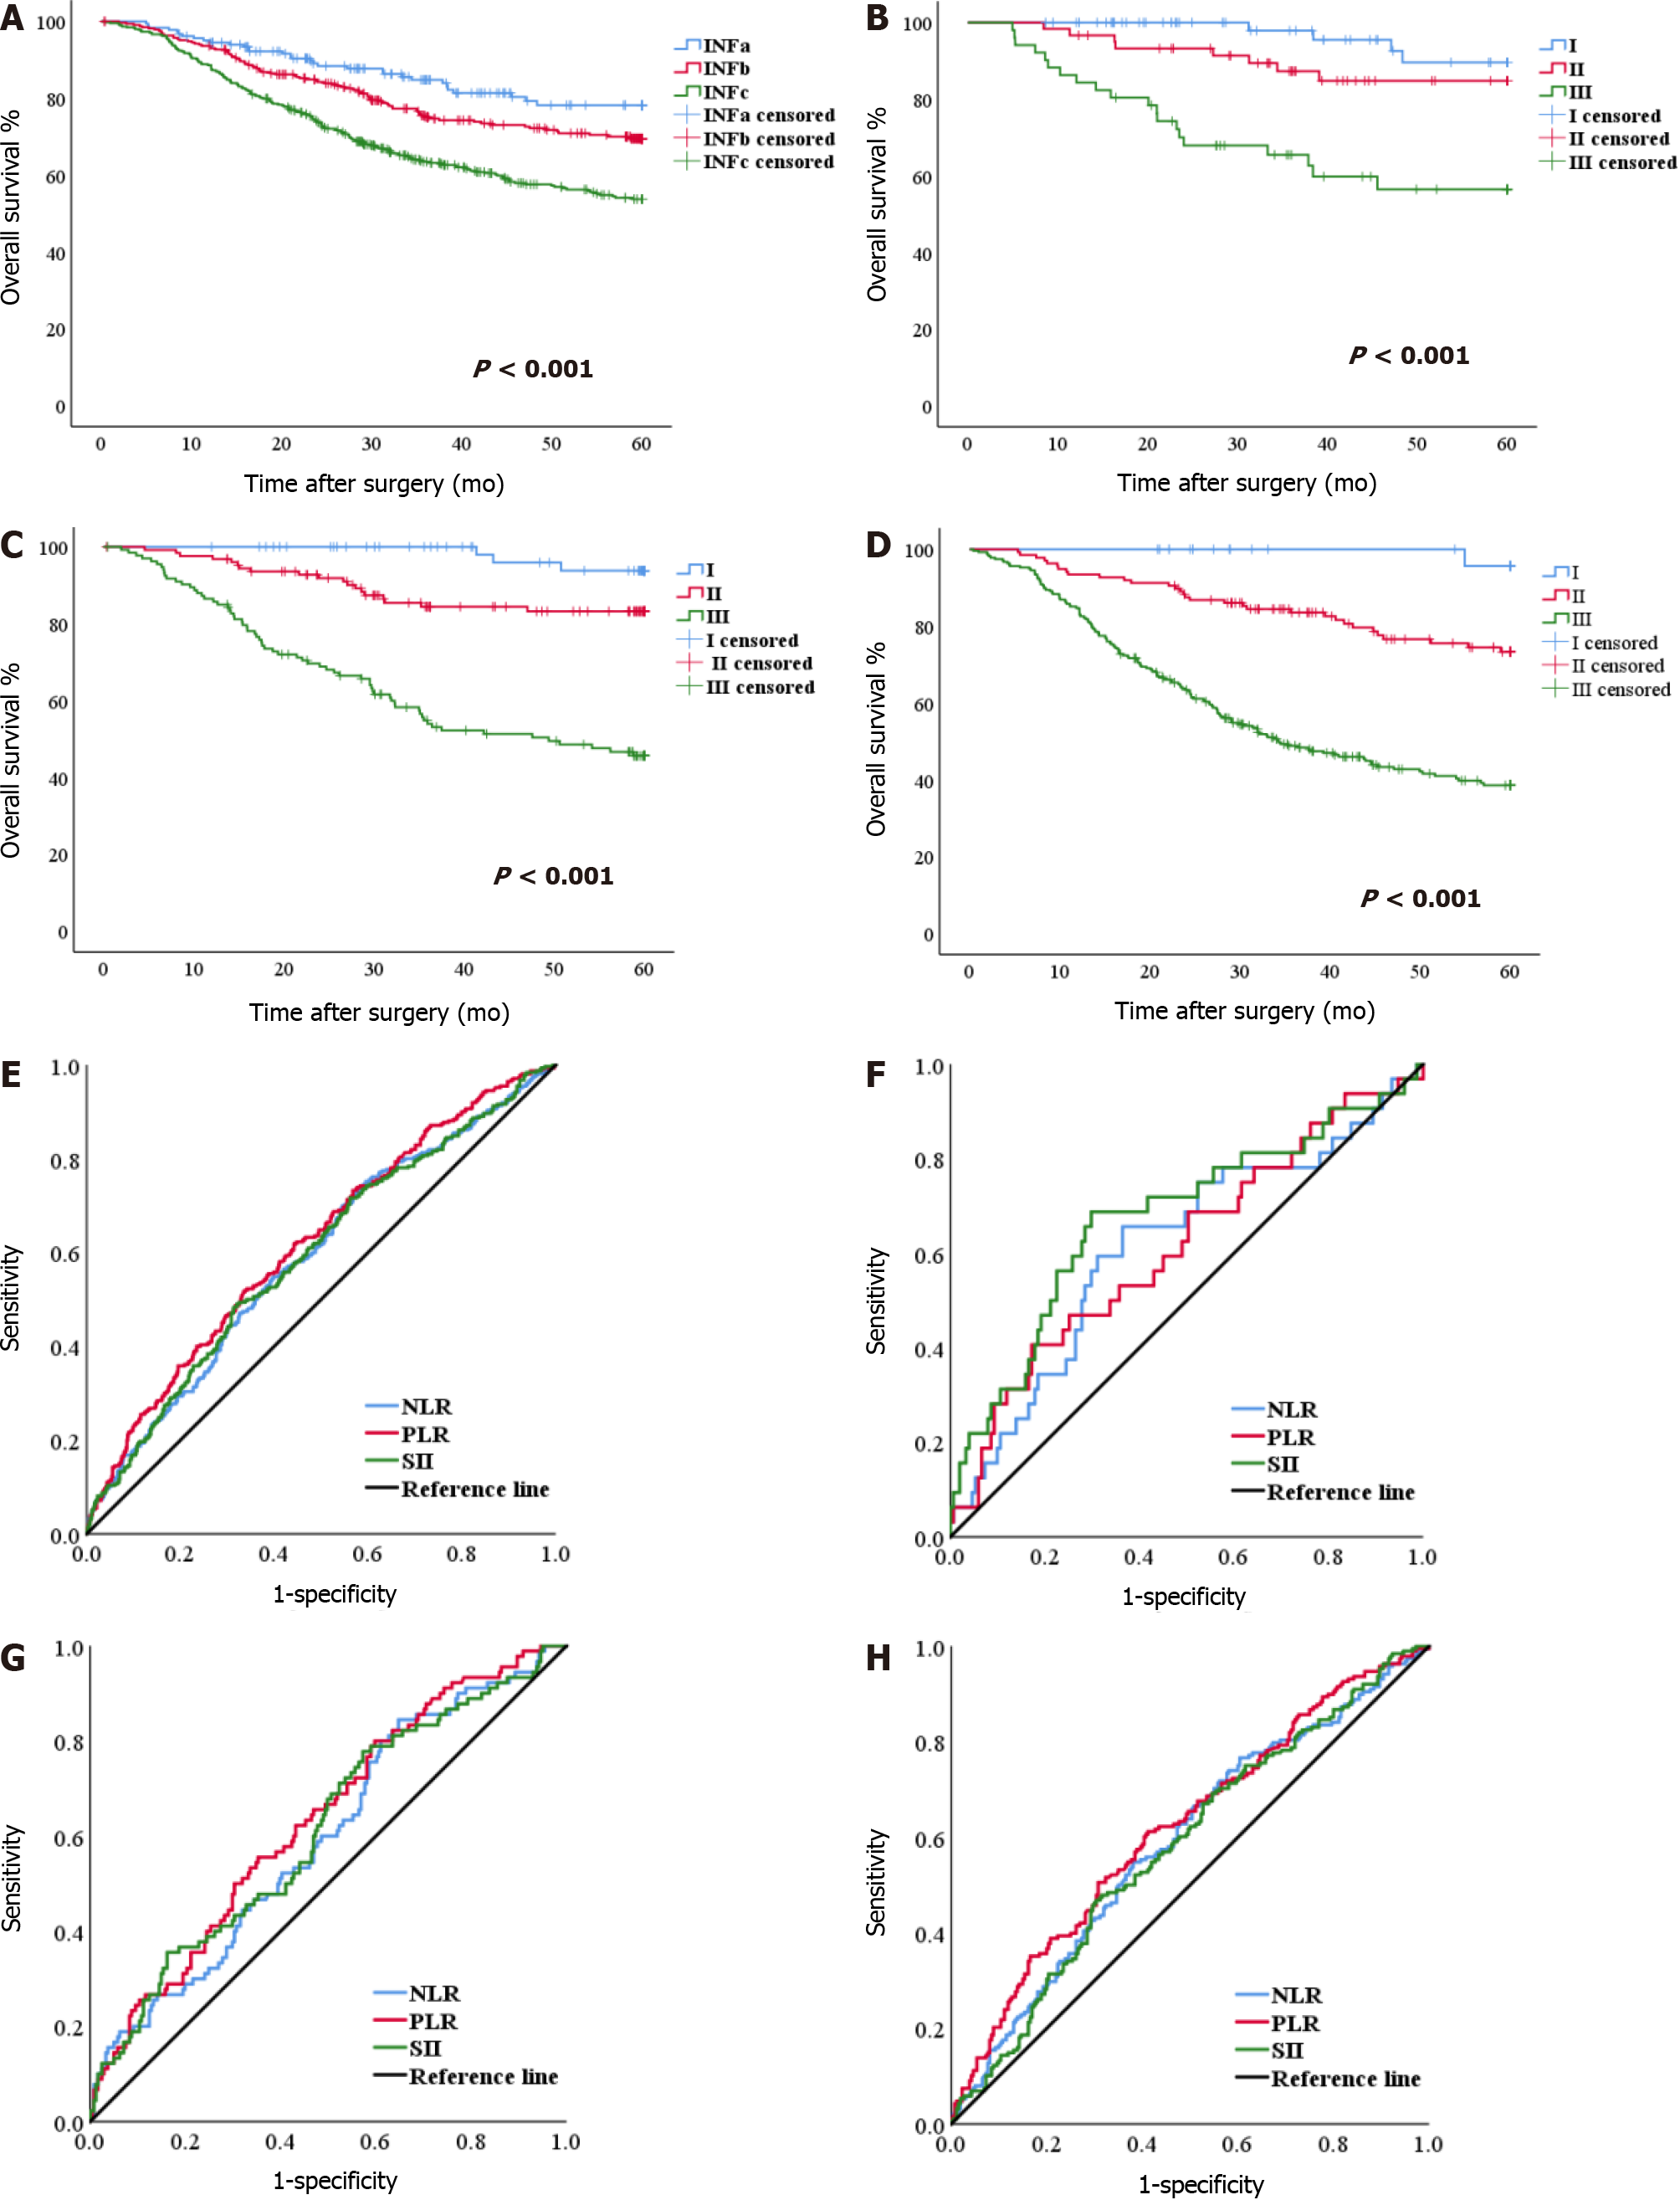
Figure 2 Survival curve analyses for patients and receiver operating characteristic curves of inflammatory indices.
A: Survival curves of all patients; B-D: Survival curves of patients with the expansive growth type (INFa), the intermediate type (INFb), and the infiltrative growth type (INFc); E-H: Receiver operating characteristic curve of neutrophil-lymphocyte ratio, platelet-lymphocyte ratio, and systemic immune-inflammation index in all patients, INFa group, INFb group, and INFc group. INFa: The expansive growth type; INFb: The intermediate type; INFc: The infiltrative growth type; ROC: Receiver operating characteristic; NLR: Neutrophil-lymphocyte ratio; PLR: Platelet-lymphocyte ratio; SII: Systemic immune-inflammation index.
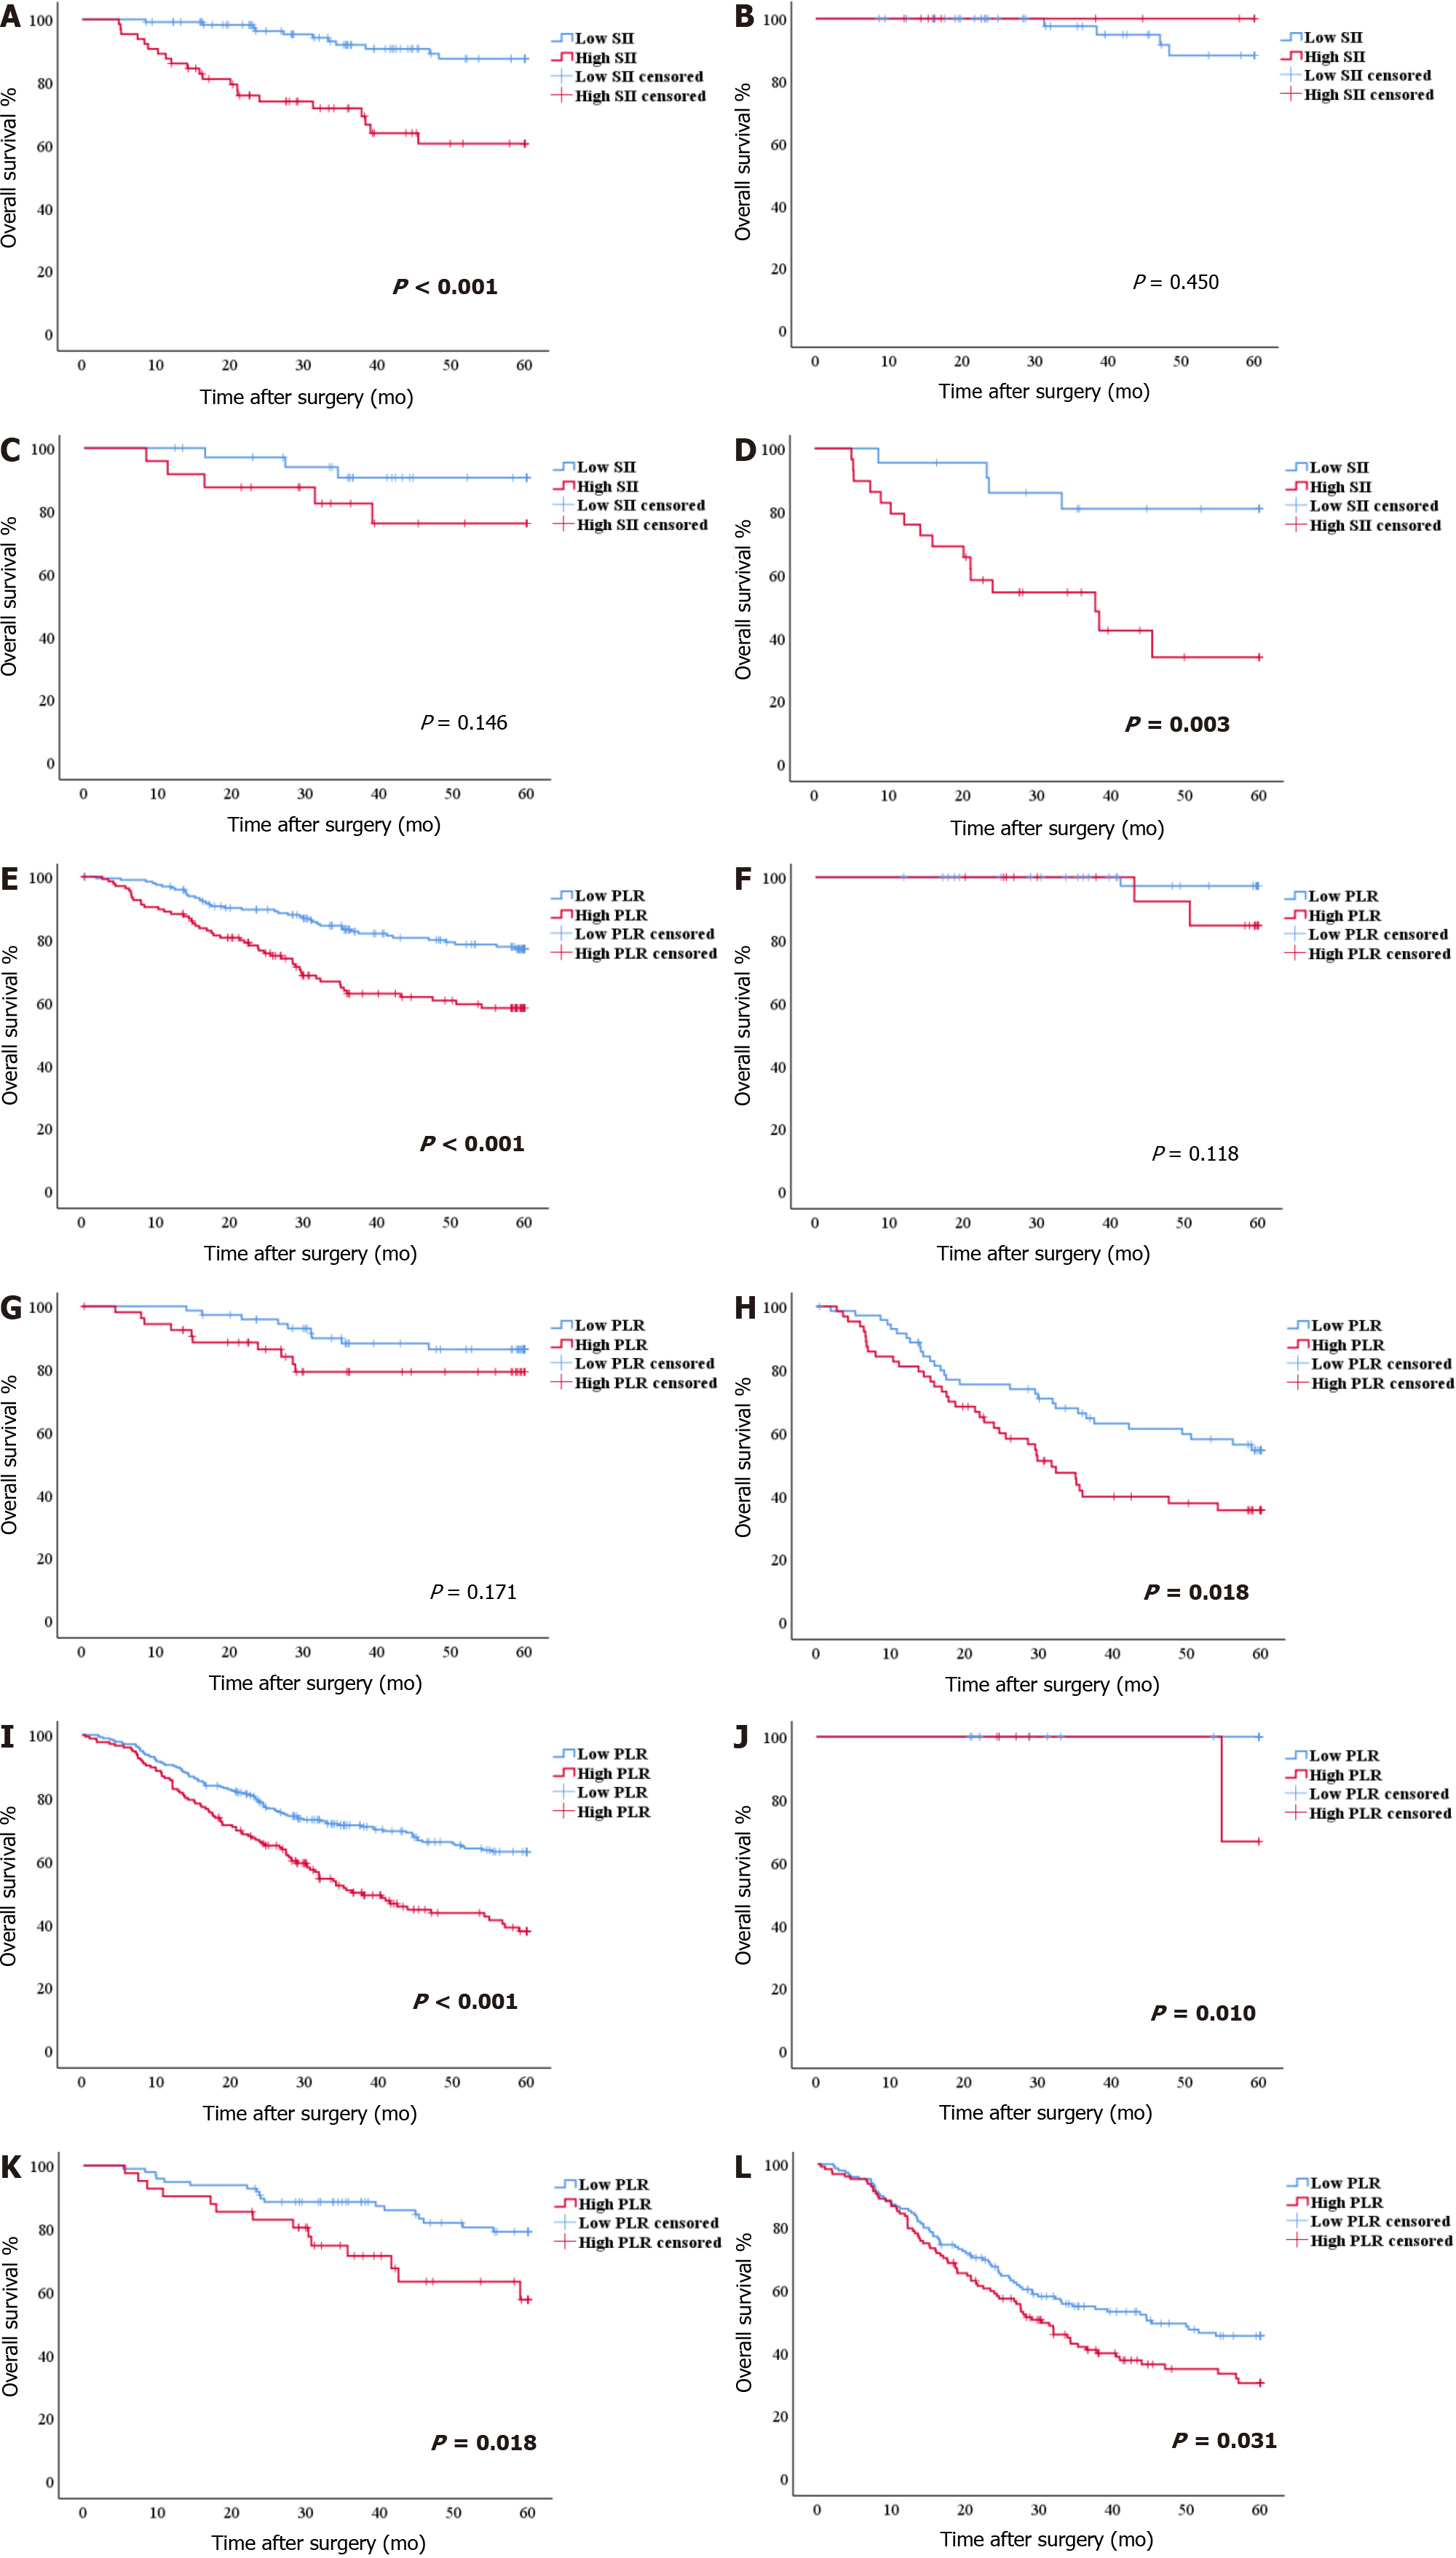
Figure 3 Survival curve analyses based on the systemic immune-inflammation index and platelet-lymphocyte ratio.
A-D: Survival curves of patients with the expansive growth type based on the systemic immune-inflammation index in all stages, stage Ⅰ, stage Ⅱ, and stage Ⅲ; E–H: Survival curves of patients with the intermediate type based on the platelet-lymphocyte ratio (PLR) in all stages, stage Ⅰ, stage Ⅱ, and stage Ⅲ; I–L: Survival curves of patients with the infiltrative growth type based on the PLR in all stages, stage Ⅰ, stage Ⅱ, and stage Ⅲ. INFa: The expansive growth type; INFb: The intermediate type; INFc: The infiltrative growth type; PLR: Platelet-lymphocyte ratio; SII: Systemic immune-inflammation index.
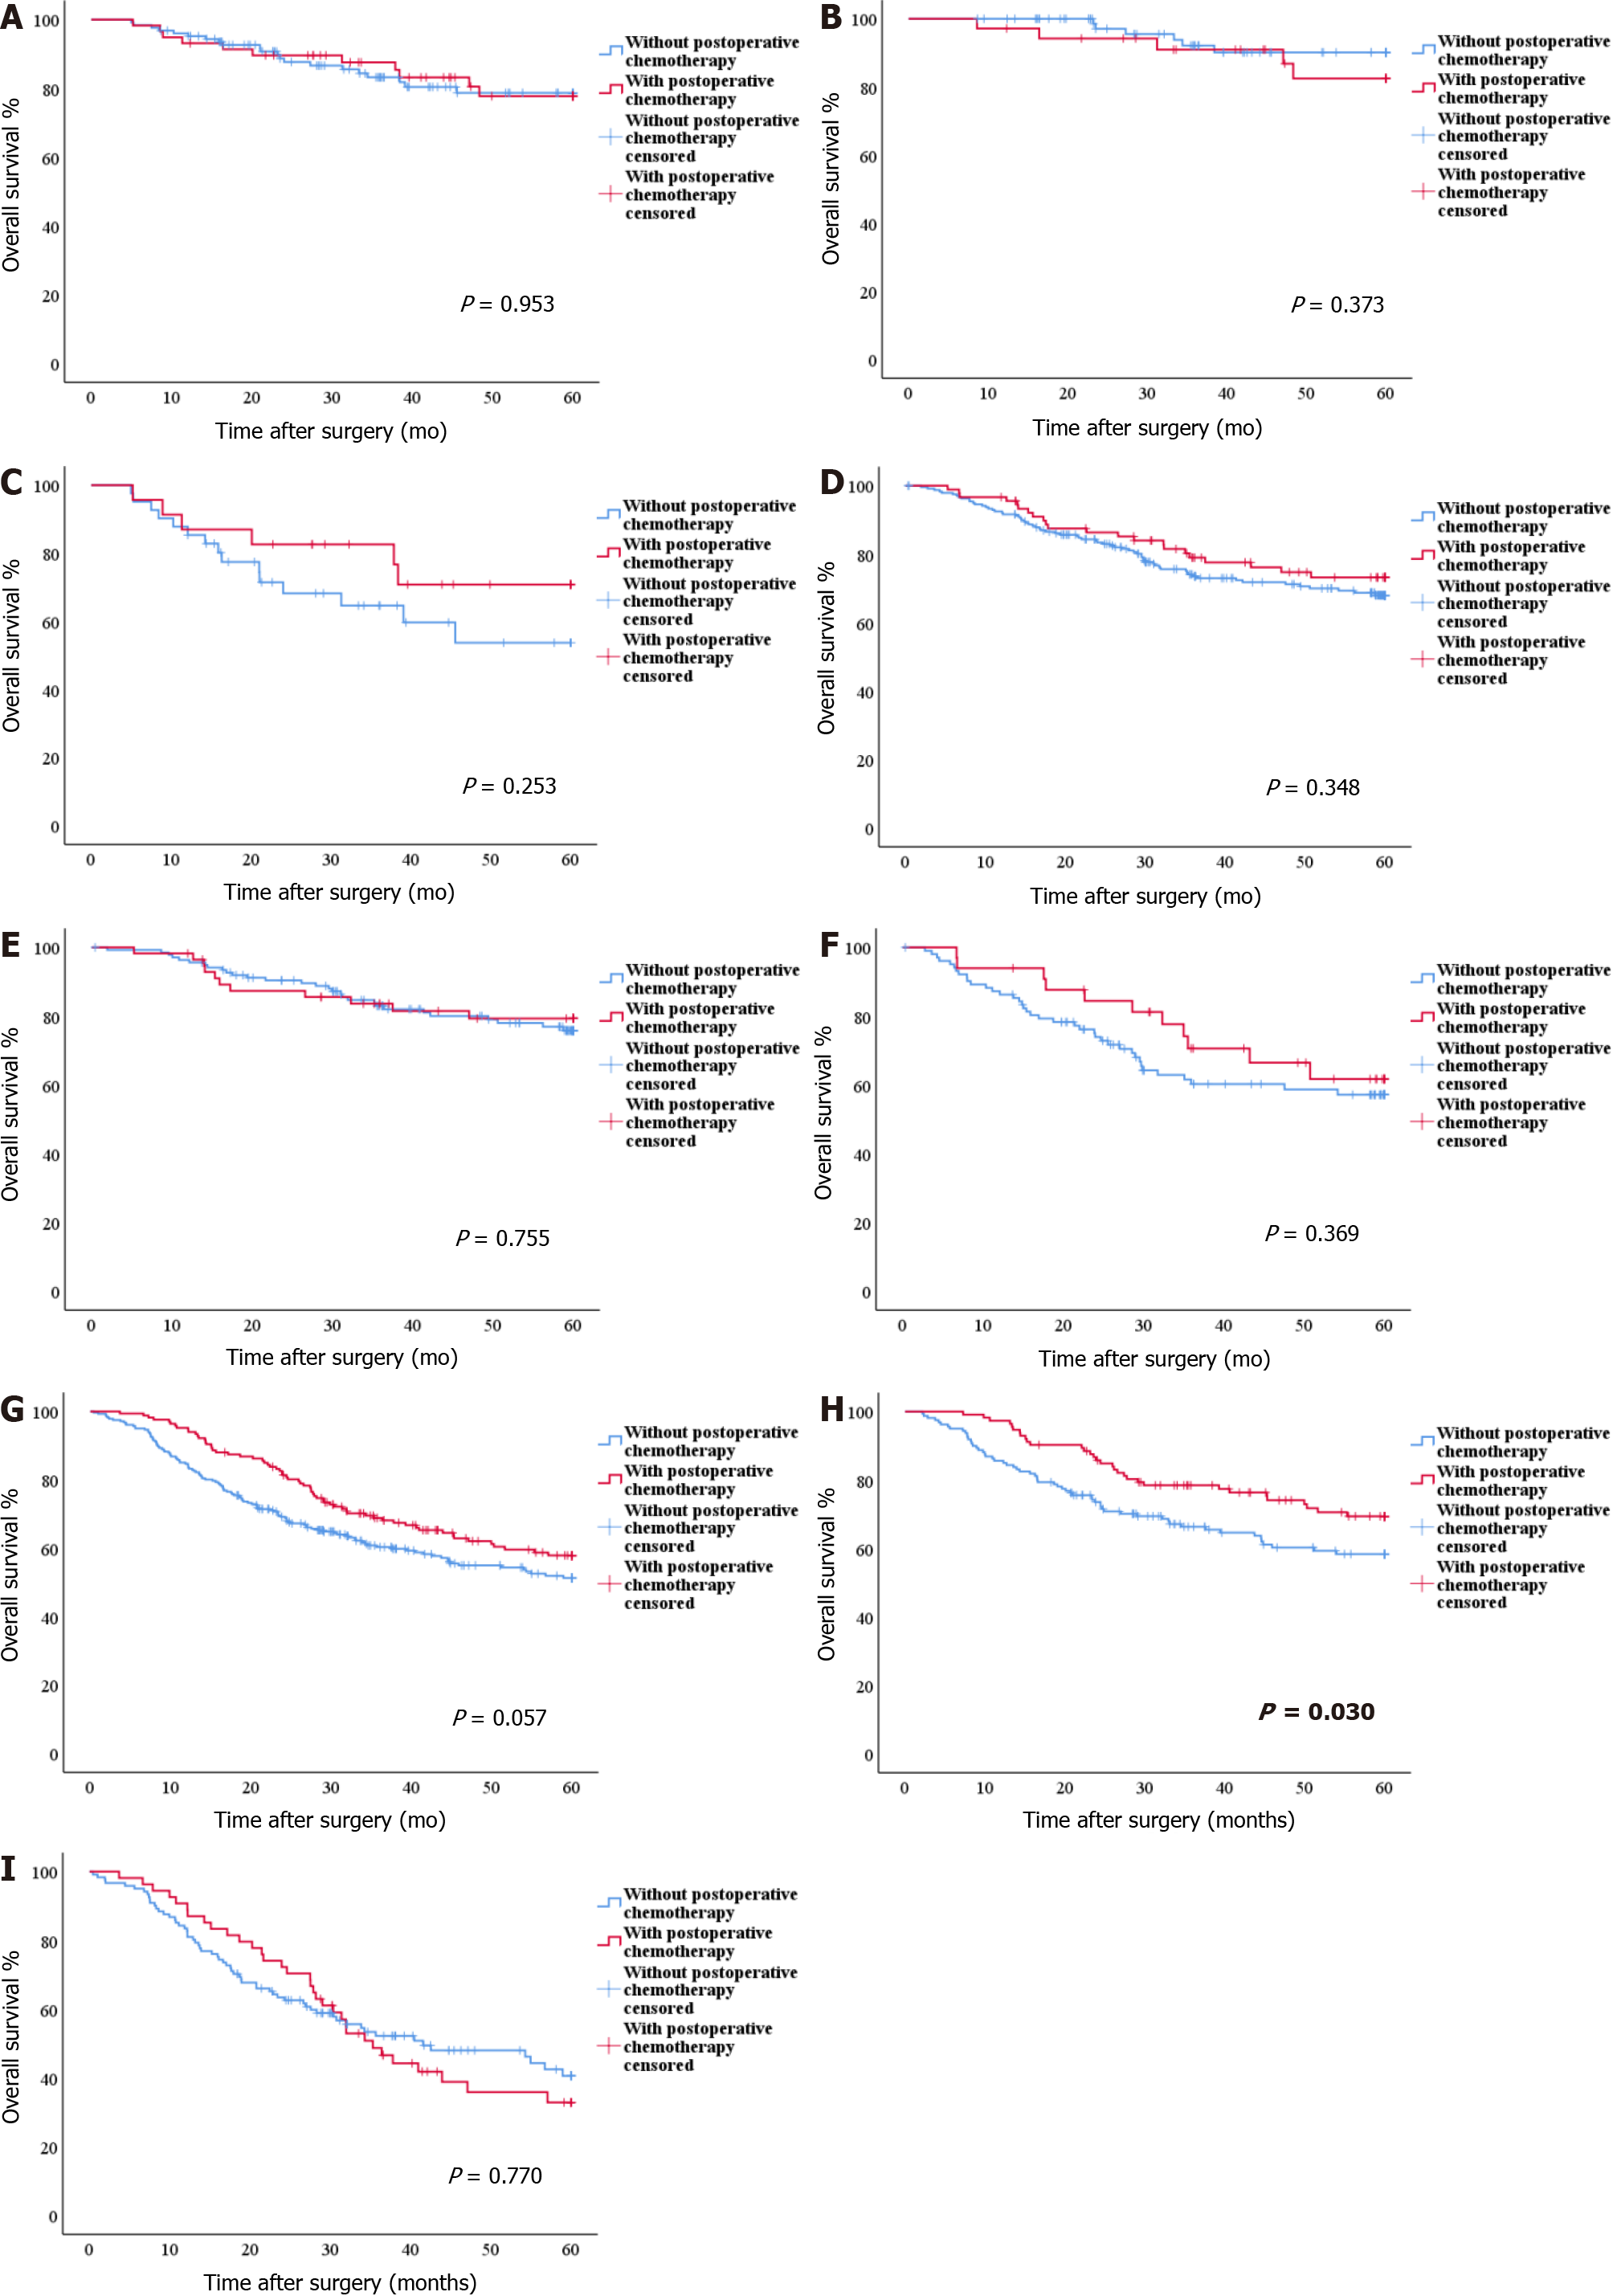
Figure 4 Survival curve analyses based on postoperative chemotherapy.
A-C: Survival curves with and without postoperative chemotherapy in all the expansive growth type (INFa) gastric cancer (GC) patients, INFa GC patients with systemic immune-inflammation index (SII) ≤ 523.01, and INFa GC patients with SII > 523.01; D-F: Survival curves with and without postoperative chemotherapy in all the intermediate type (INFb), GC patients, INFb GC patients with platelet-lymphocyte ratio (PLR) ≤ 134.02, and INFb GC patients with PLR > 134.02; G–I: Survival curves with and without postoperative chemotherapy in all the infiltrative growth type (INFc) GC patients, INFc GC patients with PLR ≤ 134.02, and INFc GC patients with PLR > 134.02. INFa: The expansive growth type; INFb: The intermediate type; INFc: The infiltrative growth type; PLR: Platelet-lymphocyte ratio; SII: Systemic immune-inflammation index.
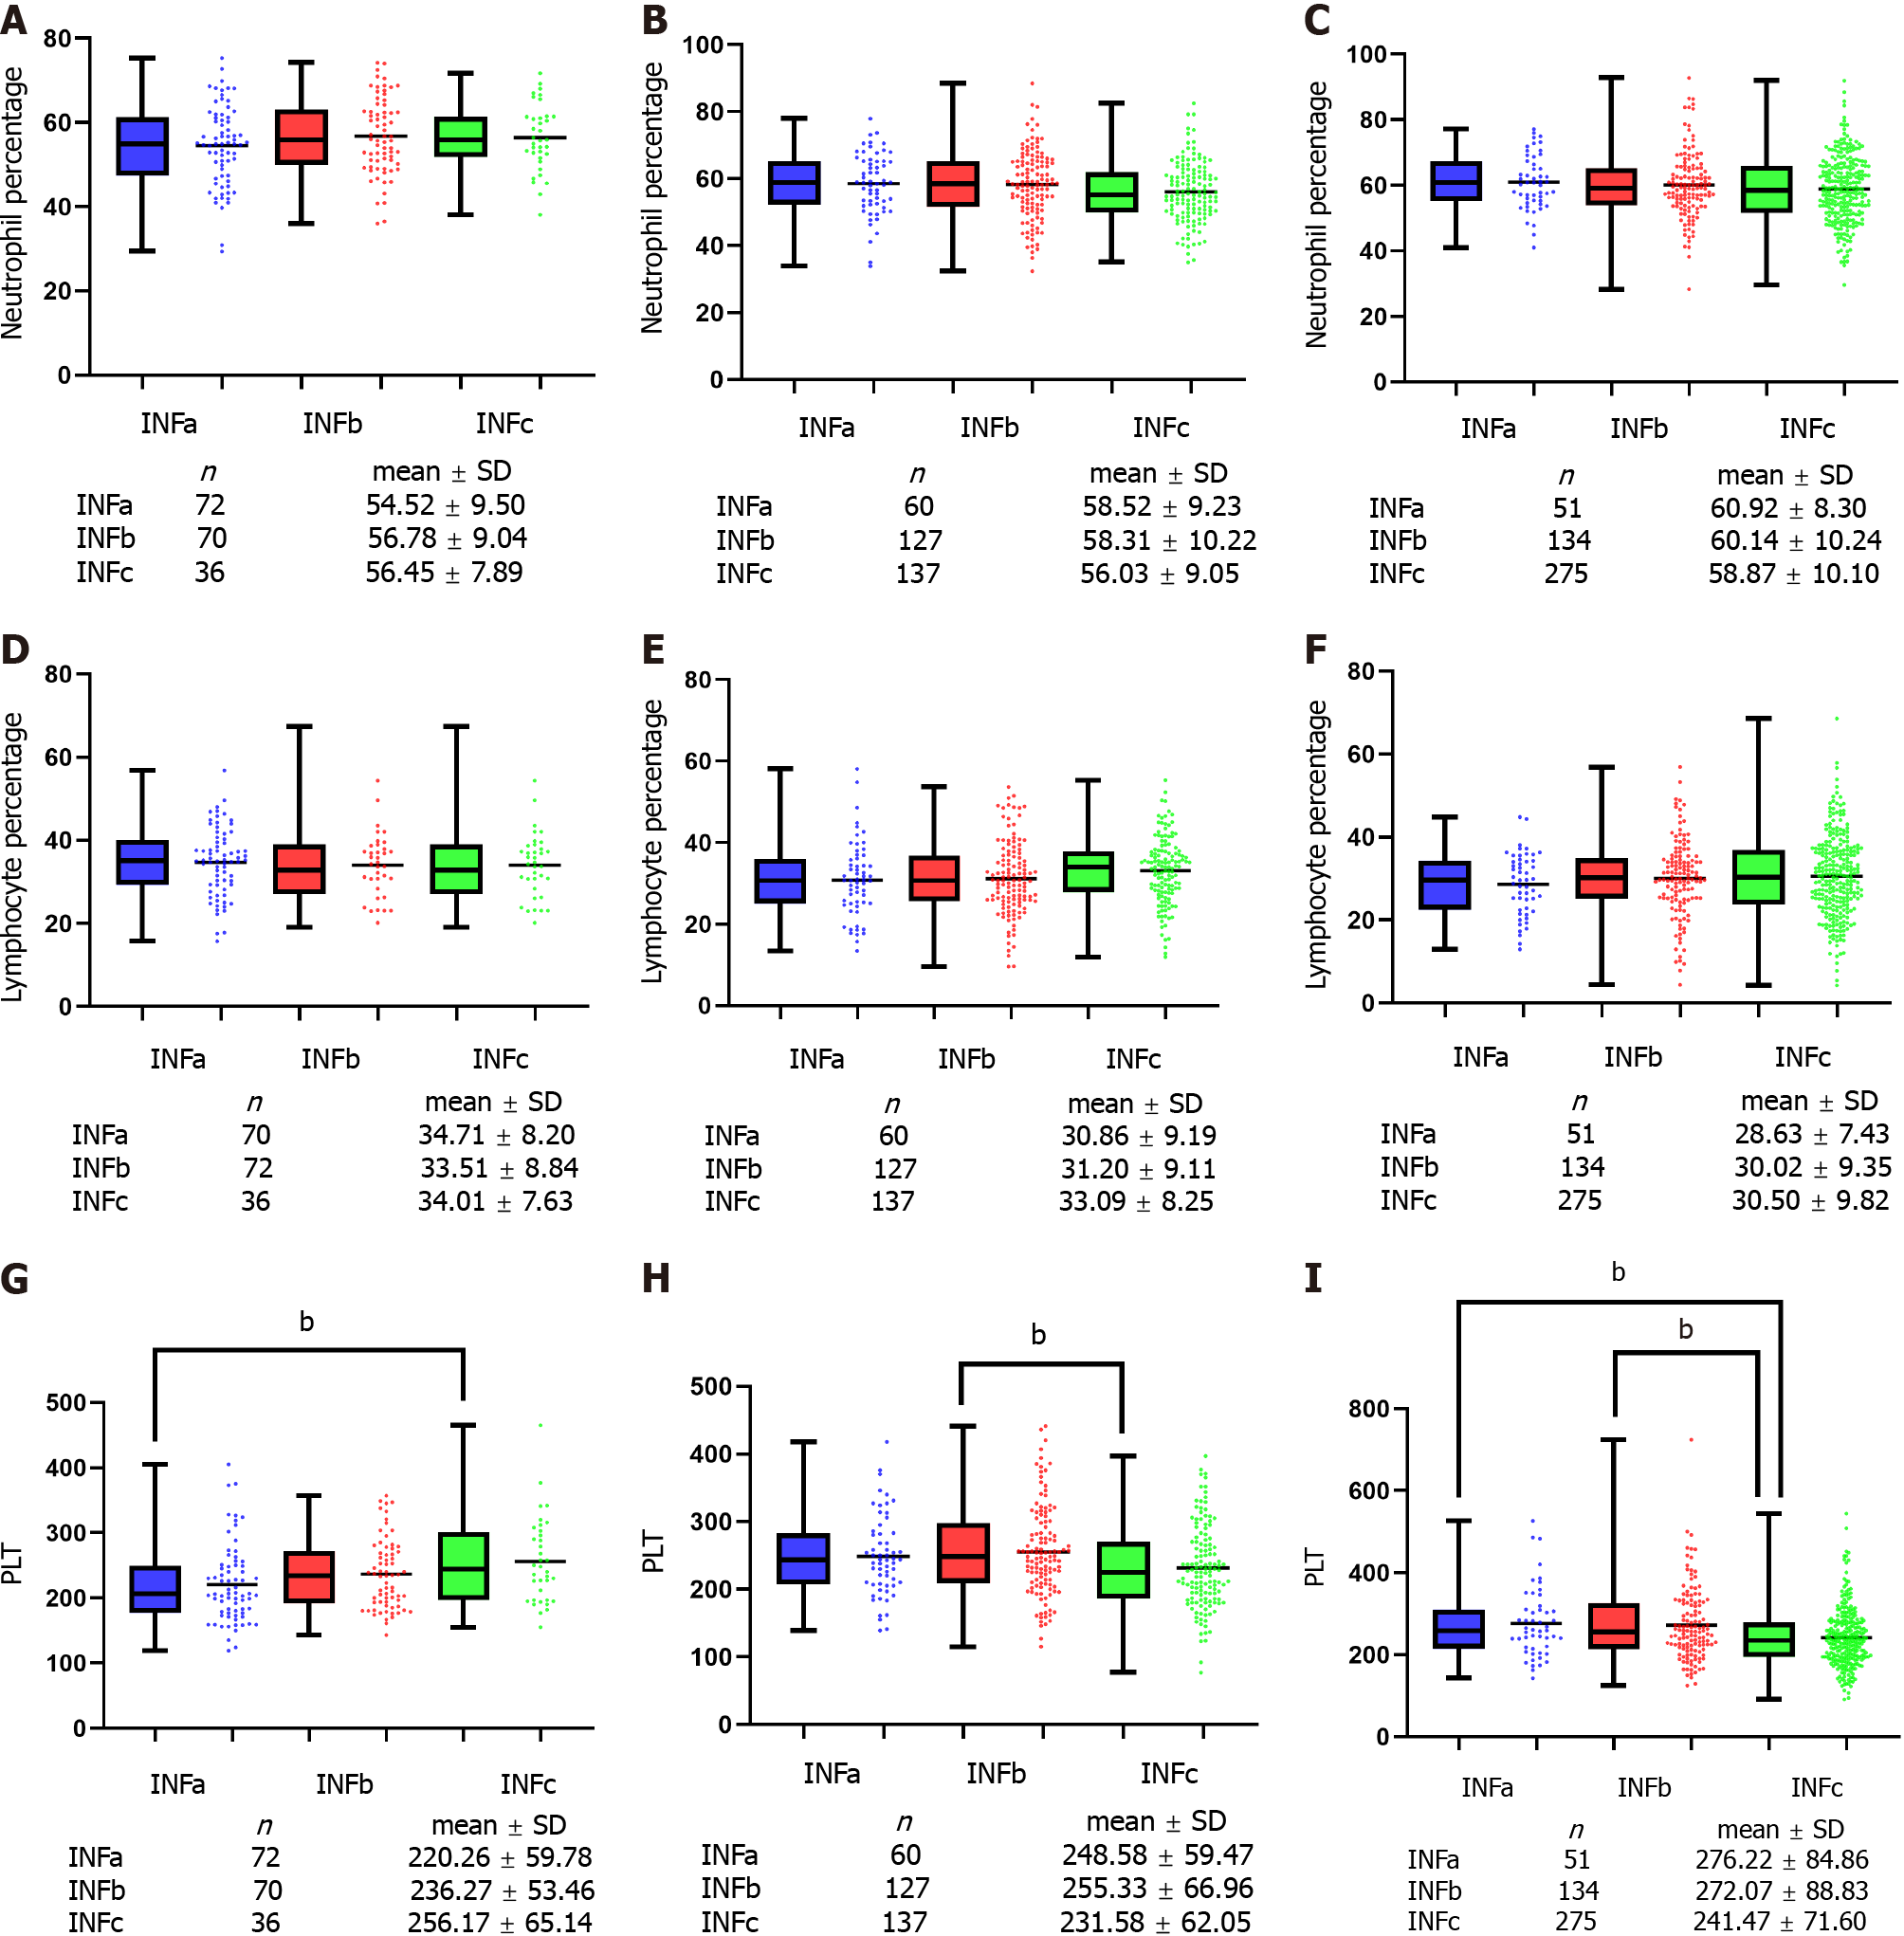
Figure 5 The relationship between peripheral circulating immune cells and different tumor infiltrative pattern types.
A-C: Boxplot combined with scatterplot of neutrophil percentage based on tumor infiltrative pattern (INF) types in stage Ⅰ, stage Ⅱ, and stage Ⅲ; D-F: Boxplot combined with scatterplot of lymphocyte percentage based on INF types in stage Ⅰ, stage Ⅱ, and stage Ⅲ; G–I: Boxplot combined with scatterplot of platelet count based on INF types in stage Ⅰ, stage Ⅱ, and stage Ⅲ. INFa: The expansive growth type; INFb: The intermediate type; INFc: The infiltrative growth type; PLT: Platelet.
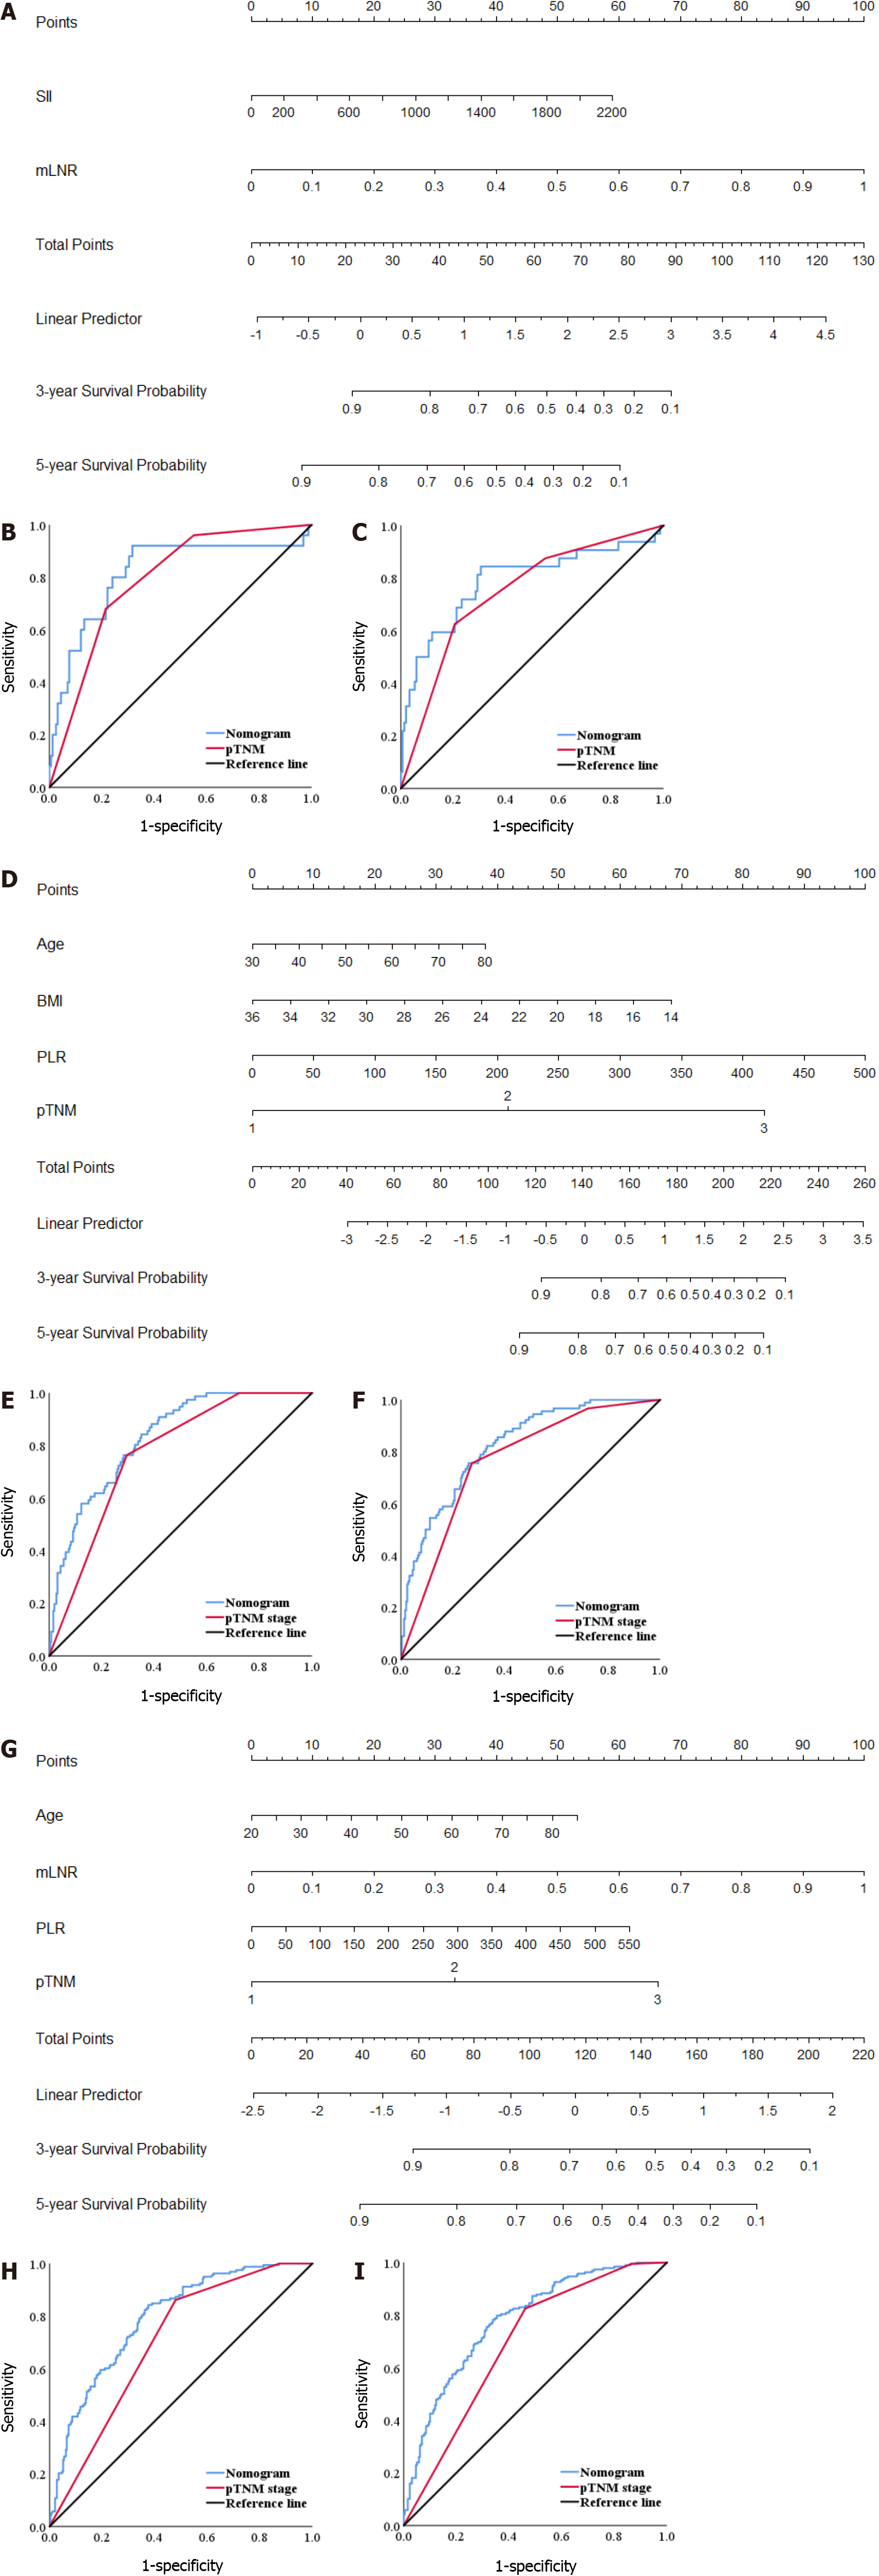
Figure 6 Nomogram models predicting the survival of patients with different tumor infiltrative pattern types.
A, D and G: Nomogram models predicting the 3-year and 5-year survival of patients with the expansive growth type (INFa), the intermediate type (INFb), and the infiltrative growth type (INFc) gastric cancer (GC); B and C: Receiver operating characteristic (ROC) of the nomogram model and postsurgical tumor node metastasis (pTNM) stage predicting the 3-year and 5-year survival of patients with INFa GC; E and F: ROC of the nomogram model and pTNM stage predicting the 3-year and 5-year survival of patients with INFb GC; H and I: ROC curve of the nomogram model and pTNM stage predicting the 3-year and 5-year survival of patients with INFc GC. INFa: The expansive growth type; INFb: The intermediate type; INFc: The infiltrative growth type; ROC: Receiver operating characteristic curve; mLNR: Metastatic lymph node ratio; BMI: Body mass index; PLR: Platelet-lymphocyte ratio; SII: Systemic immune-inflammation index.
- Citation: Wang YF, Yin X, Fang TY, Wang YM, Zhang L, Zhang XH, Zhang DX, Zhang Y, Wang XB, Wang H, Xue YW. Prognostic significance of serum inflammation indices for different tumor infiltrative pattern types of gastric cancer. World J Gastrointest Oncol 2022; 14(4): 897-919
- URL: https://www.wjgnet.com/1948-5204/full/v14/i4/897.htm
- DOI: https://dx.doi.org/10.4251/wjgo.v14.i4.897


