Copyright
©The Author(s) 2021.
World J Gastrointest Oncol. Aug 15, 2021; 13(8): 943-958
Published online Aug 15, 2021. doi: 10.4251/wjgo.v13.i8.943
Published online Aug 15, 2021. doi: 10.4251/wjgo.v13.i8.943
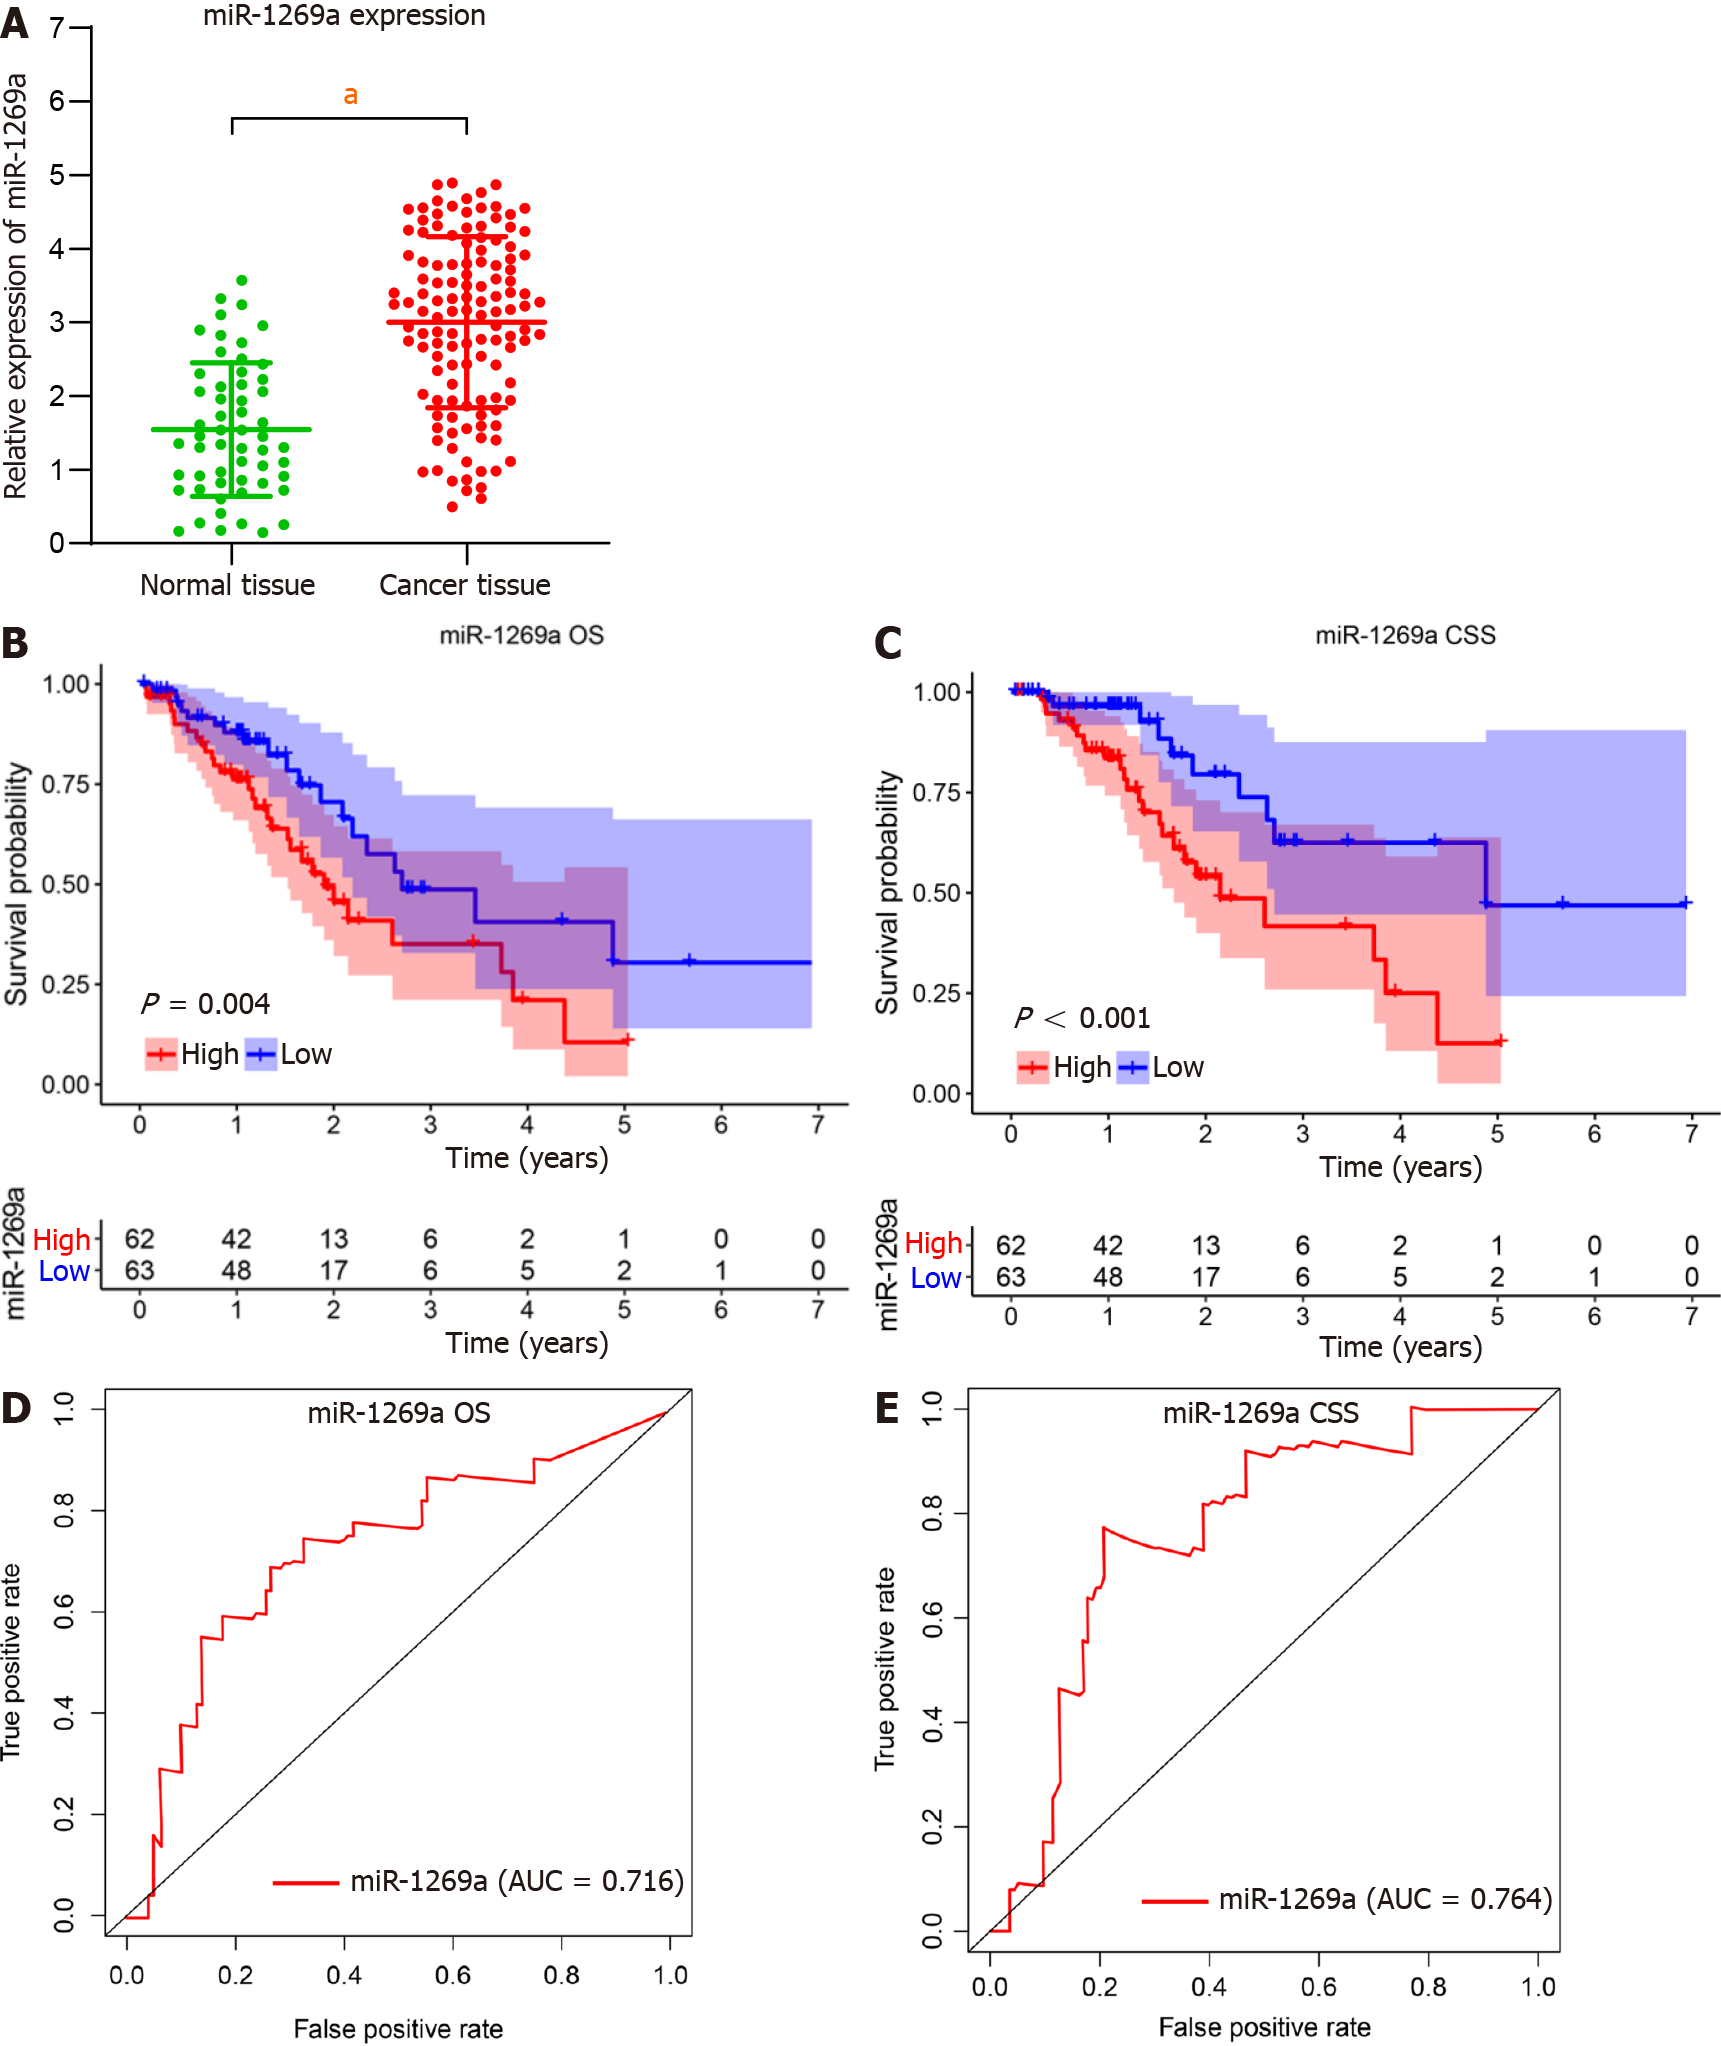
Figure 1 Expression and prognostic roles of microRNA-1269a in esophagus cancer.
A: Expression of microRNA (miR)-1269a in esophagus cancer tissue was higher than that in normal tissue; B, C: High expression of miR-1269a was correlated to poor overall survival (OS) and cancer specific survival (CSS), as compared to low expression group; D, E: miR-1269a had significant predictive capacity for prognosis with 0.716 in OS and 0.764 in CSS. aP < 0.05. AUC: Area under curve.
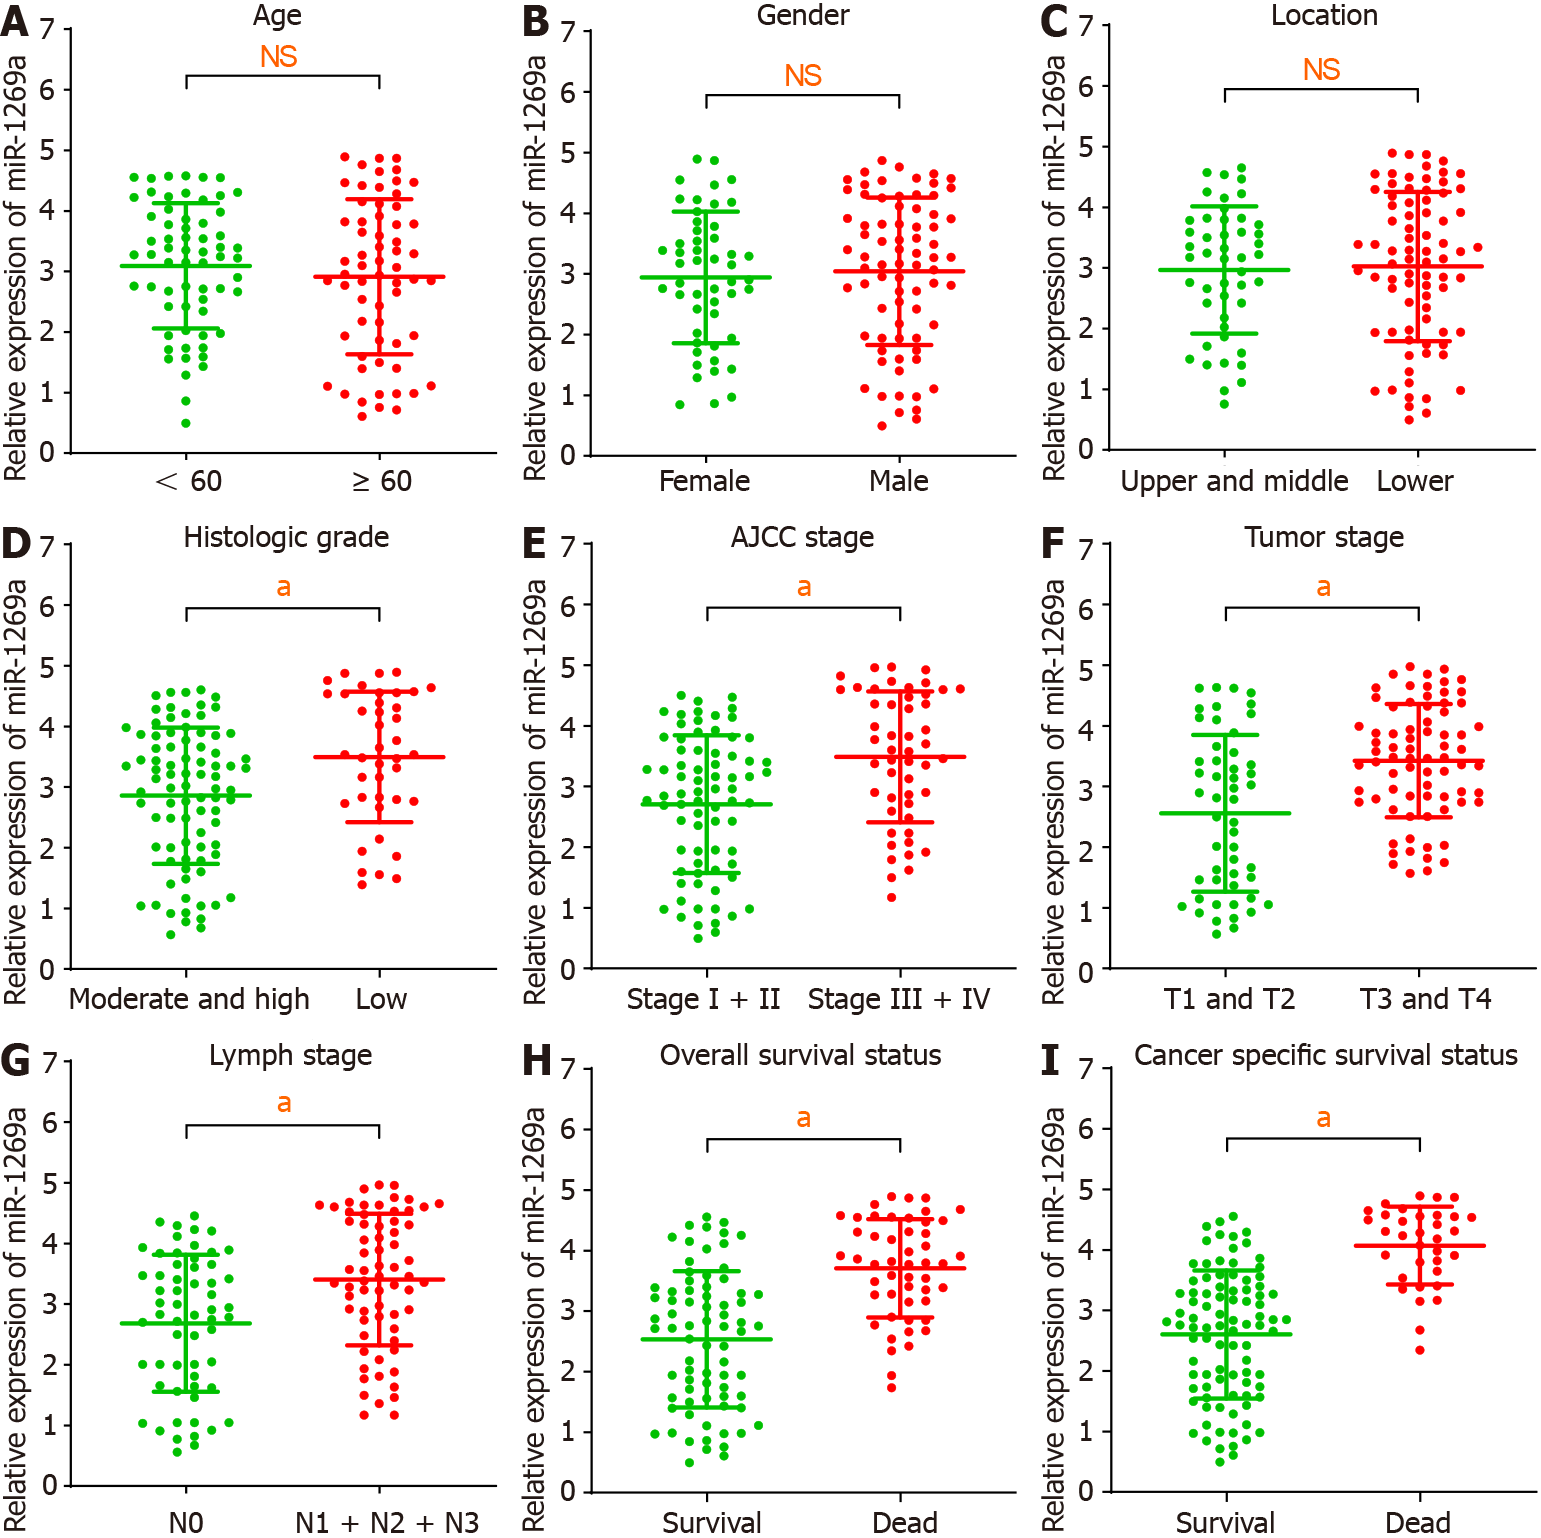
Figure 2 Correlation between microRNA-1269a expression and clinicopathological data.
A-C: There are no statistical differences between microRNA (miR)-1269a expression and age, gender, or tumor location; D-I: High miR-1269a expression had a significantly high correlation with lower histologic grade, higher tumor stage, positive lymph stage, higher American Joint Committee on Cancer (AJCC) stage, worse overall survival, and poor cancer specific survival. aP < 0.05. NS: Not significant.
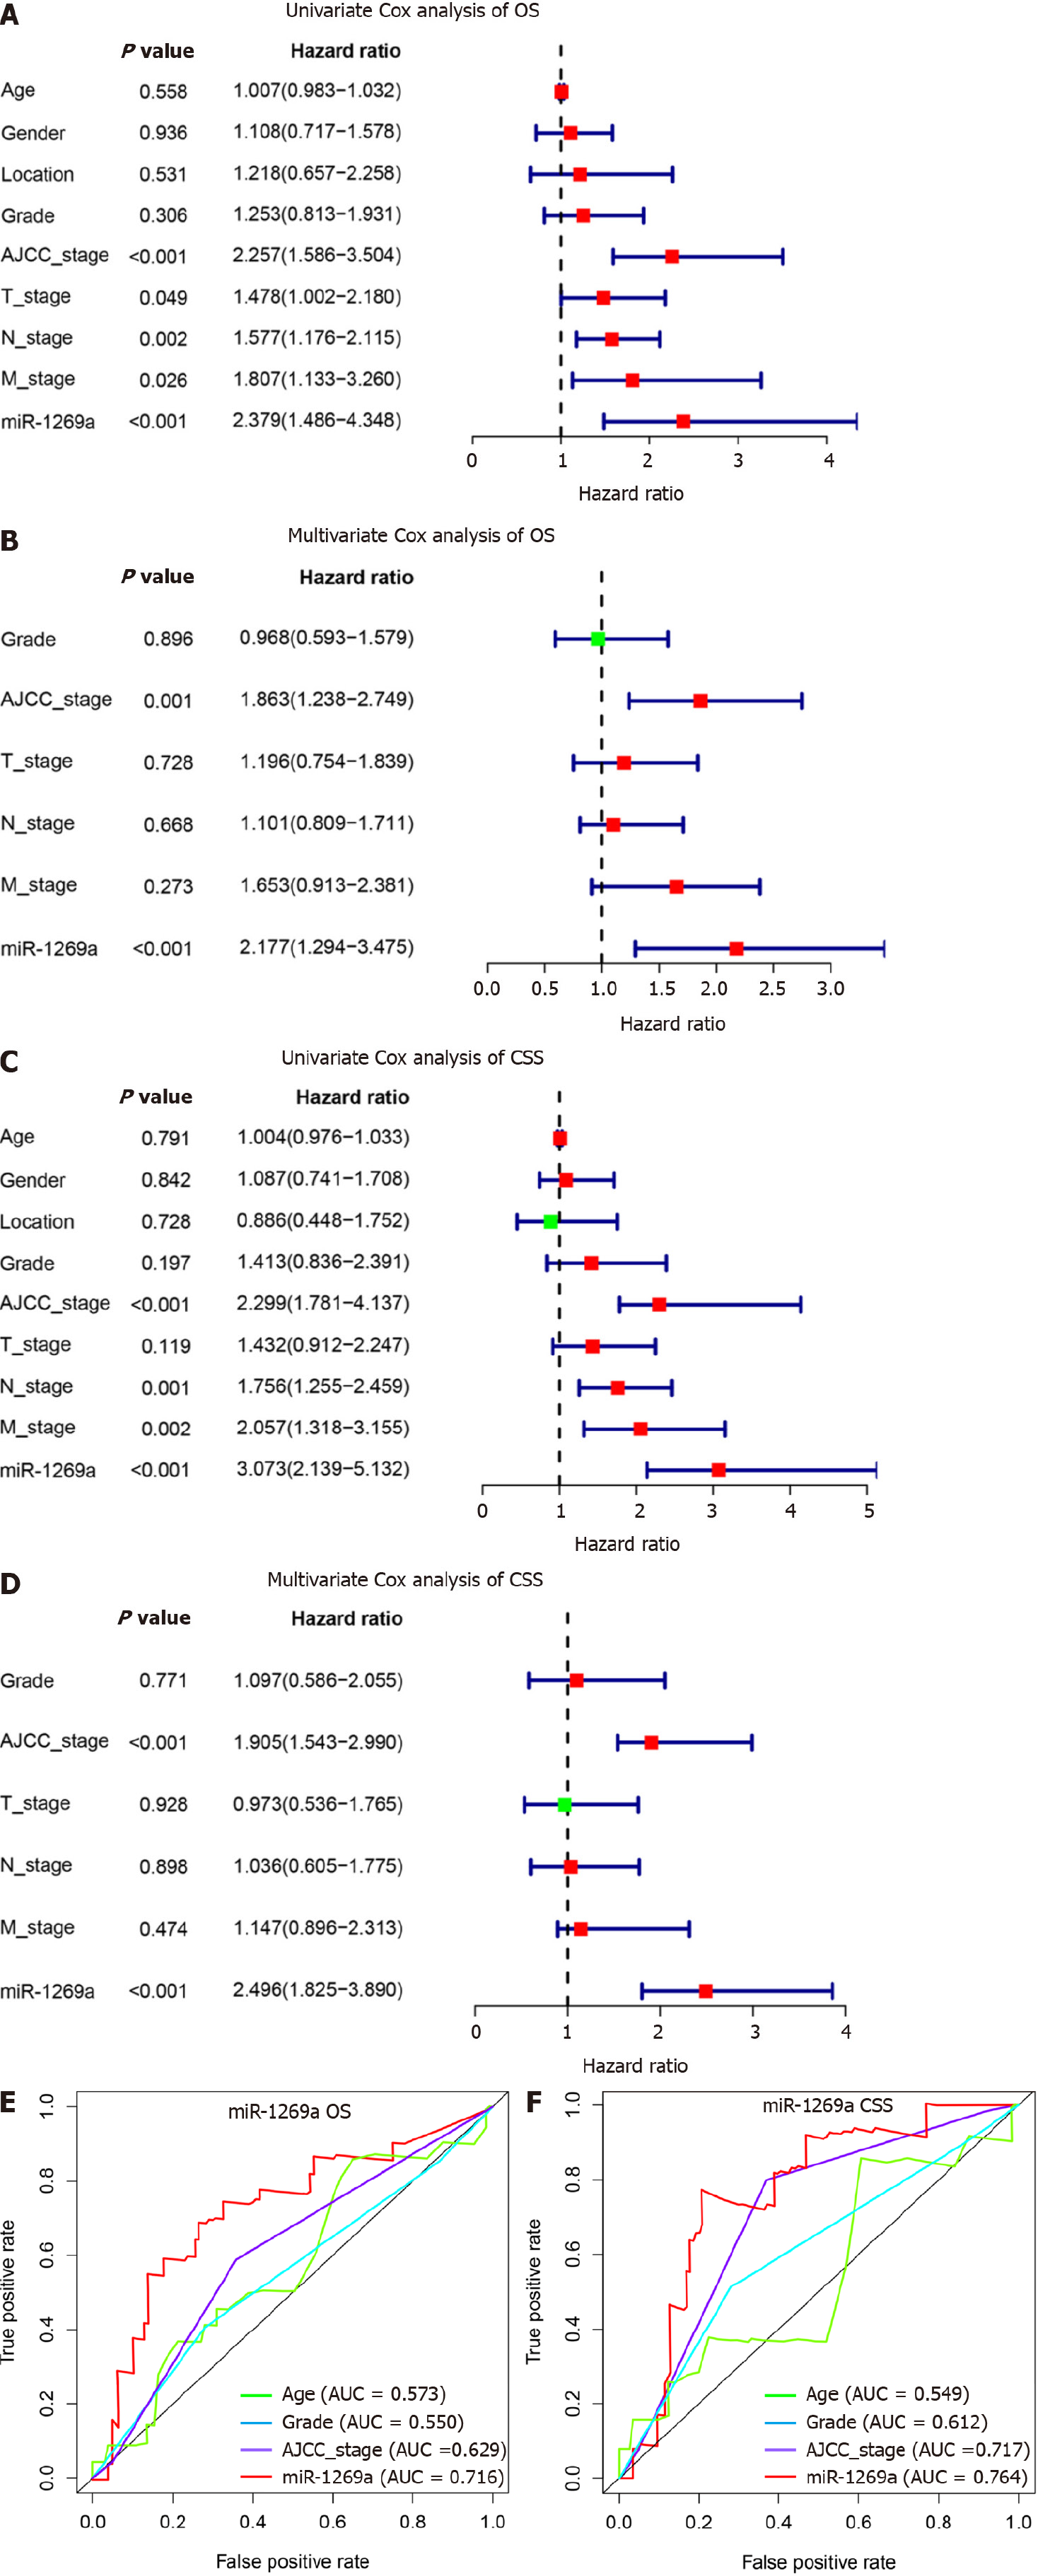
Figure 3 Identification risk factors for overall survival and cancer specific survival by Cox analysis.
A, B: Univariate and multivariate Cox analyses recognized microRNA (miR)-1269a expression and American Joint Committee on Cancer (AJCC) stage as independent risk factors for overall survival (OS); C, D: Univariate and multivariate Cox analyses recognized miR-1269a expression and AJCC stage as independent risk factors for cancer specific survival (CSS); E, F: miR-1269a expression had better prognostic prediction capacity than age, histologic grade, or AJCC stage for both OS and CSS. AUC: Area under curve.
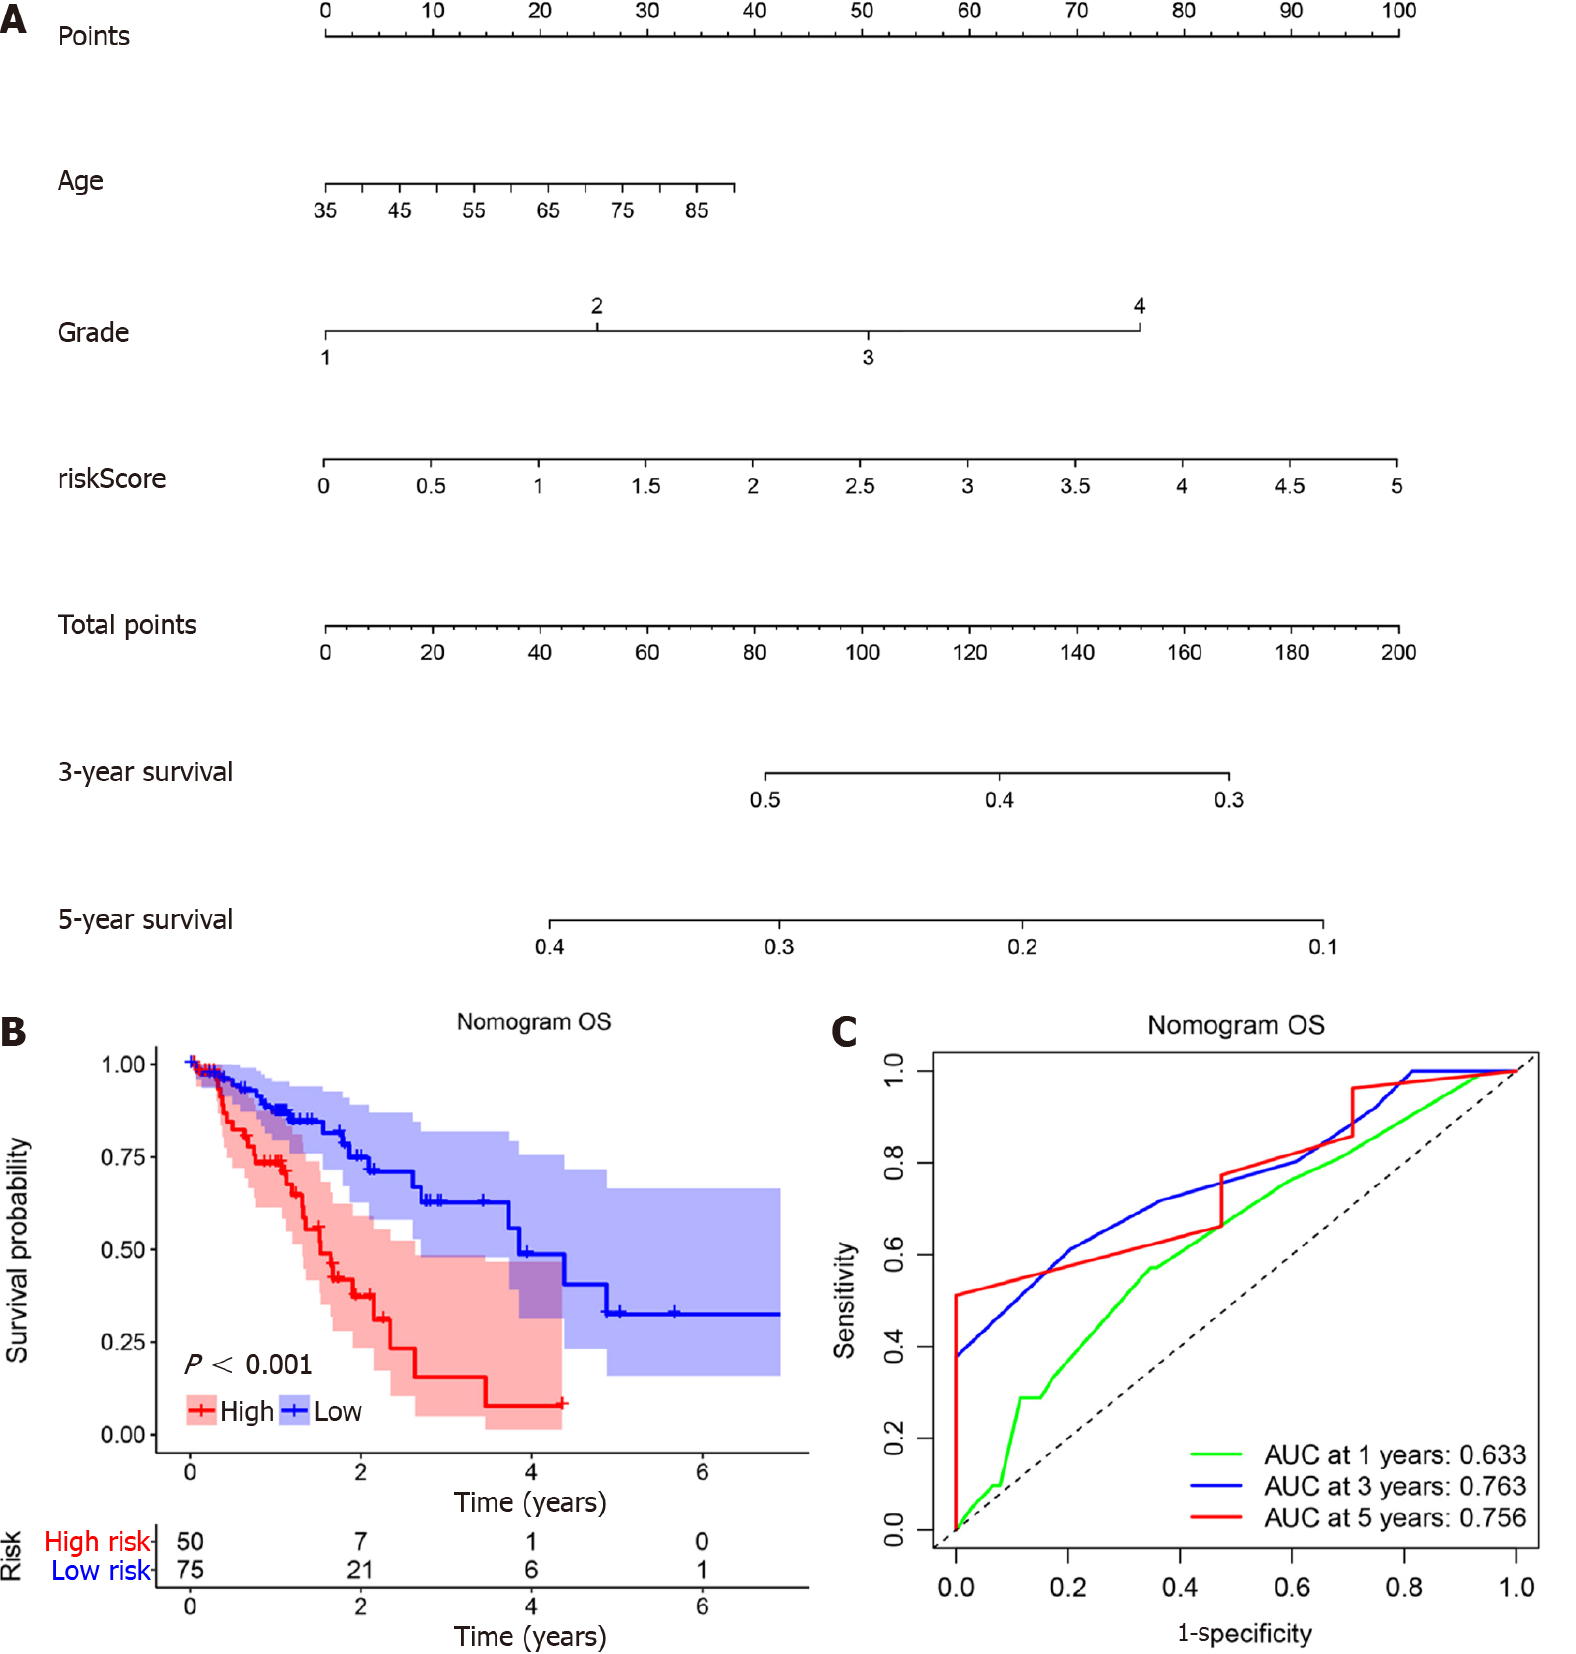
Figure 4 Nomogram construction and evaluation for overall survival.
A: A nomogram was developed to predict overall survival (OS) of patients with esophageal cancer; B: The nomogram showed excellent discrimination of prognosis for OS between high risk and low risk models (P < 0.001); C: The area under curve (AUC) values of the nomogram for the 1-, 3-, and 5-year OS were 0.633, 0.763, and 0.756, respectively, which were better than the prediction using miR-1269a and American Joint Committee on Cancer stage alone.
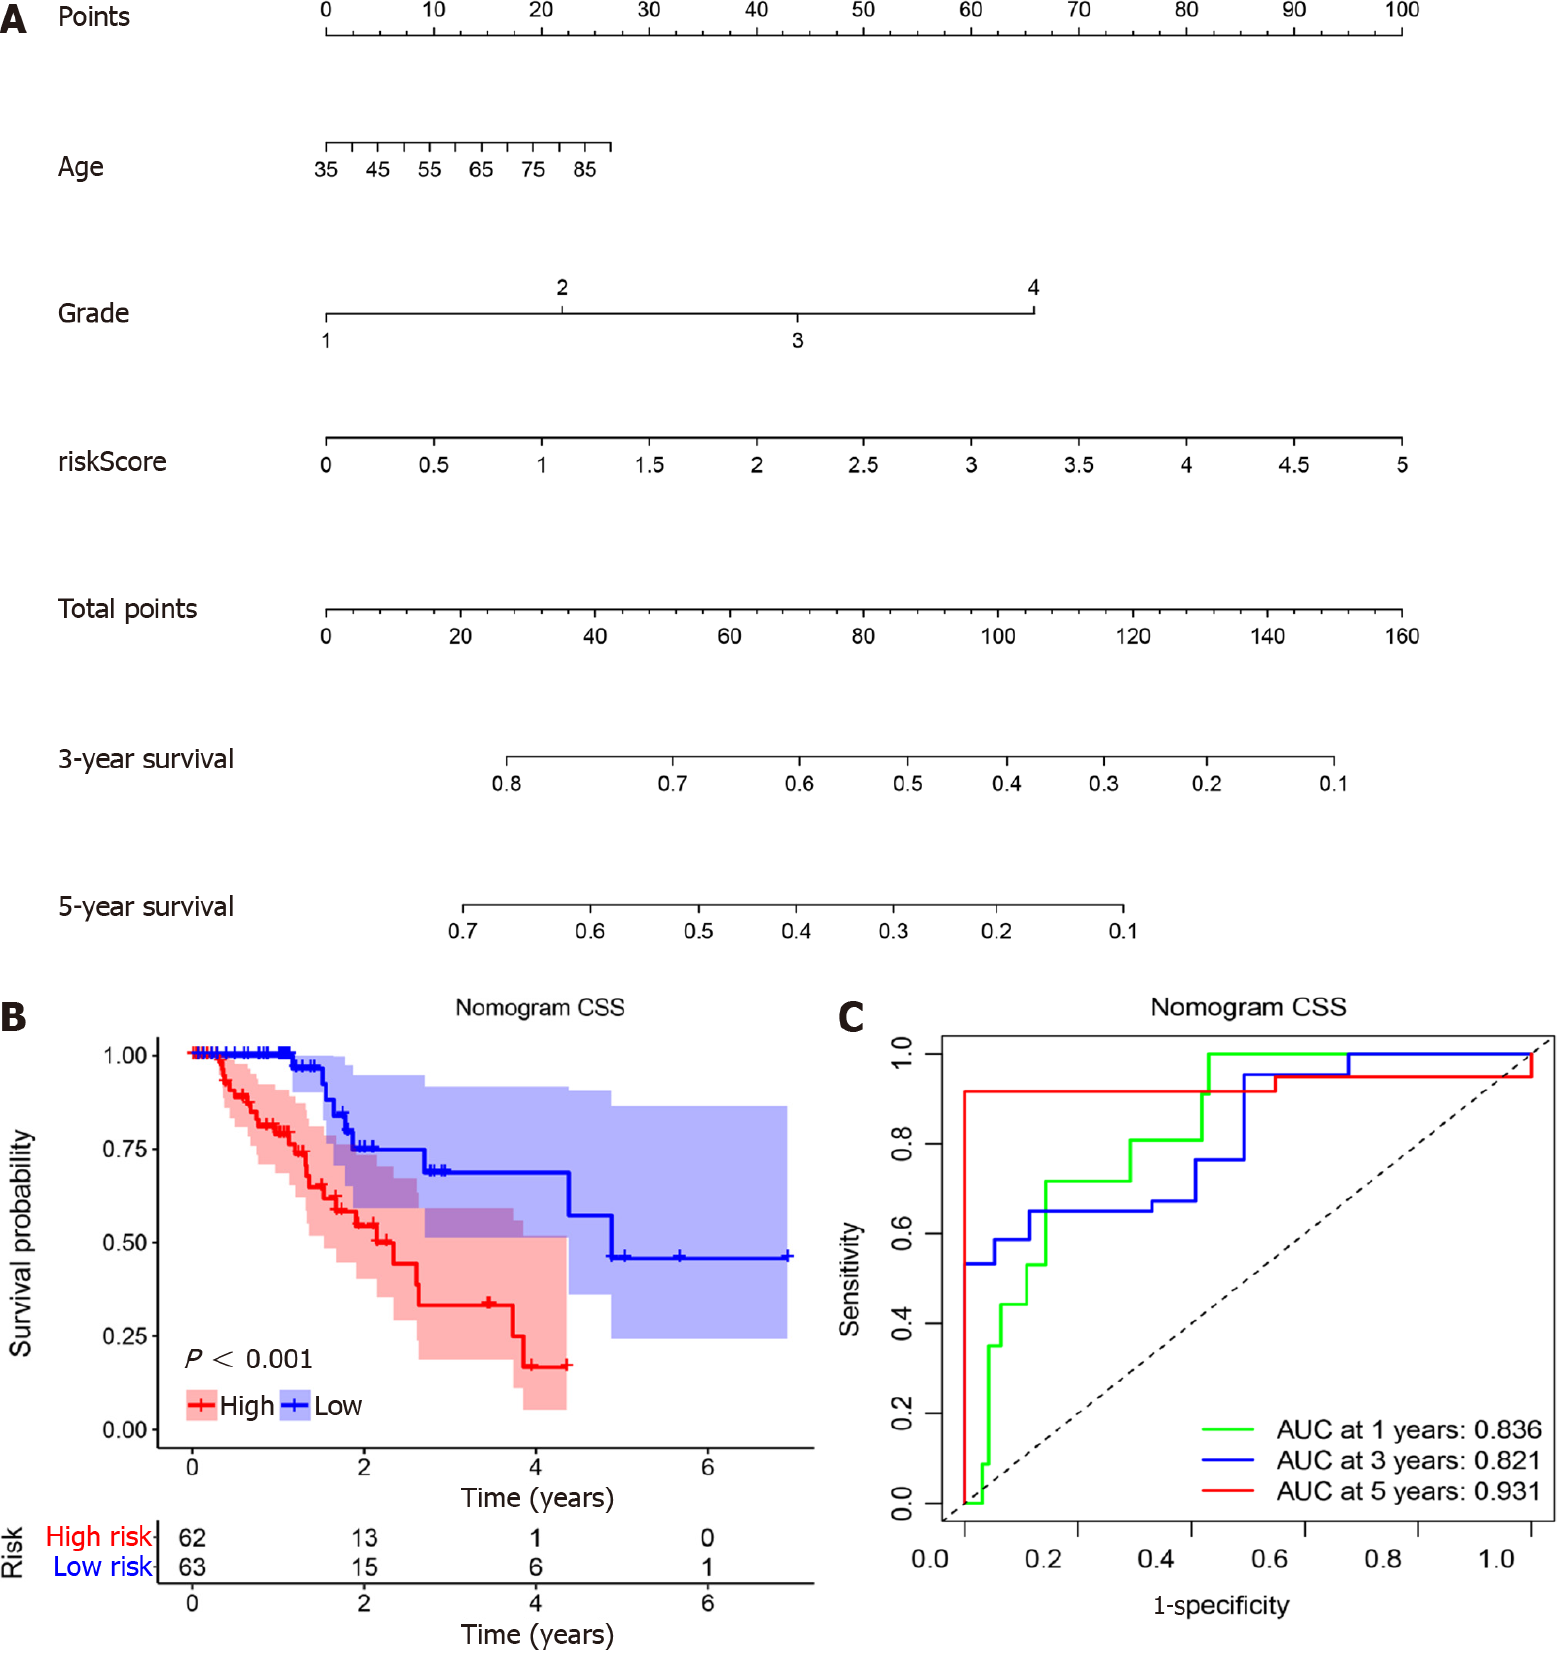
Figure 5 Nomogram construction and evaluation for cancer specific survival.
A: A nomogram was developed to predict cancer specific survival (CSS) of patients with esophageal cancer; B: The nomogram showed excellent discrimination of prognosis for CSS between high risk and low risk models (P < 0.001); C: The area under curve (AUC) values of nomogram for the 1-, 3-, and 5-year CSS were 0.633, 0.763, and 0.756, respectively, which were better than the prediction using miR-1269a and American Joint Committee on Cancer stage alone.
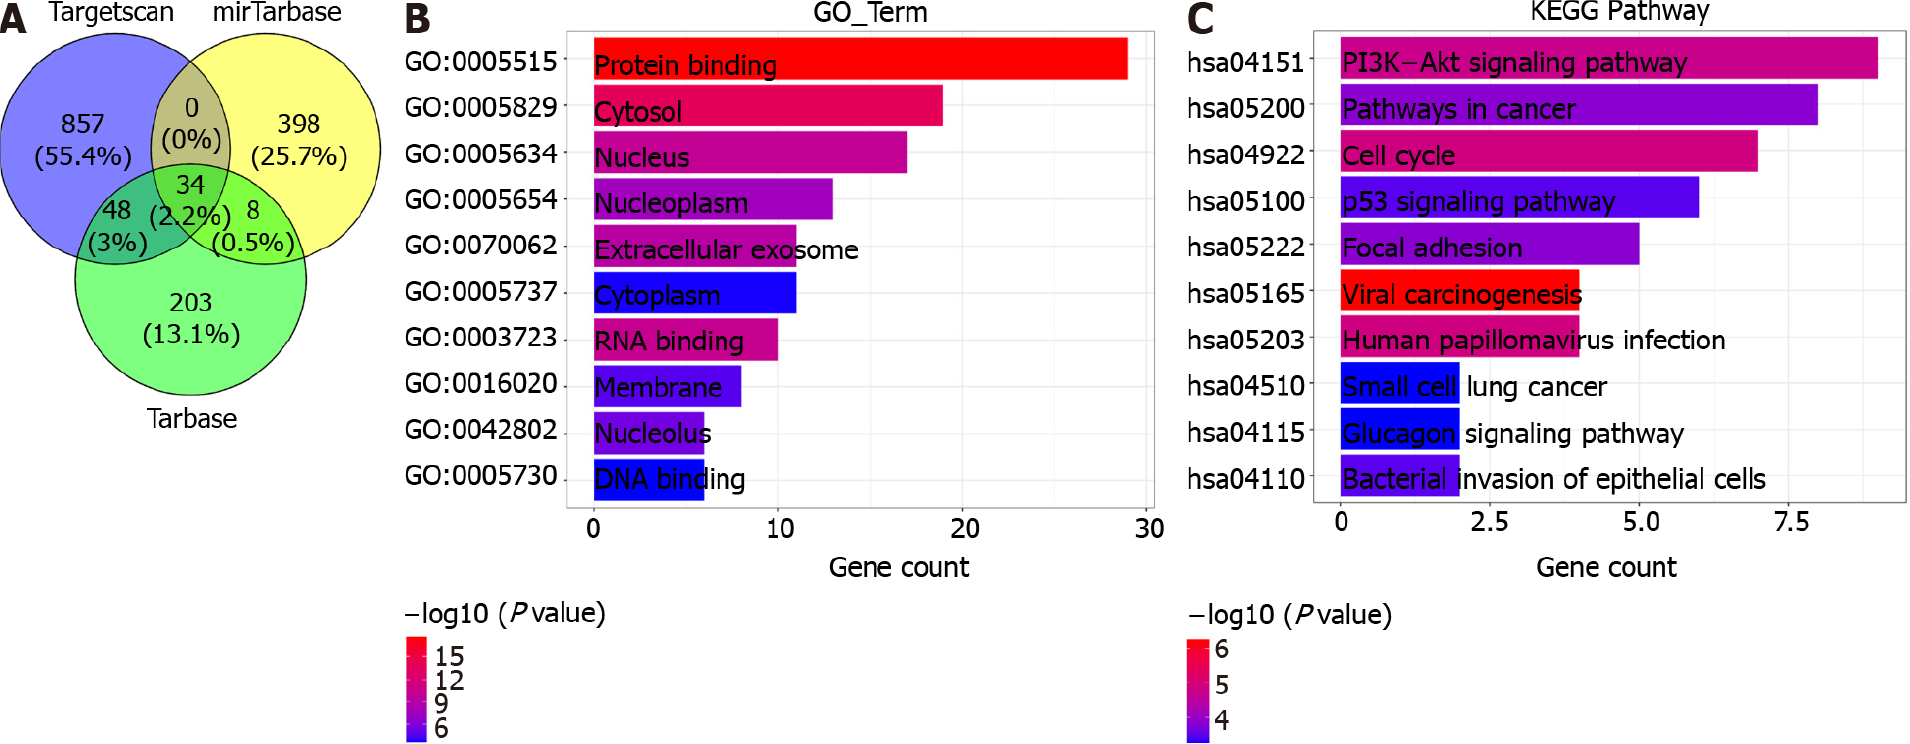
Figure 6 Function enrichment analysis of microRNA-1269a.
A: Venn diagram shows the common target genes in Targetscan, miRTarBase, and Tarbase; B: The top ten enriched Gene Ontology (GO) terms of common target genes in esophageal cancer (ESCA); C: The top ten enriched Kyoto Encyclopedia of Gene and Genomes (KEGG) pathways of common target genes in ESCA.
- Citation: Yu Y, Ren KM. Development of a prognostic prediction model based on microRNA-1269a in esophageal cancer. World J Gastrointest Oncol 2021; 13(8): 943-958
- URL: https://www.wjgnet.com/1948-5204/full/v13/i8/943.htm
- DOI: https://dx.doi.org/10.4251/wjgo.v13.i8.943


