Copyright
©The Author(s) 2020.
World J Gastrointest Oncol. Apr 15, 2020; 12(4): 467-482
Published online Apr 15, 2020. doi: 10.4251/wjgo.v12.i4.467
Published online Apr 15, 2020. doi: 10.4251/wjgo.v12.i4.467
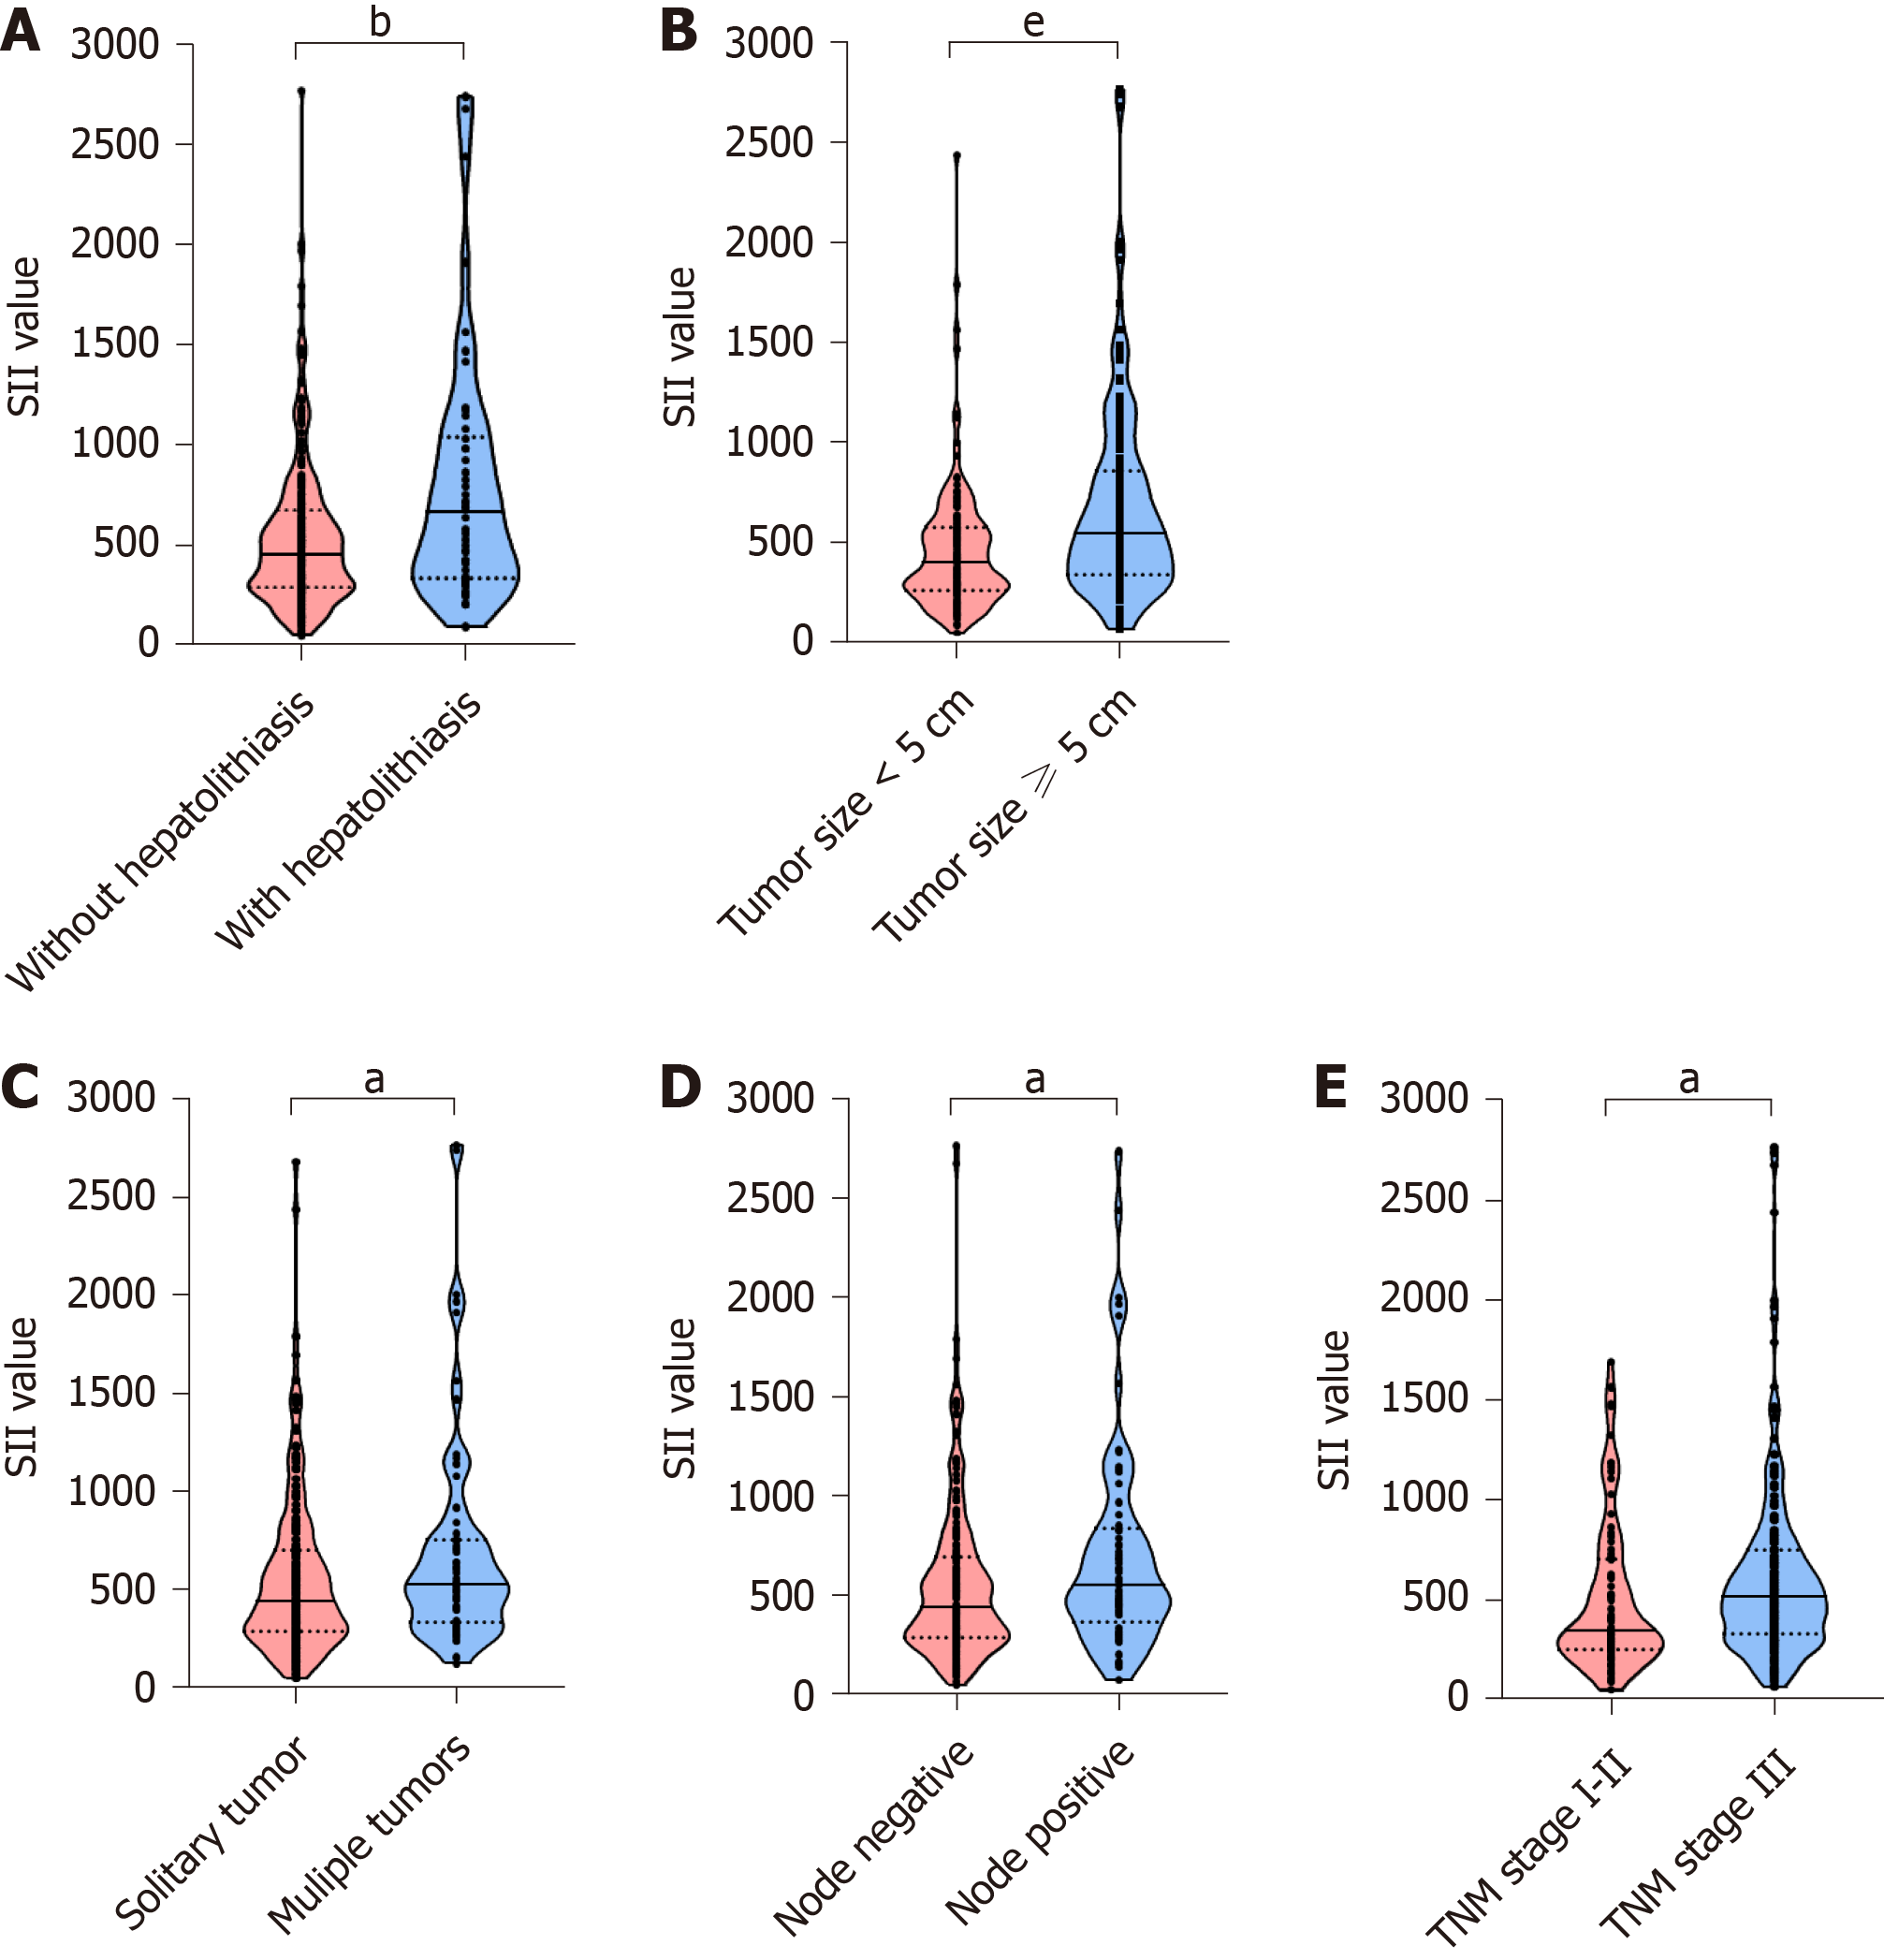
Figure 1 Violin plots showing the preoperative systemic immune-inflammation index level stratified by (A) status of hepatolithiasis, (B) tumor size, (C) tumor number, (D) status of lymph node invasion, and (E) TNM stage.
aP < 0.05; bP < 0.01; eP < 0.001. SII: Systemic immune-inflammation index; TNM: Tumor-node-metastasis according to the 8th edition of the American Joint Committee on Cancer Staging Manual.
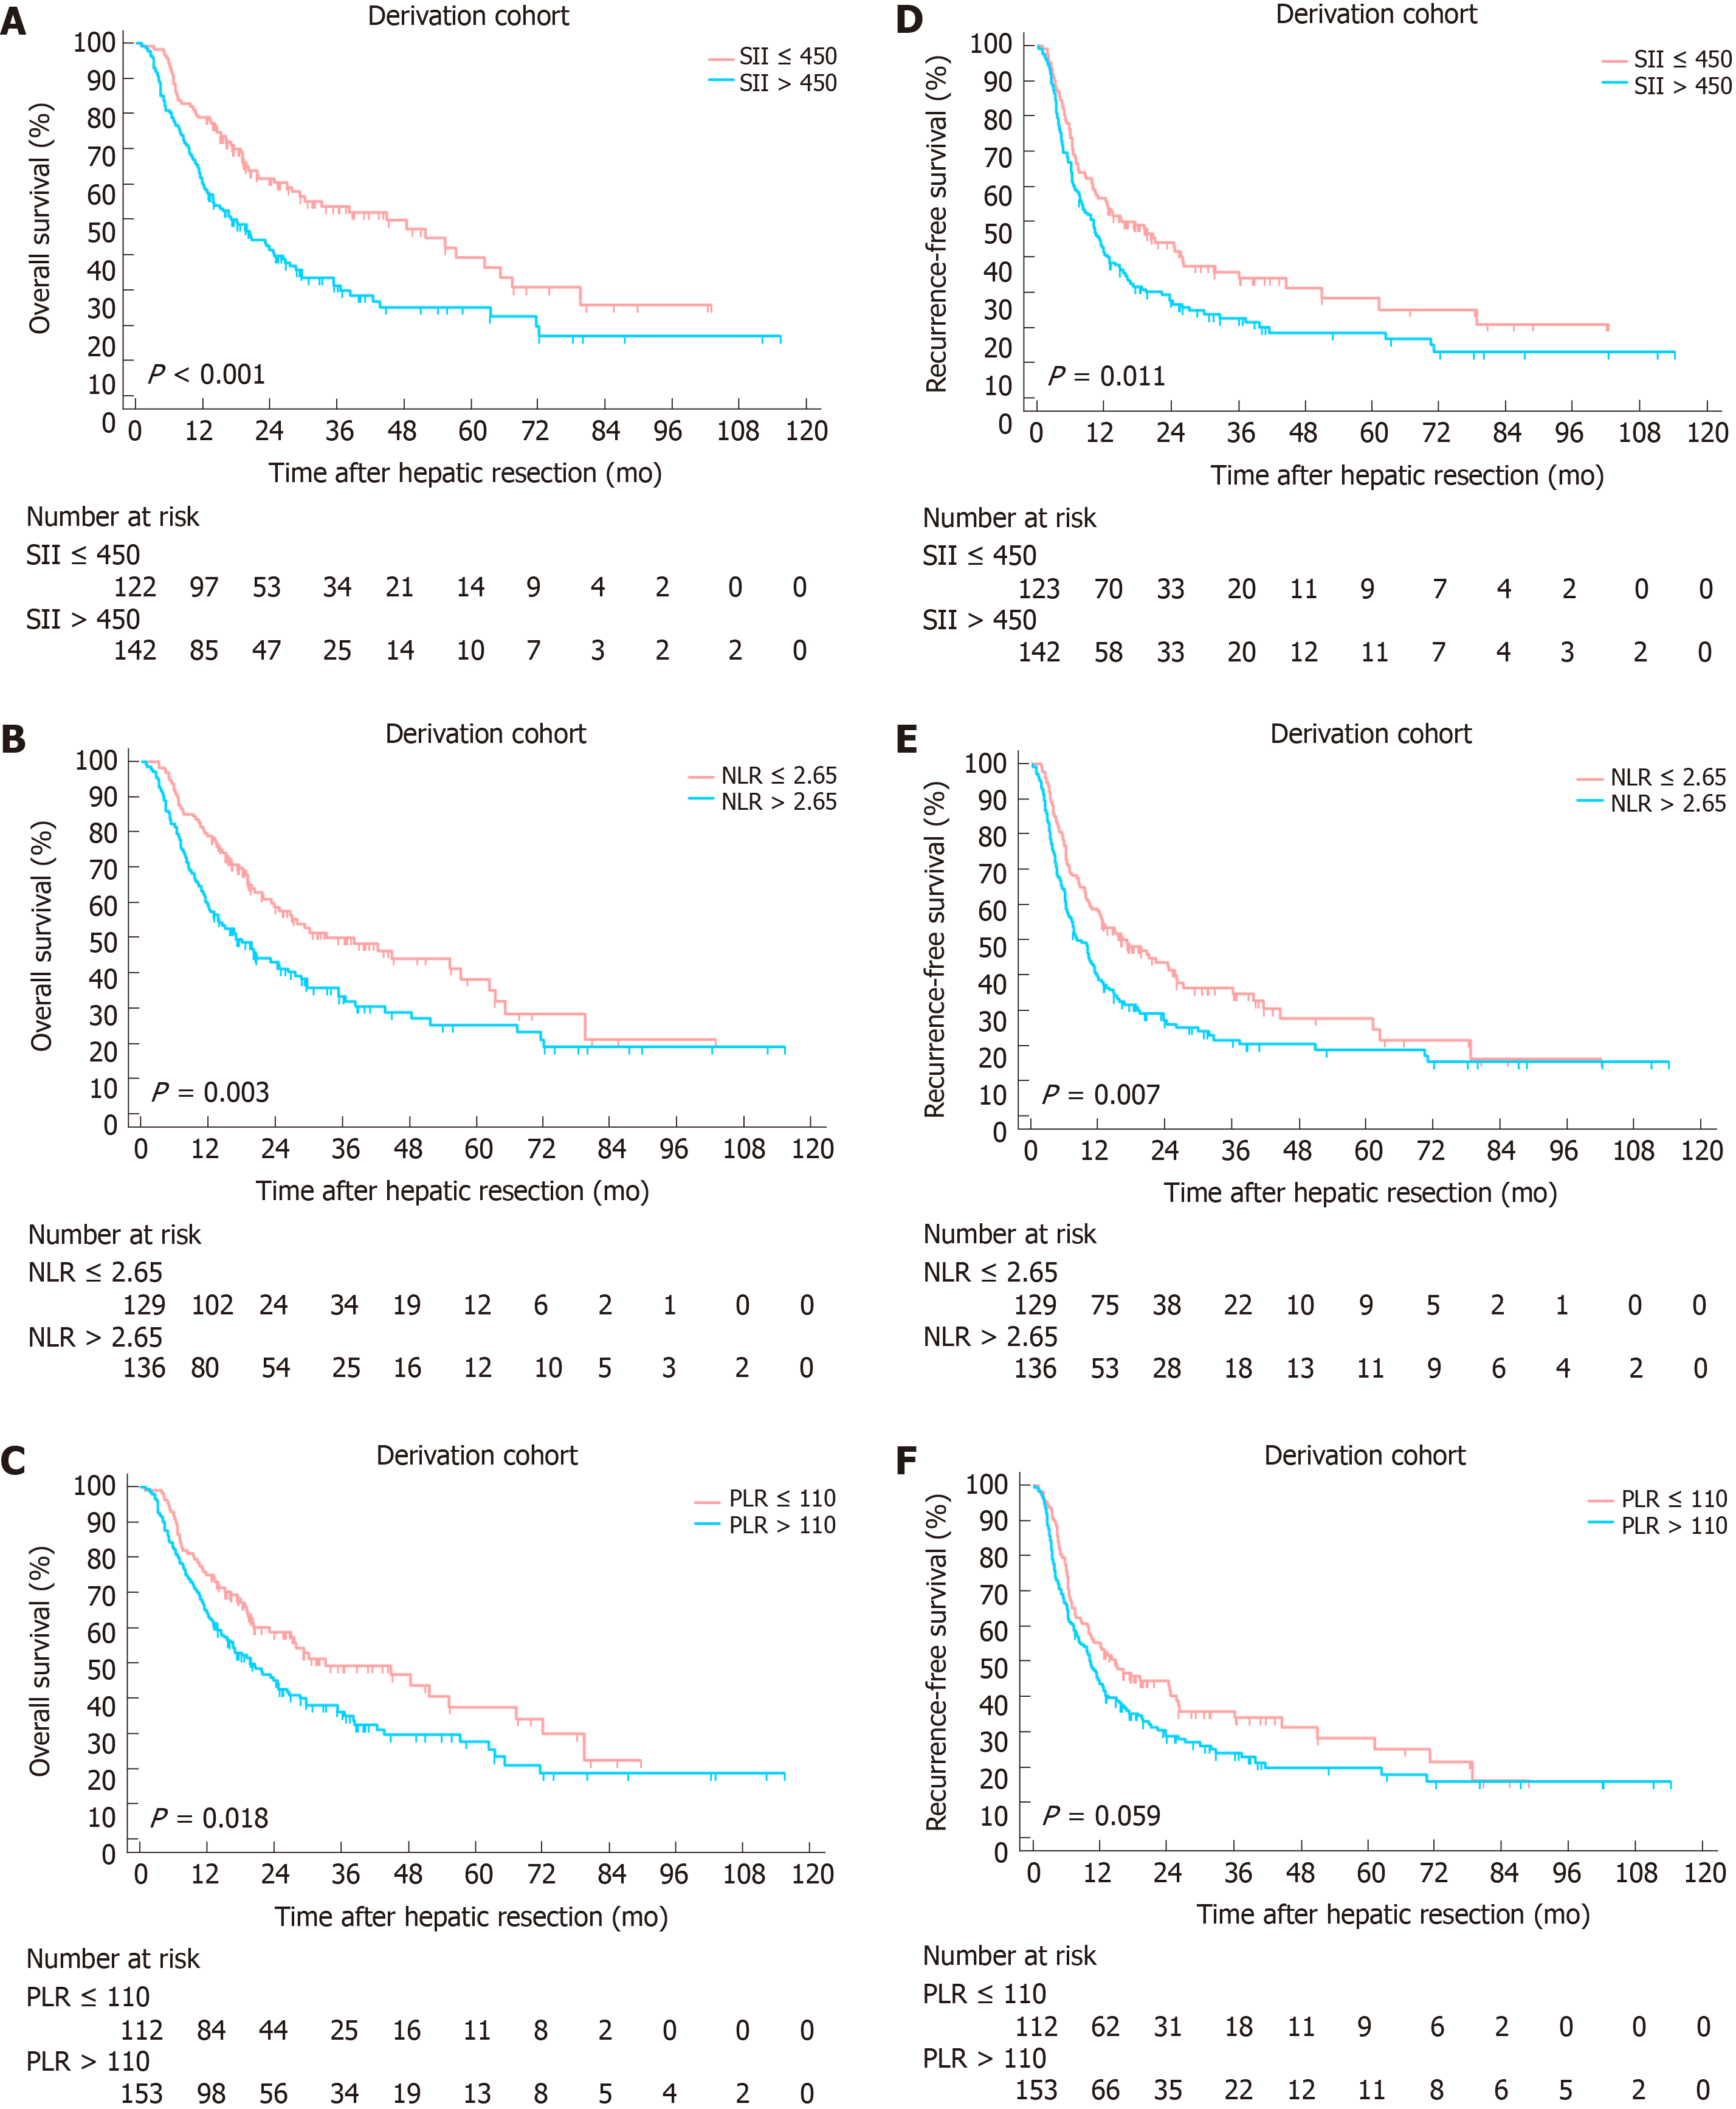
Figure 2 Kaplan-Meier curves for overall survival and recurrence-free survival stratified by systemic immune-inflammation index (A and D), neutrophil-to-lymphocyte ratio (B and E) and platelet-to-lymphocyte ratio (C and F) in the derivation cohort.
SII: Systemic immune-inflammation index; NLR: Neutrophil-to-lymphocyte ratio; PLR: Platelet-to-lymphocyte ratio.
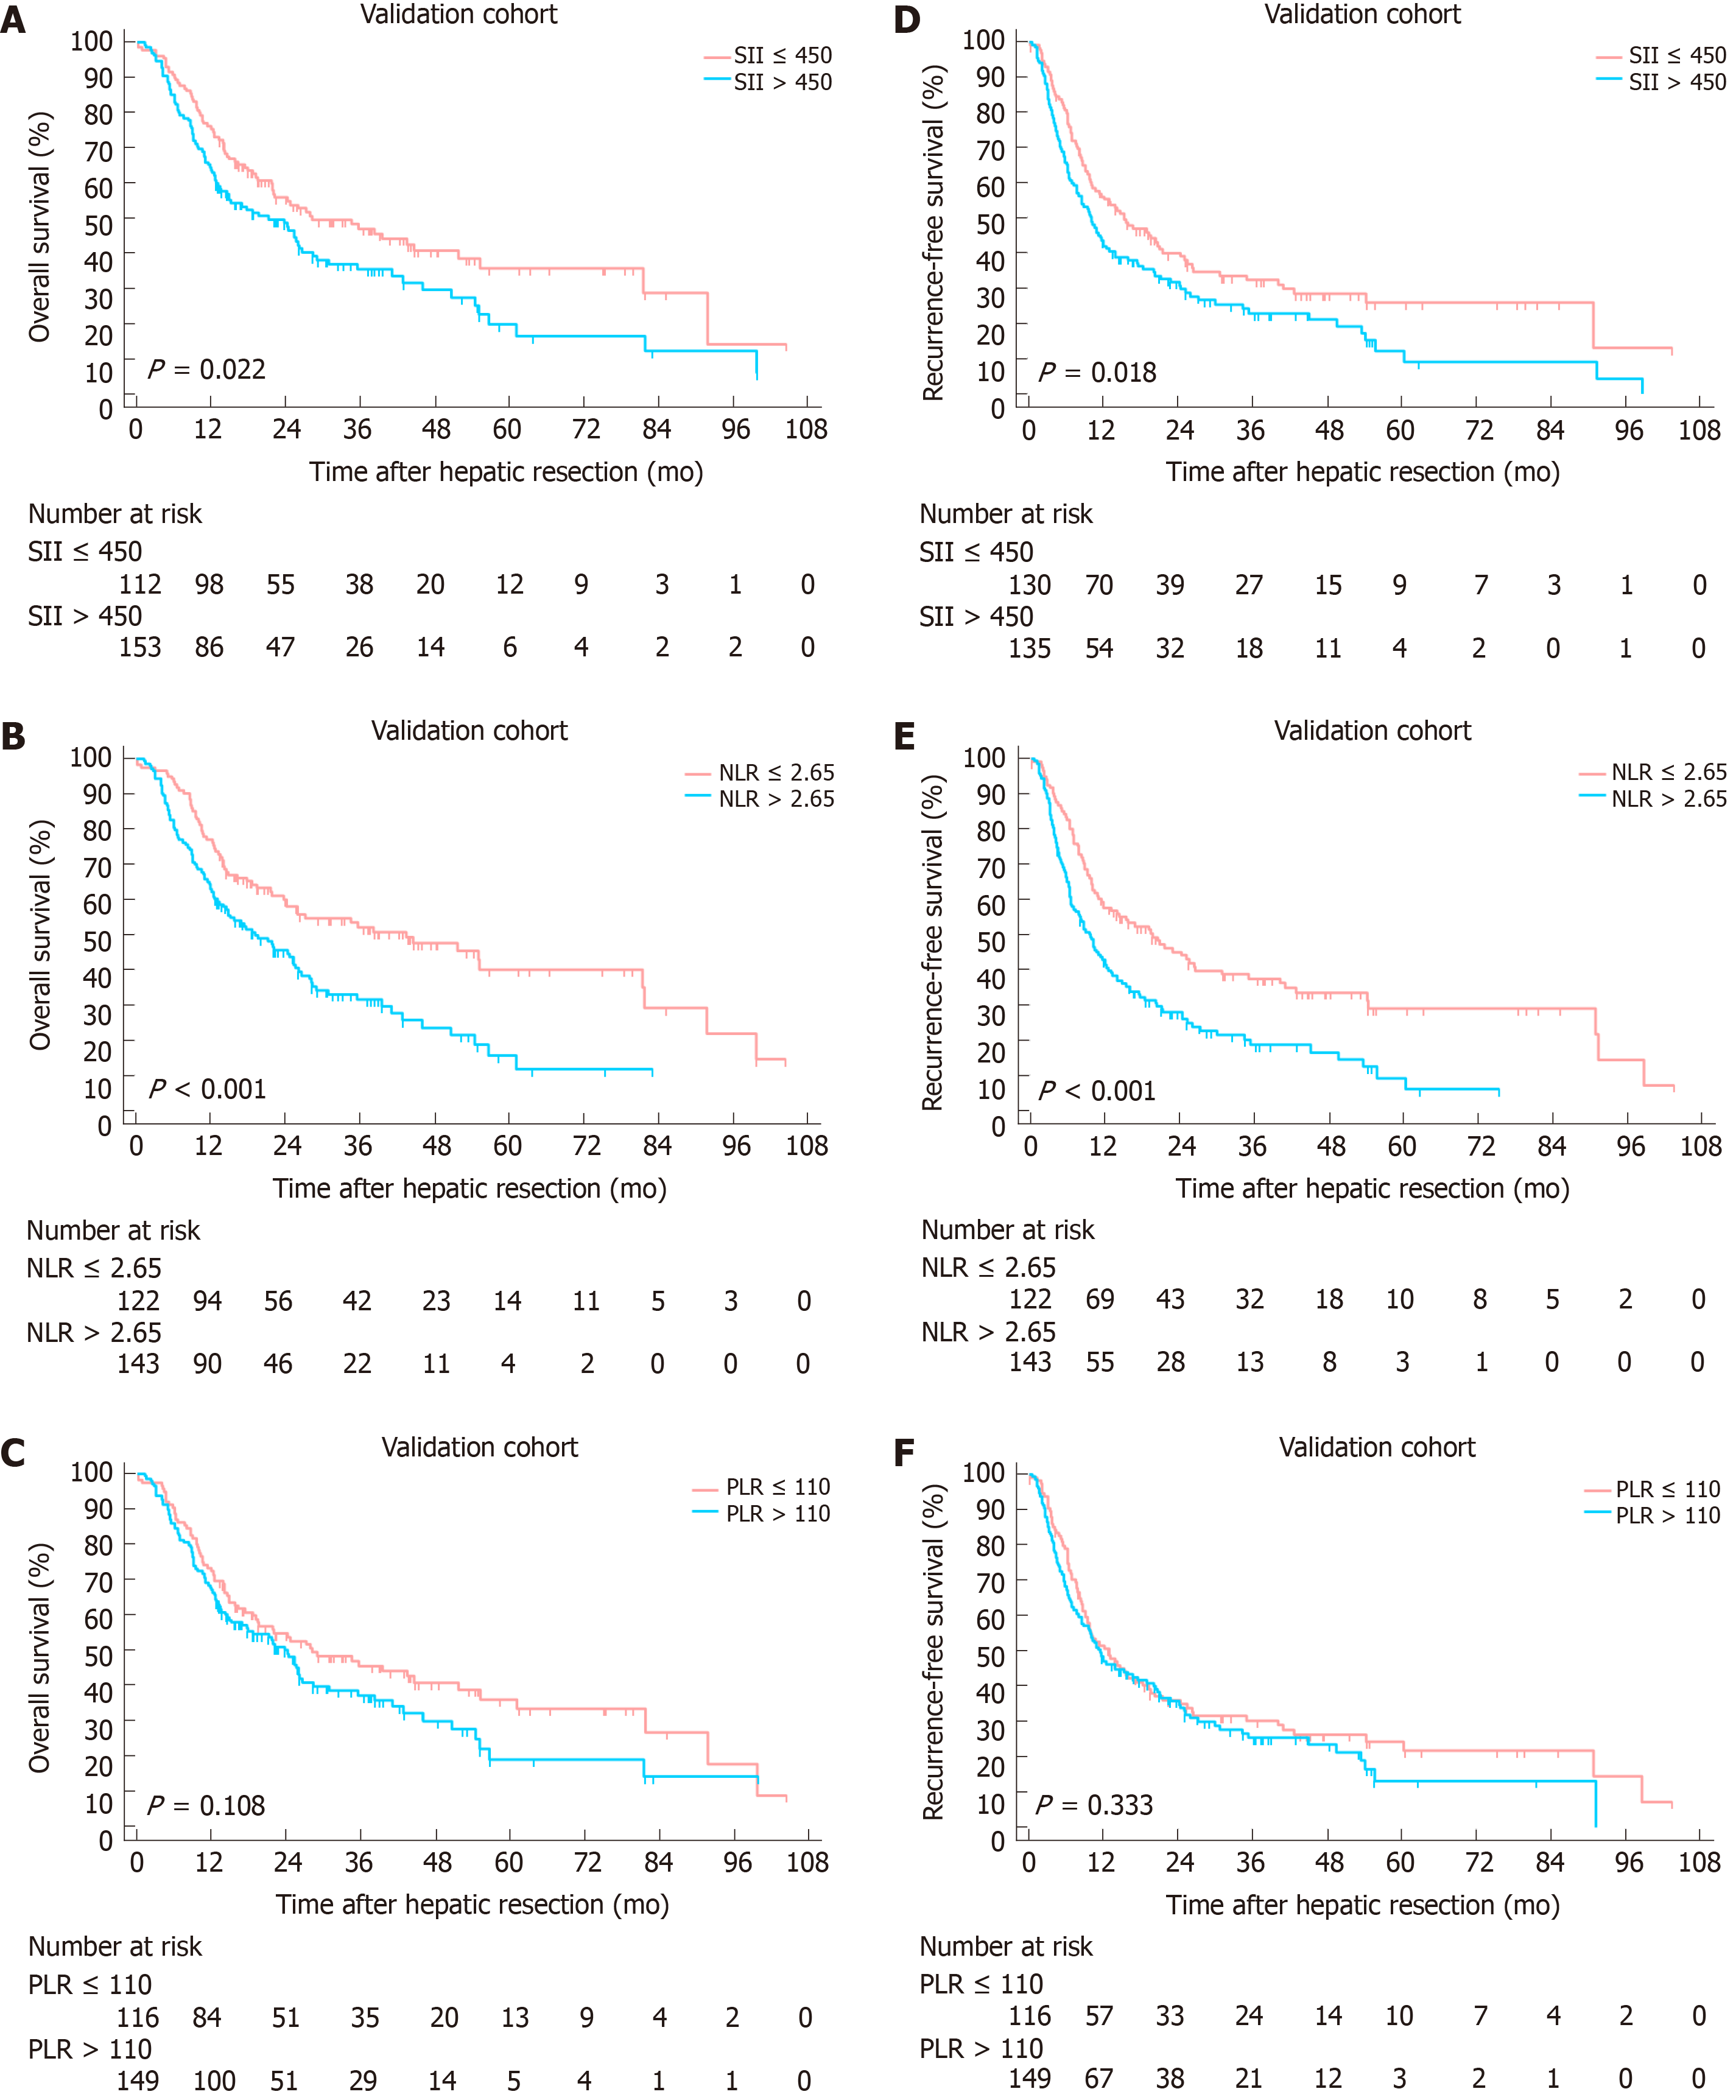
Figure 3 Kaplan-Meier curves for overall survival and recurrence-free survival stratified by systemic immune-inflammation index (A and D), neutrophil-to-lymphocyte ratio (B and E) and platelet-to-lymphocyte ratio (C and F) in the validation cohort.
SII: Systemic immune-inflammation index; NLR: Neutrophil-to-lymphocyte ratio; PLR: Platelet-to-lymphocyte ratio.
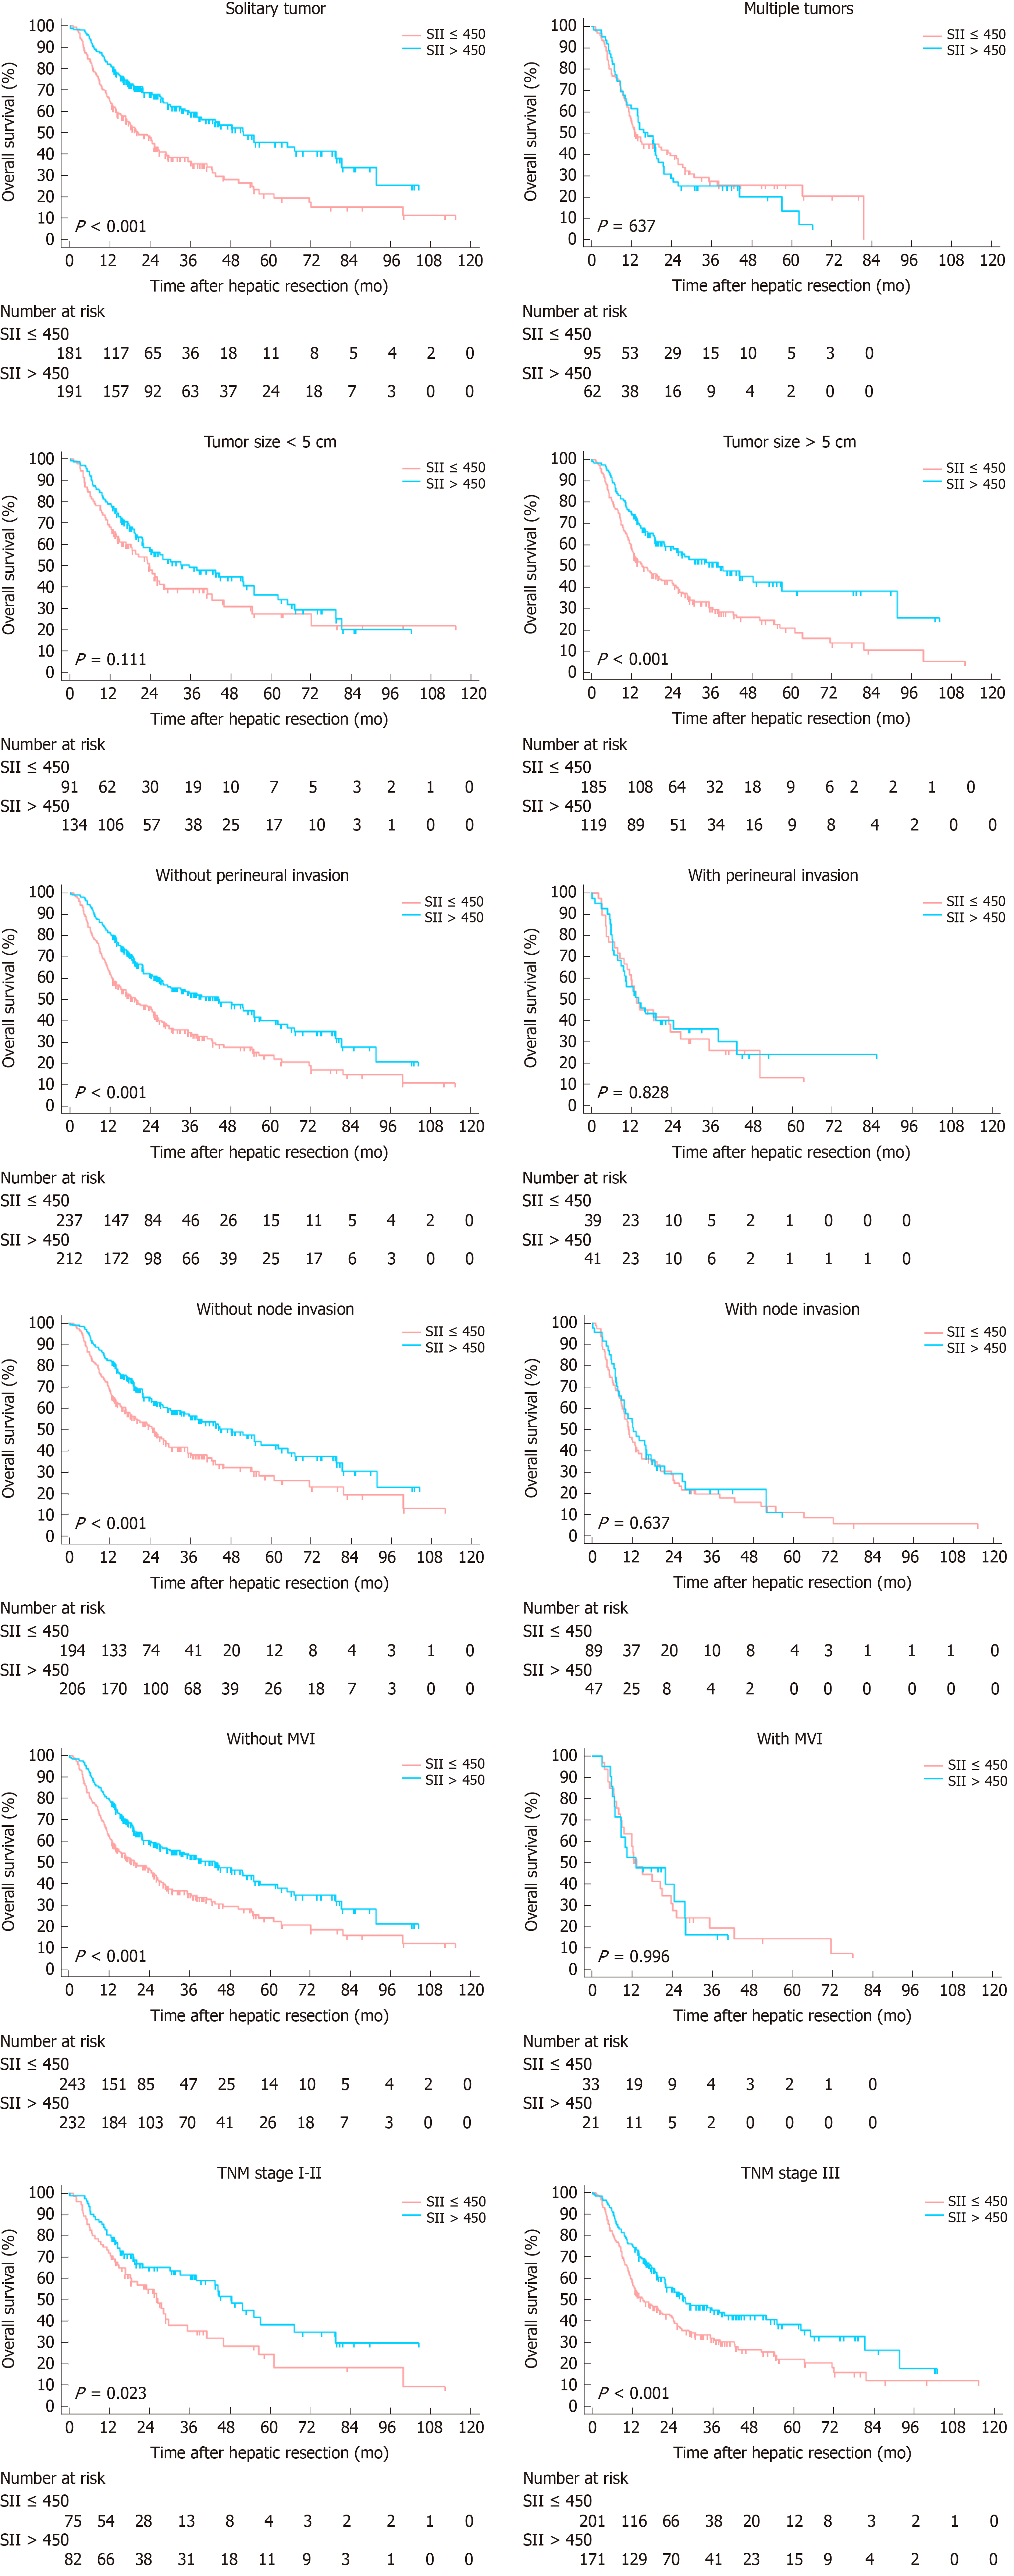
Figure 4 Subgroup analyses for overall survival based on clinicopathologic features in the entire cohort.
SII: Systemic immune-inflammation index.
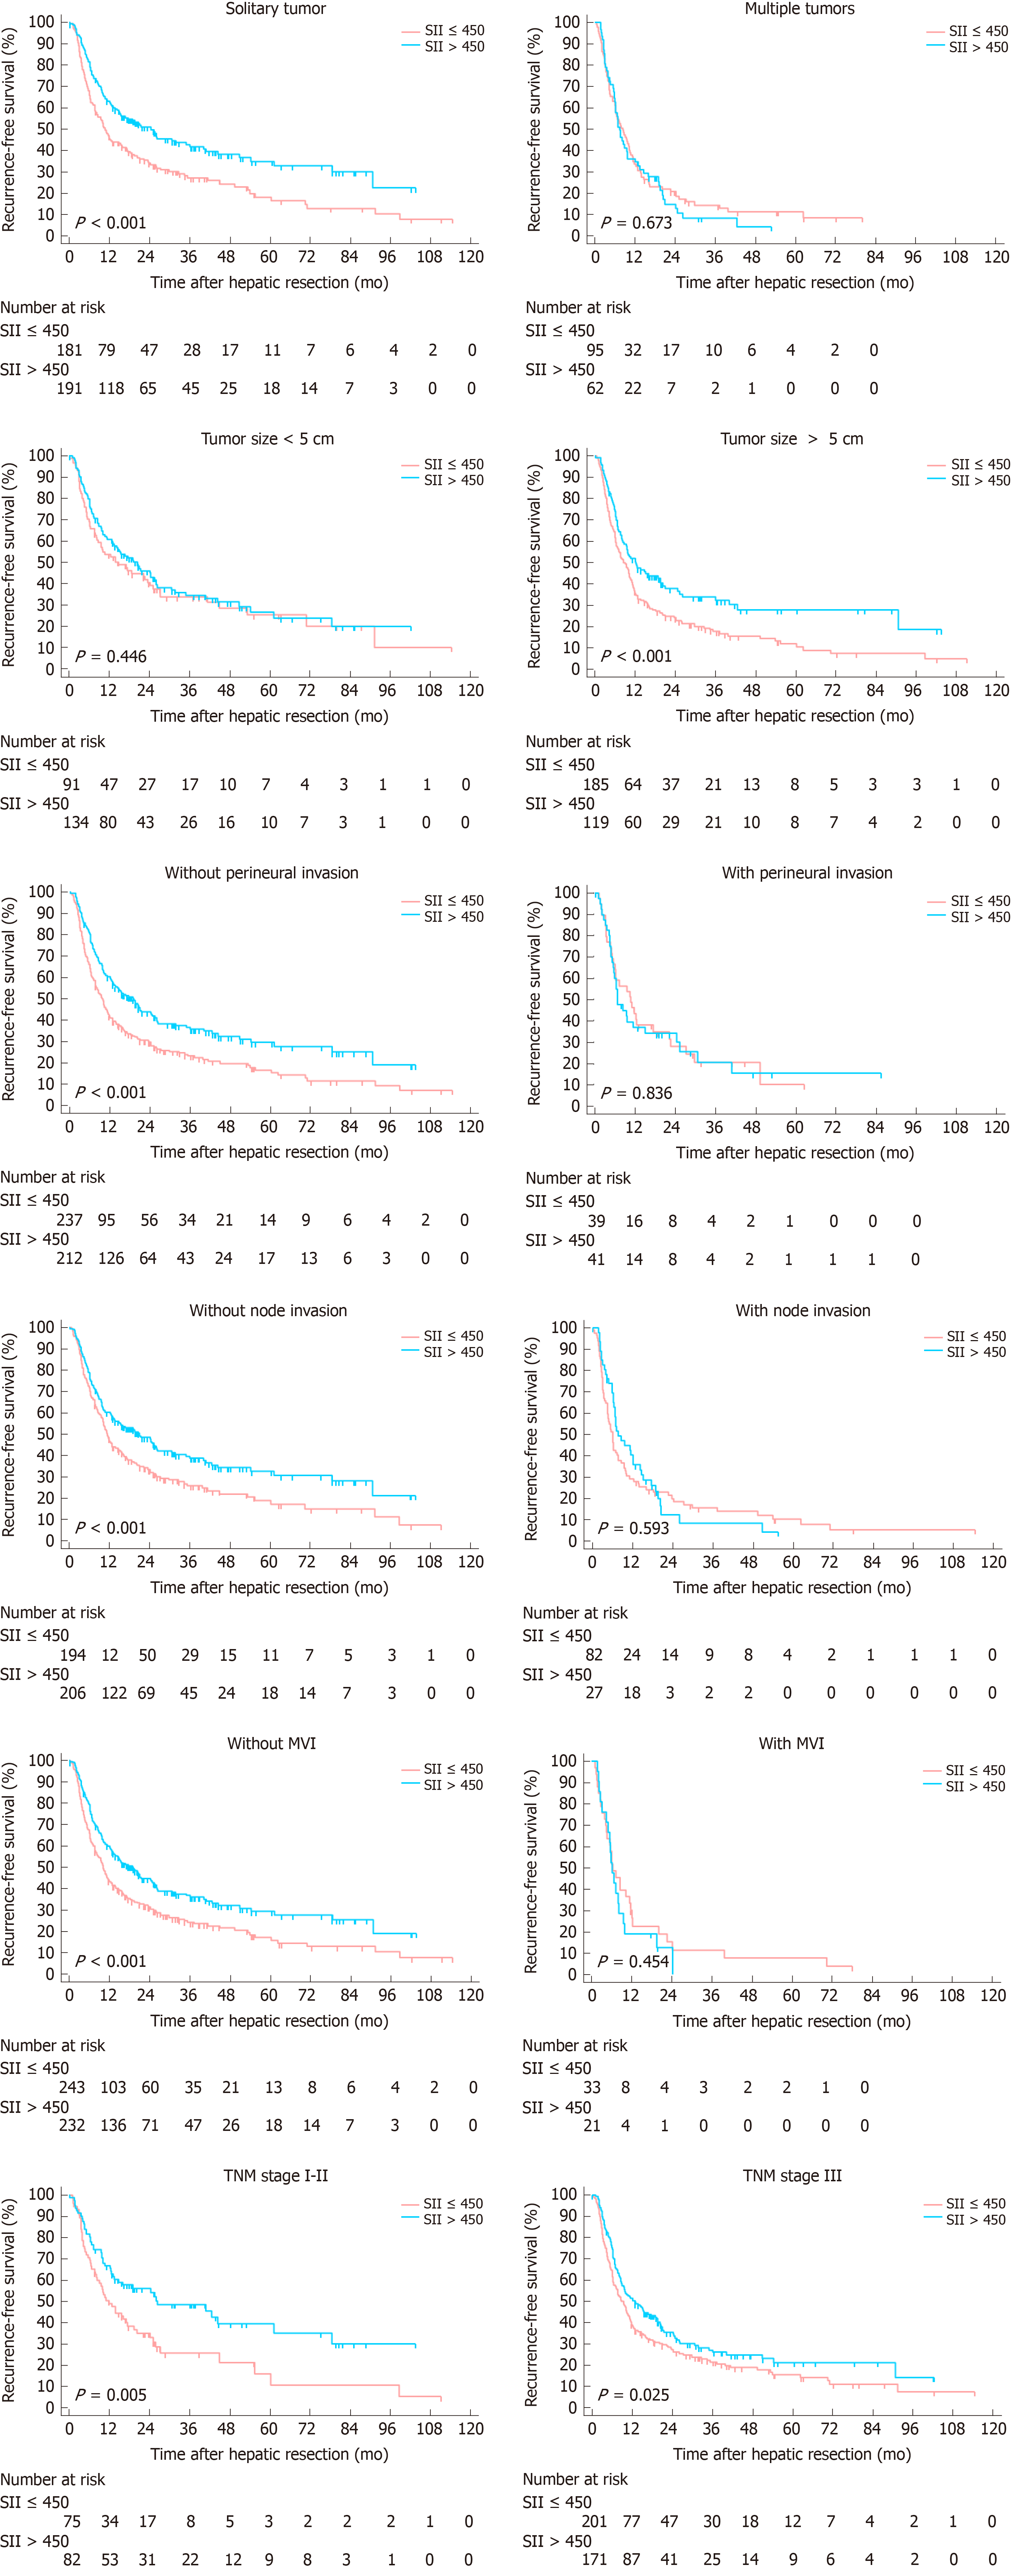
Figure 5 Subgroup analyses for recurrence-free survival based on clinicopathologic features in the entire cohort.
SII: Systemic immune-inflammation index.
- Citation: Li H, Wang JJ, Zhang M, Ren B, Li JX, Xu L, Wu H. Prognostic significance of systemic immune-inflammation index in patients with intrahepatic cholangiocarcinoma undergoing hepatic resection. World J Gastrointest Oncol 2020; 12(4): 467-482
- URL: https://www.wjgnet.com/1948-5204/full/v12/i4/467.htm
- DOI: https://dx.doi.org/10.4251/wjgo.v12.i4.467


