Copyright
©The Author(s) 2019.
World J Gastrointest Oncol. Apr 15, 2019; 11(4): 281-294
Published online Apr 15, 2019. doi: 10.4251/wjgo.v11.i4.281
Published online Apr 15, 2019. doi: 10.4251/wjgo.v11.i4.281
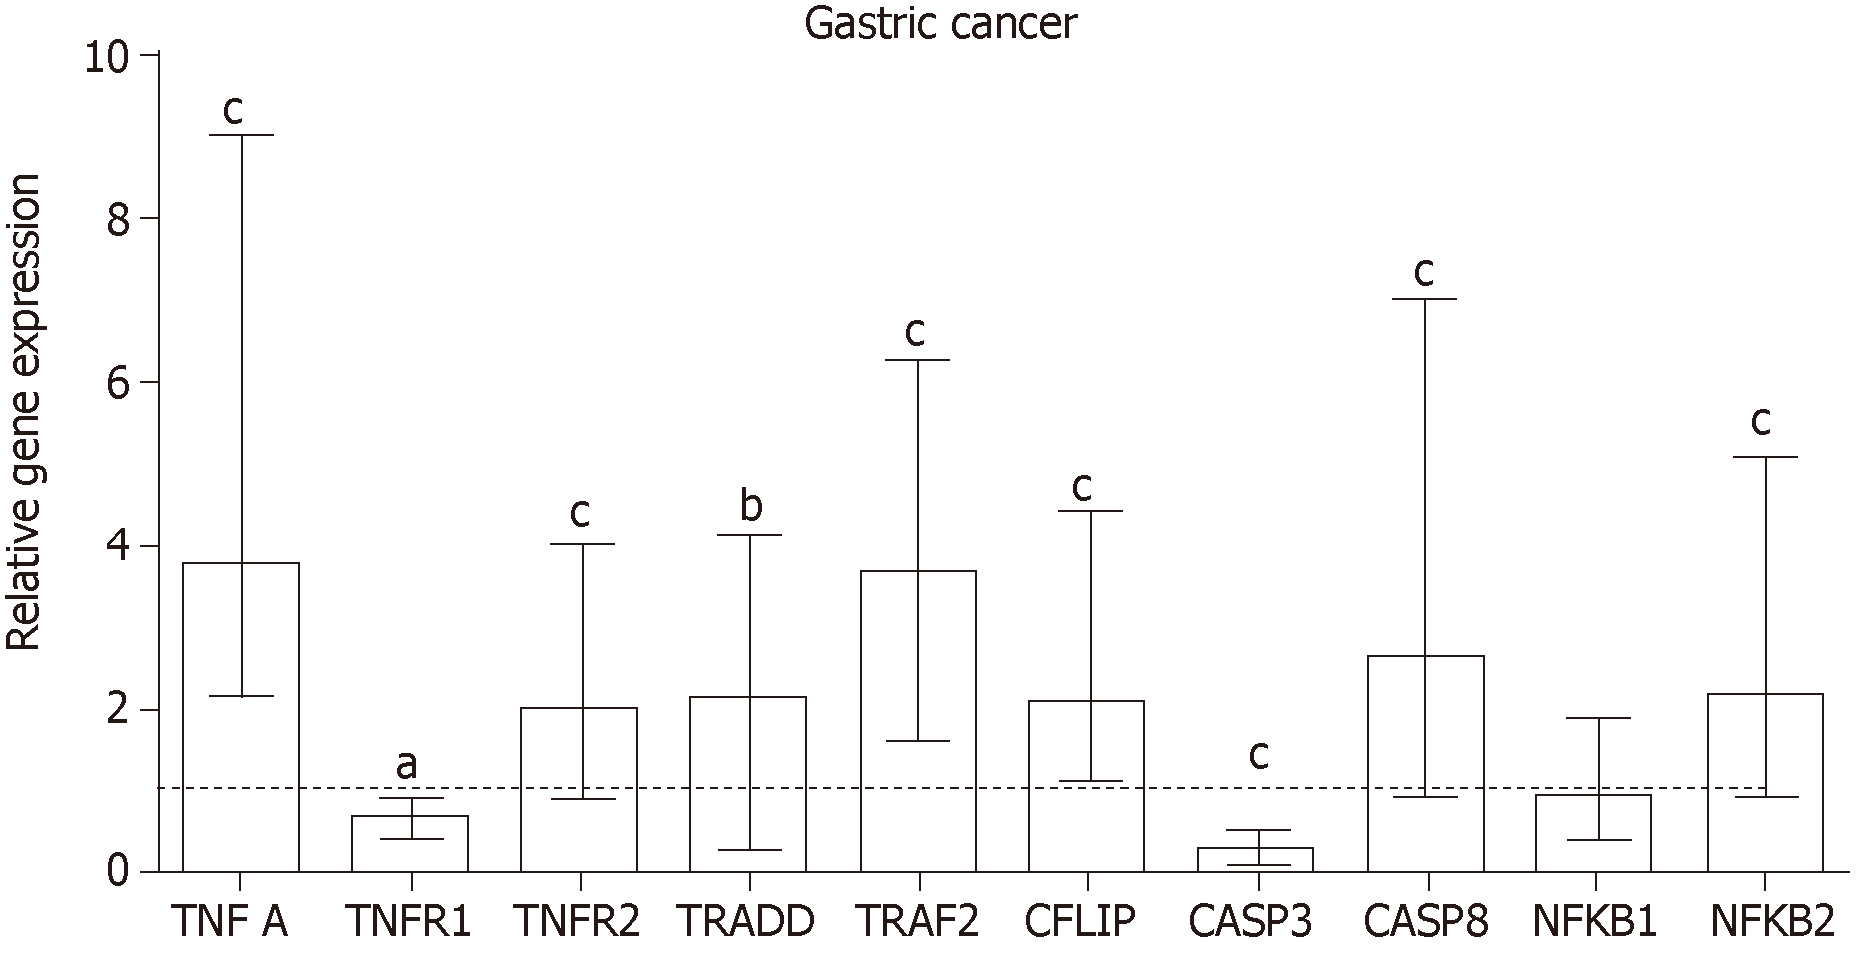
Figure 1 Relative expression of tumor necrosis factor-α pathway genes in gastric cancer.
Data are presented as the relative quantification (RQ) median with interquartile range. The line represents the RQ median of normal mucosa. Statistically significant difference, according to the Wilcoxon signed rank test: aP ≤ 0.05; bP ≤ 0.01; cP ≤ 0.001 in relation to normal mucosa and reference genes (ACTB and GAPDH).
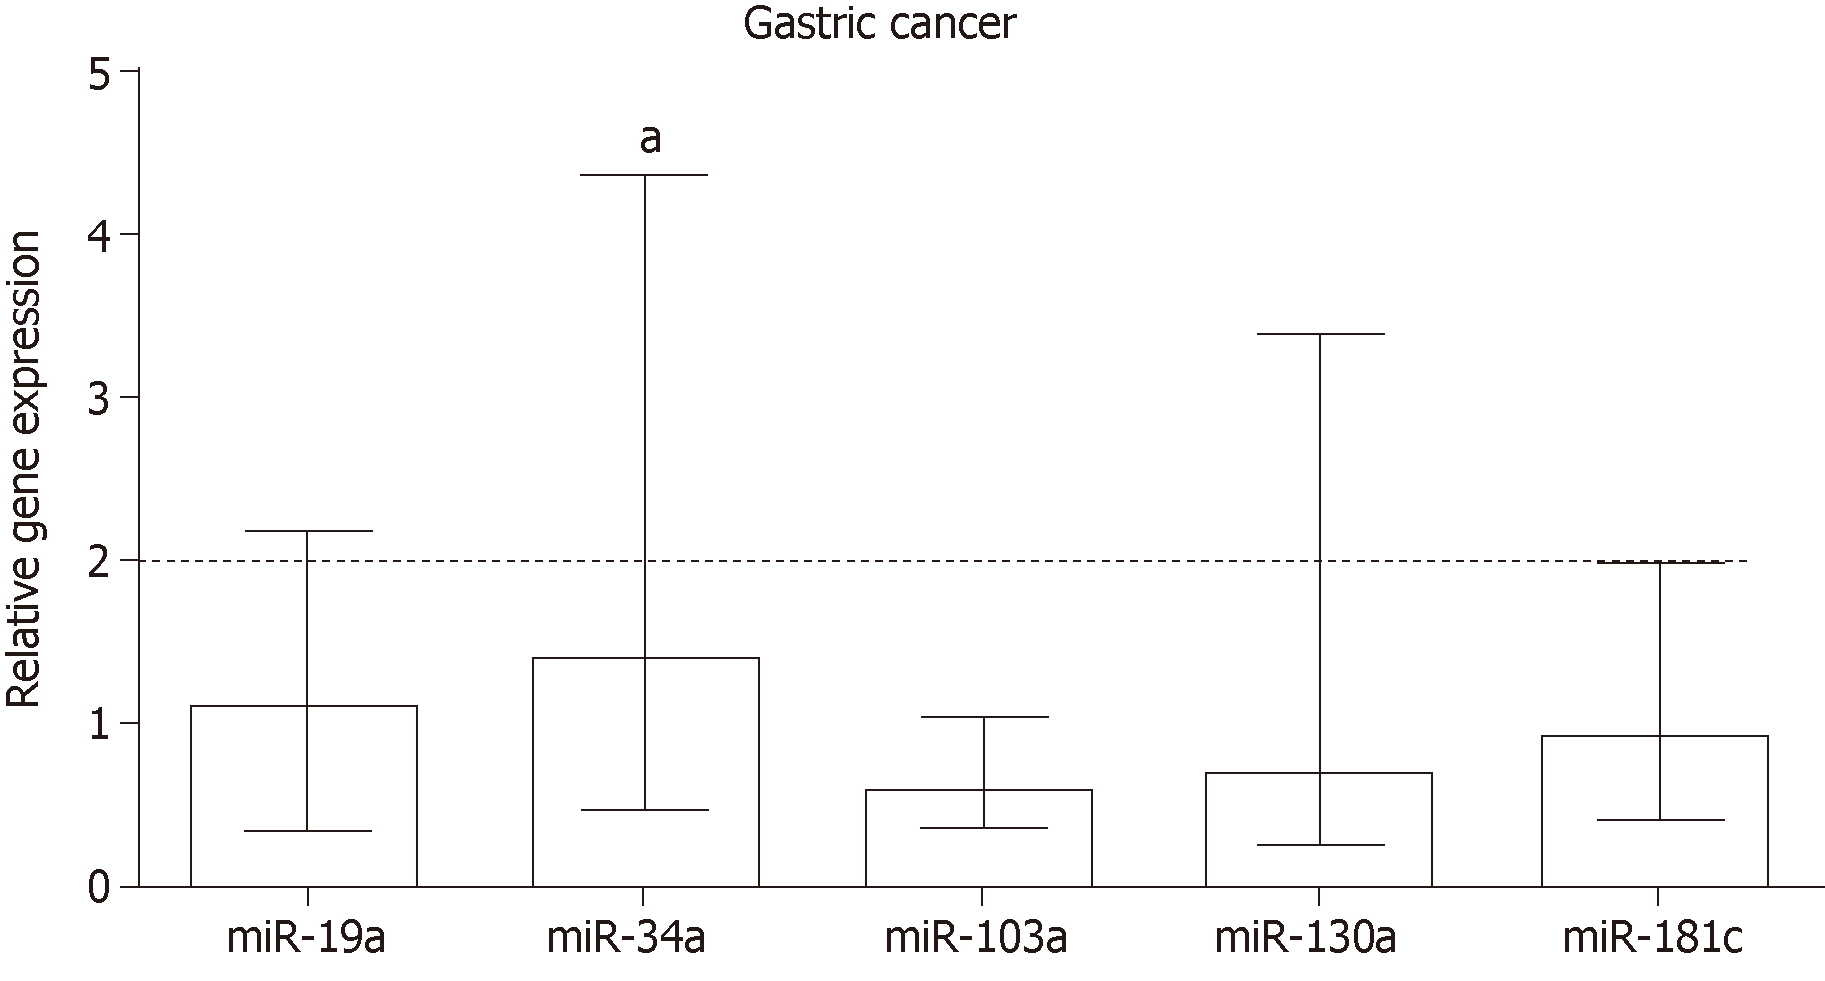
Figure 2 Relative expression of miRNAs miR-19a, miR-34a, miR-103a, miR-130a and miR-181c in gastric cancer.
Data are presented as the relative quantification (RQ) median with interquartile range. The line represents the RQ median of normal mucosa. Statistically significant difference, according to the Wilcoxon signed rank test: aP ≤ 0.05 in relation to normal mucosa and endogenous RNUs (RNU6B and RNU48).
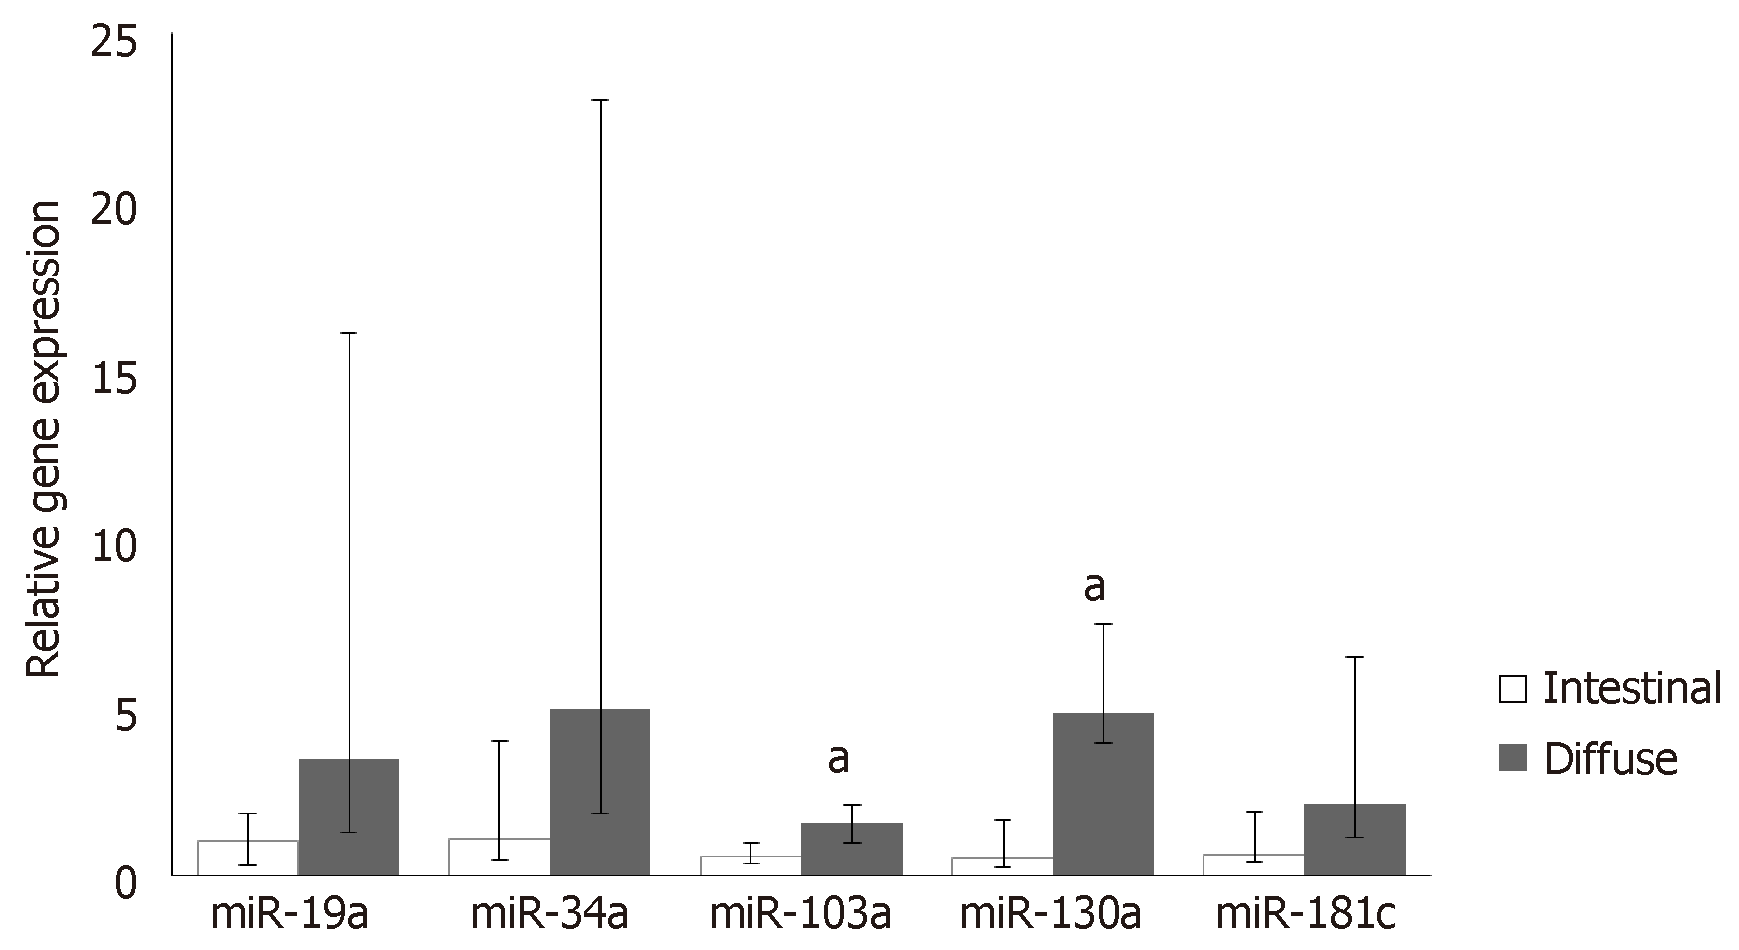
Figure 3 Relative expression of miRNAs miR-19a, miR-34a, miR-103a, miR-130a and miR-181c in intestinal and diffuse types of gastric cancer.
Data are presented as the relative quantification median with interquartile range. Statistically significant difference, according to the Mann-Whitney test: aP ≤ 0.05 comparing the histological types.
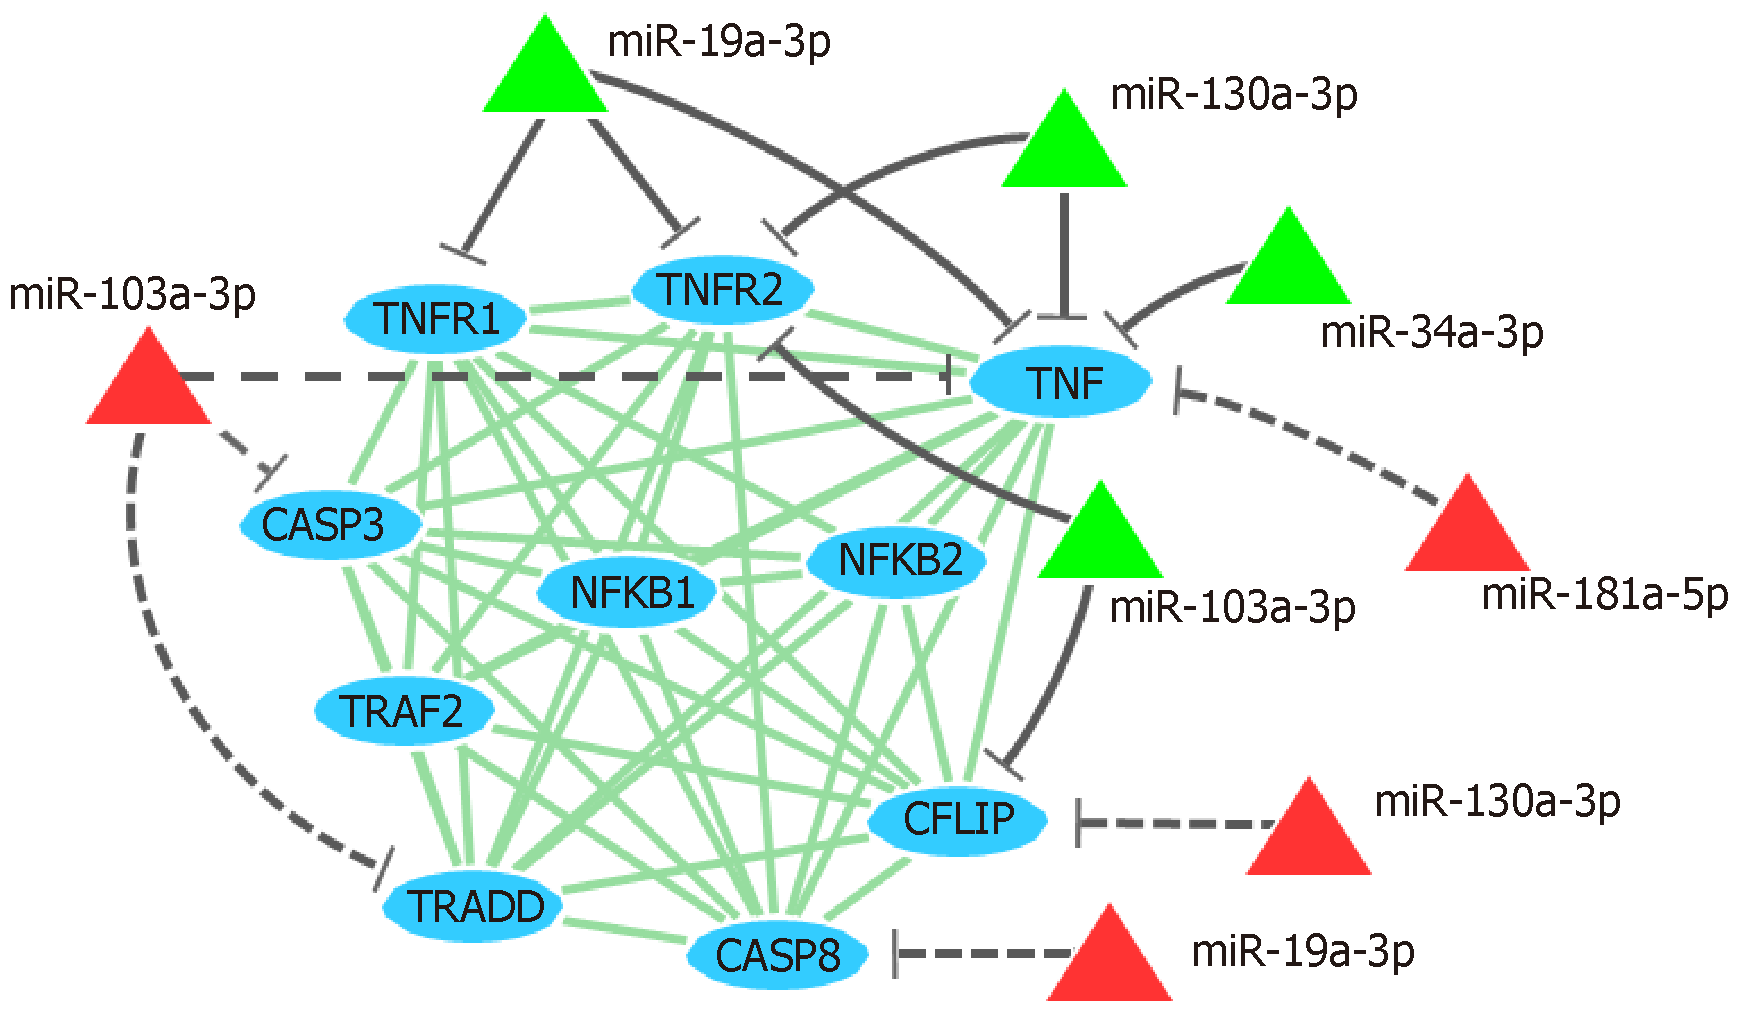
Figure 4 Interaction network showing miRNAs and their predicted and validated targets.
The protein interaction network (light gray lines) shows the interaction between proteins (ellipses) encoded by tumor necrosis factor- pathway genes. Green triangles and solid gray lines represent miRNAs and validated target genes, respectively; red triangles and dotted gray lines represent predicted relationship between miRNA and target genes, respectively. TNF: Tumor necrosis factor.
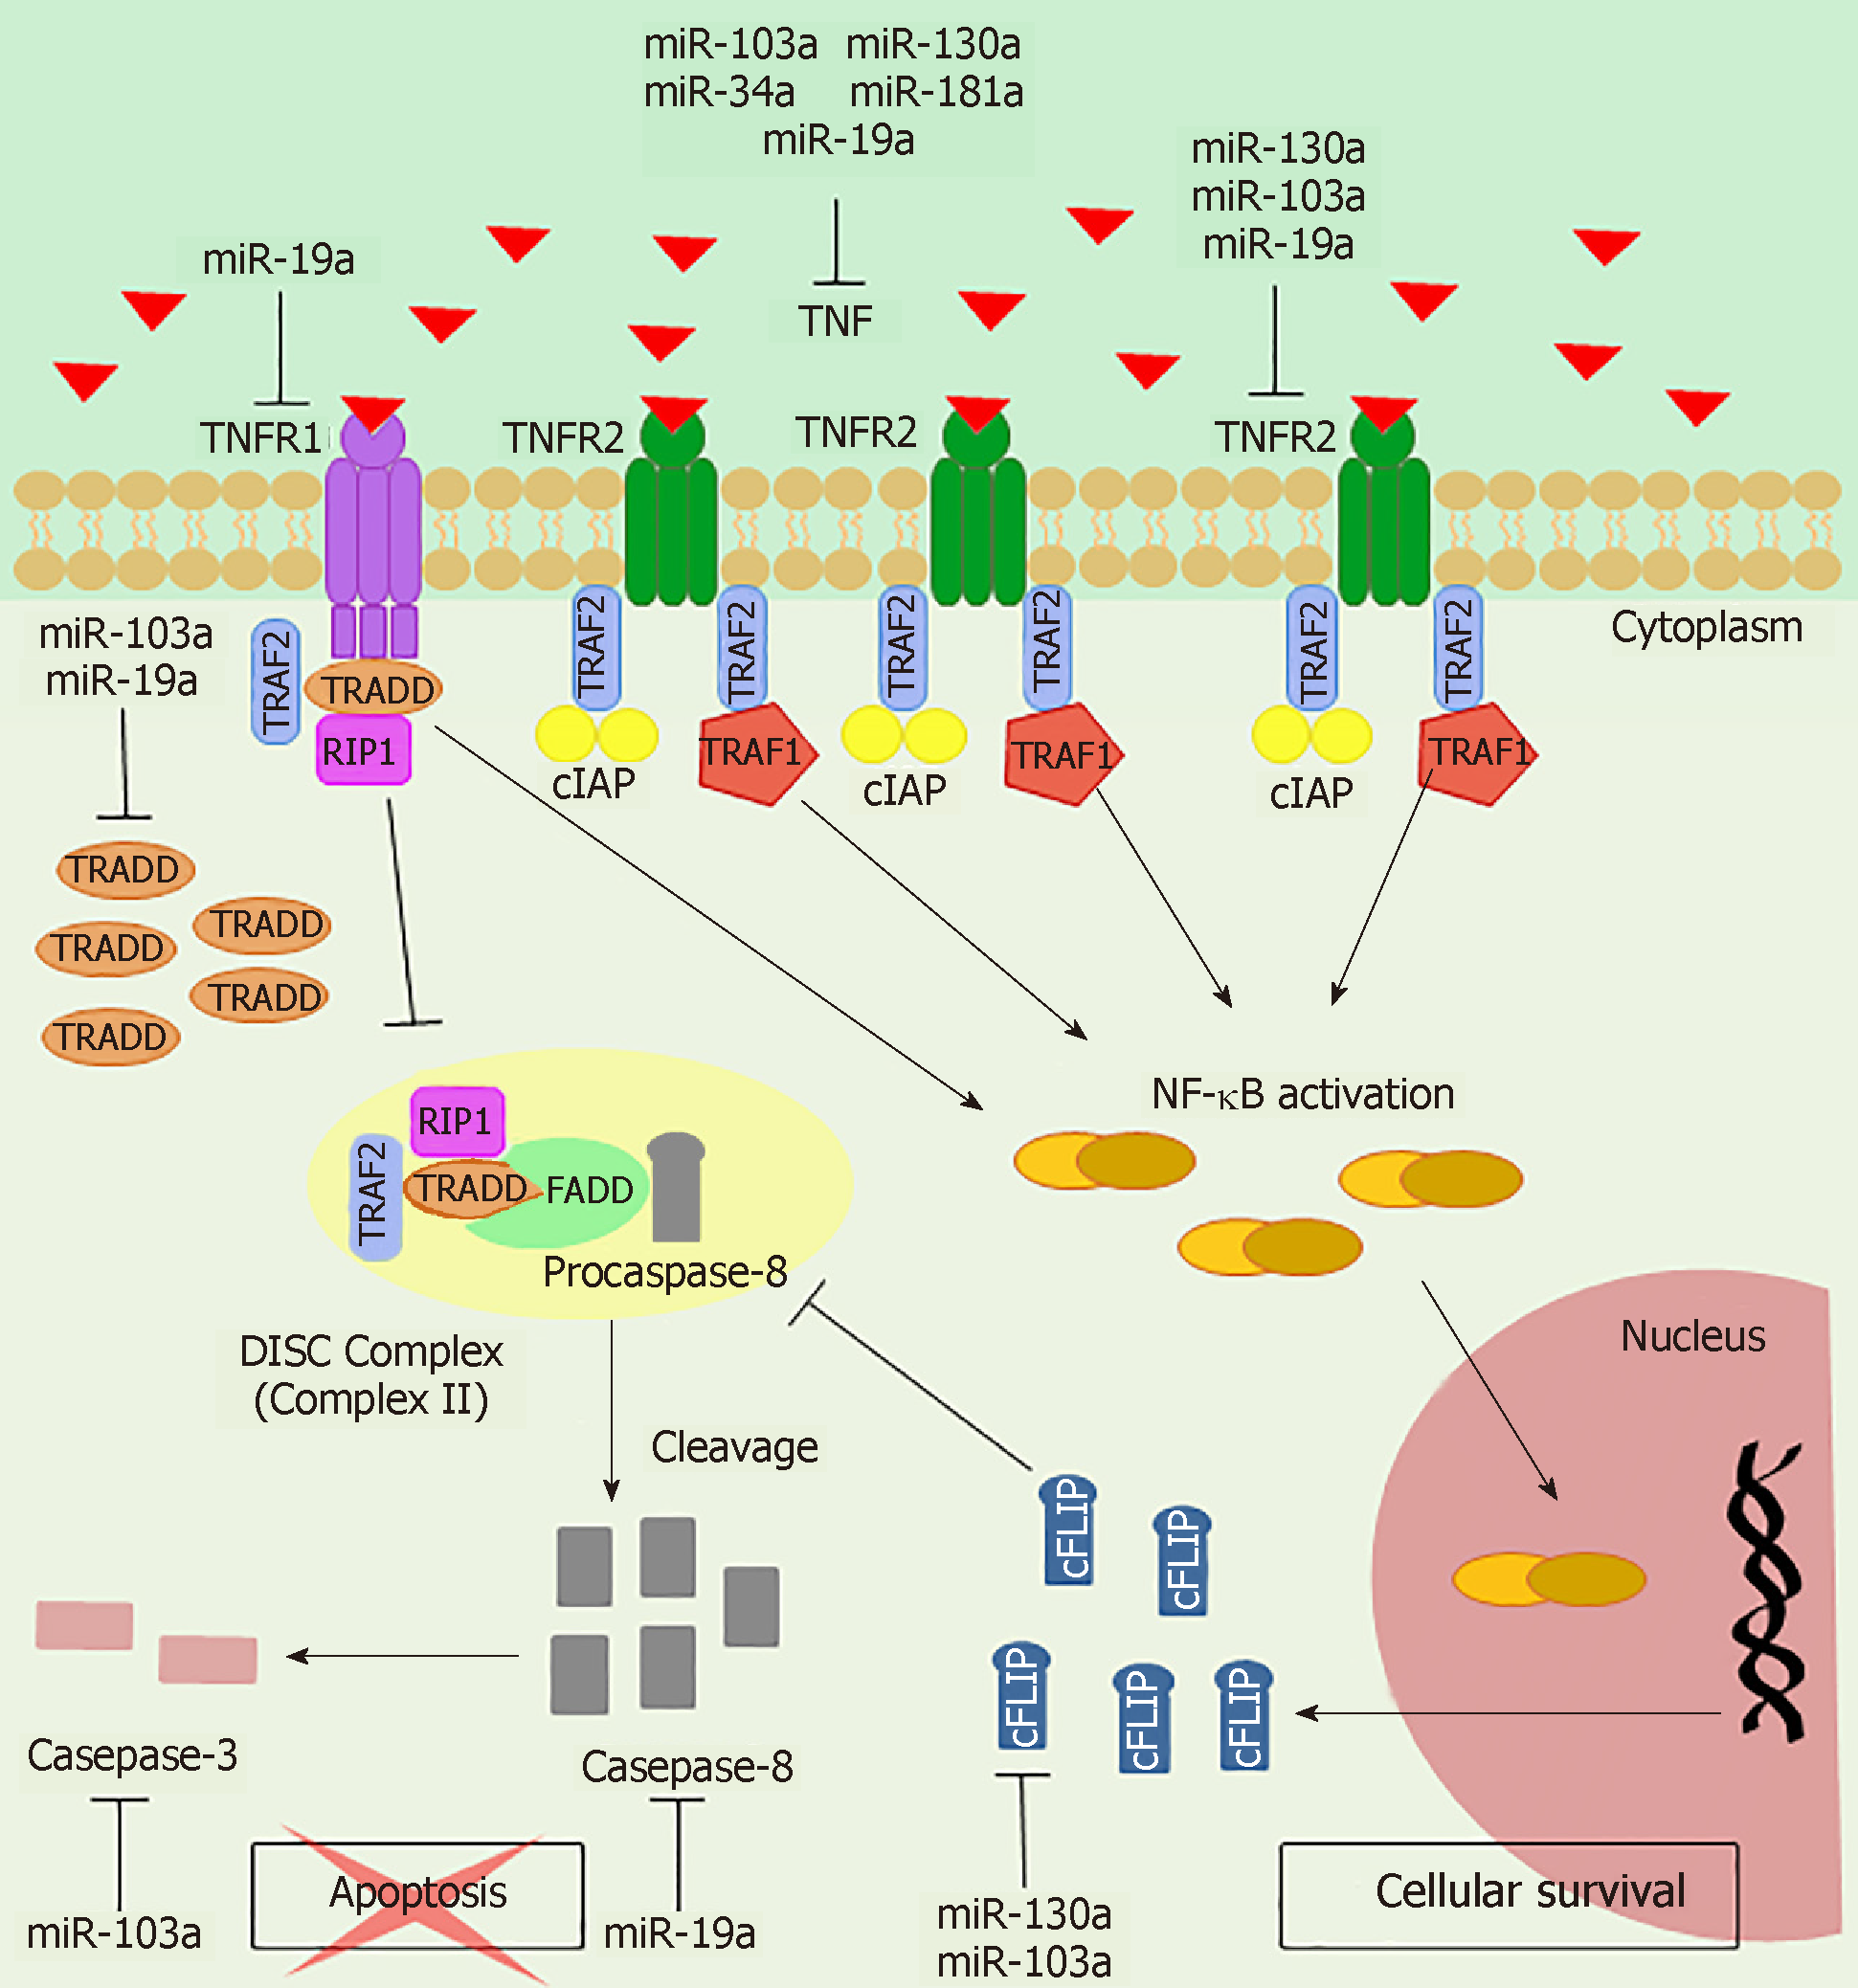
Figure 5 Tumor necrosis factor-α signaling in gastric cancer.
Up-regulation of TNFR2 and anti-apoptotic mediators results in predominance of cell survival pathway gene expression. After tumor necrosis factor (TNF)/TNFR2 interaction, TRAF2, TRAF1 and cellular inhibitor of apoptosis (cIAP) bind to the receptor, which results in NF-κB activation and consequent transcription of anti-apoptotic genes, such as cFLIP. Down-regulation of TNFR1 and CASP3 indicate impairment of the apoptotic pathway. Interaction of TRAF2 with TNFR1 through TRADD disturbs formation of the death-inducing signaling complex (DISC) or also called Complex II, which cleaves and activates caspase-8 and caspase-3. In addition, cFLIP induced by NF-κB inhibits activity of the DISC, rendering cells resistant to apoptosis. miRNAs regulate several genes of this pathway by interfering with cellular processes that contribute to gastric carcinogenesis.
- Citation: Rossi AFT, Contiero JC, Manoel-Caetano FDS, Severino FE, Silva AE. Up-regulation of tumor necrosis factor-α pathway survival genes and of the receptor TNFR2 in gastric cancer. World J Gastrointest Oncol 2019; 11(4): 281-294
- URL: https://www.wjgnet.com/1948-5204/full/v11/i4/281.htm
- DOI: https://dx.doi.org/10.4251/wjgo.v11.i4.281


