Copyright
©The Author(s) 2019.
World J Gastrointest Oncol. Oct 15, 2019; 11(10): 909-924
Published online Oct 15, 2019. doi: 10.4251/wjgo.v11.i10.909
Published online Oct 15, 2019. doi: 10.4251/wjgo.v11.i10.909
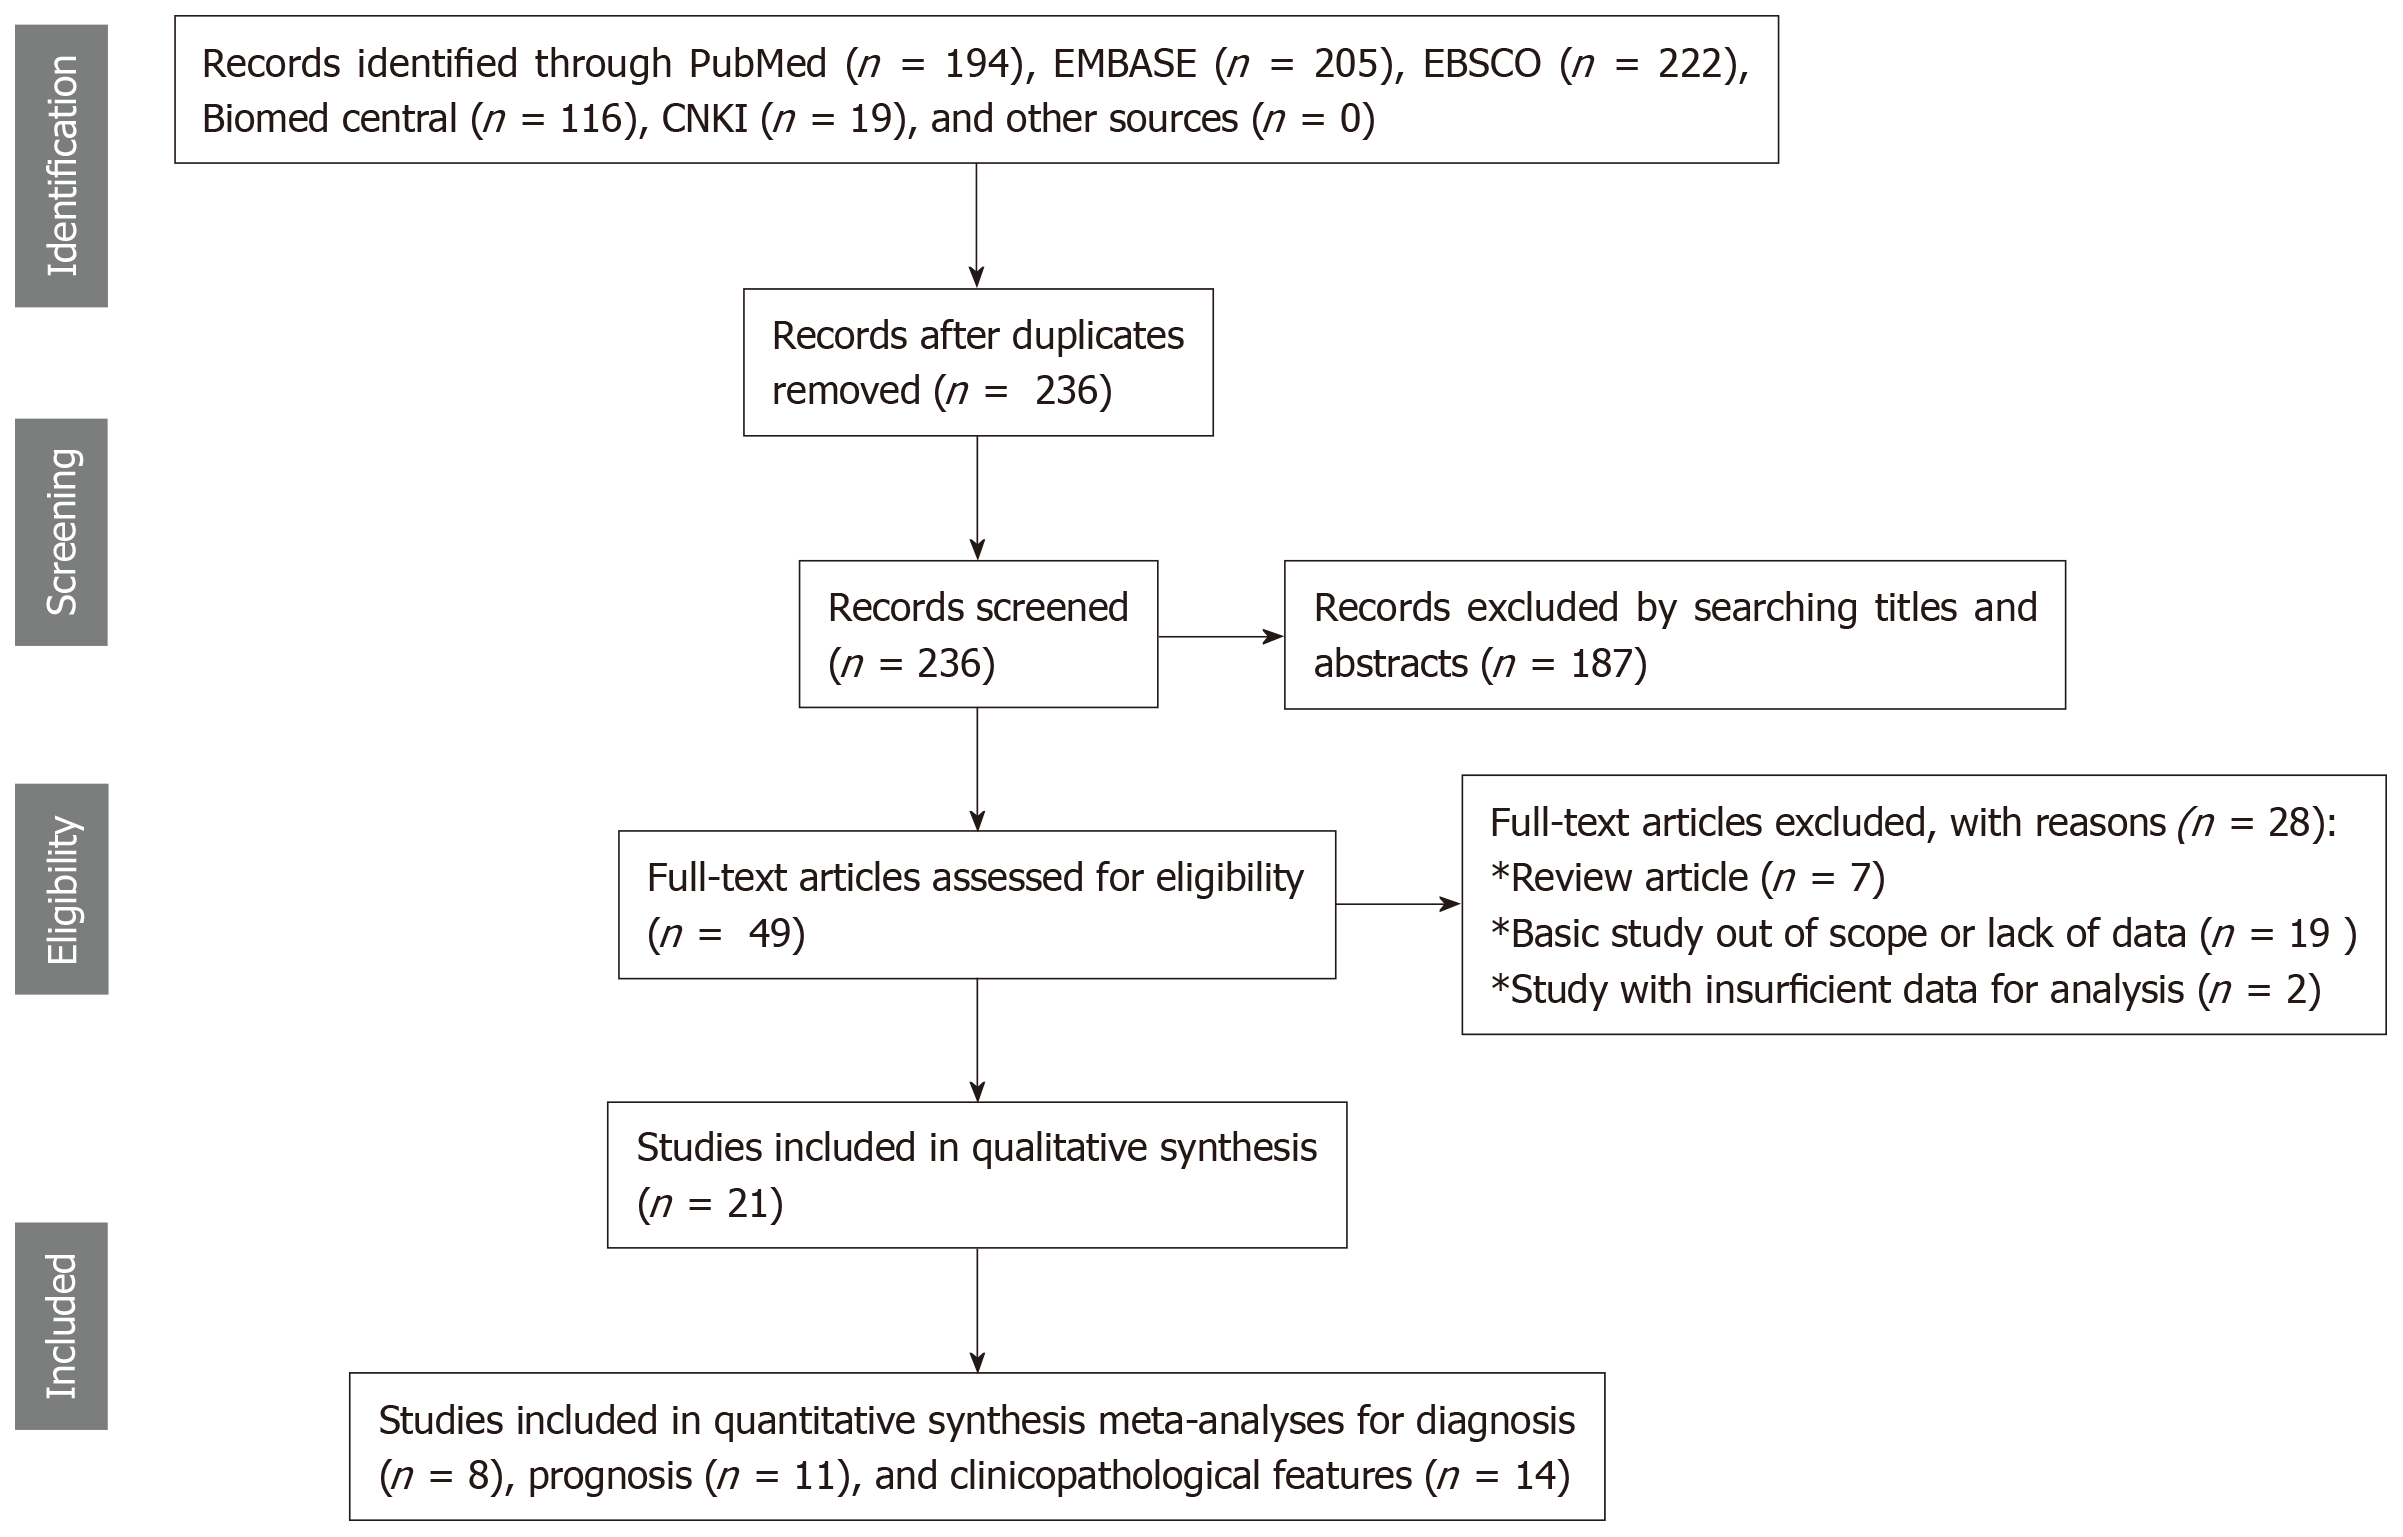
Figure 1 Study flow diagram for the diagnostic and prognostic meta-analyses.
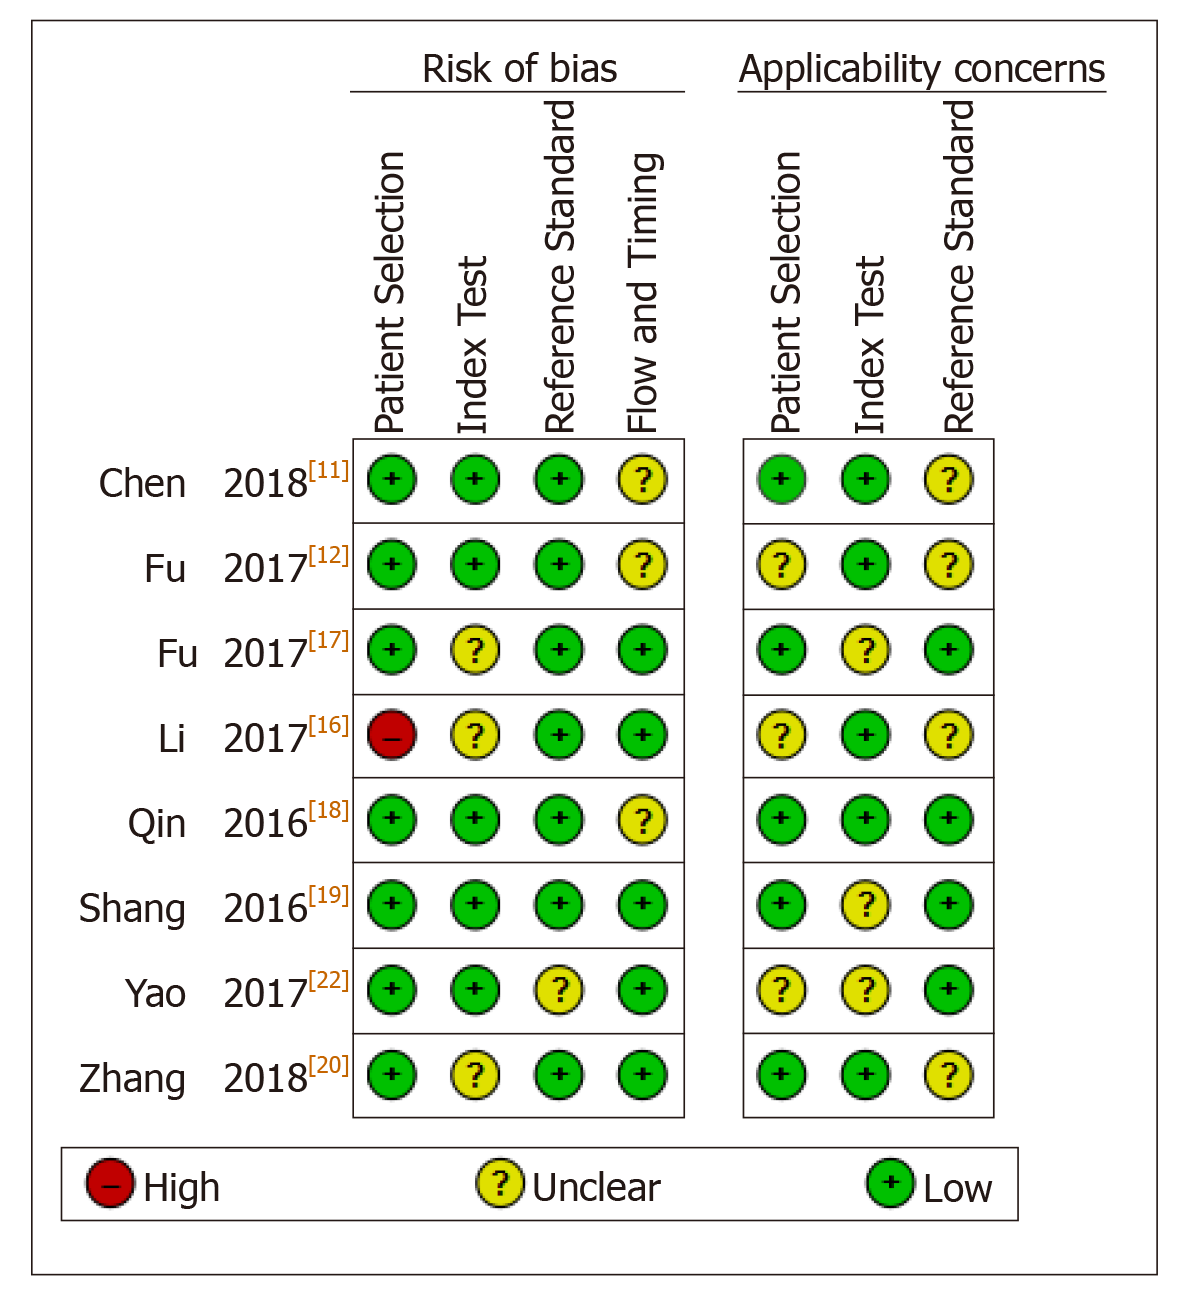
Figure 2 Study quality regarding the risk of bias and applicability concerns as assessed by the QUADAS II tool.
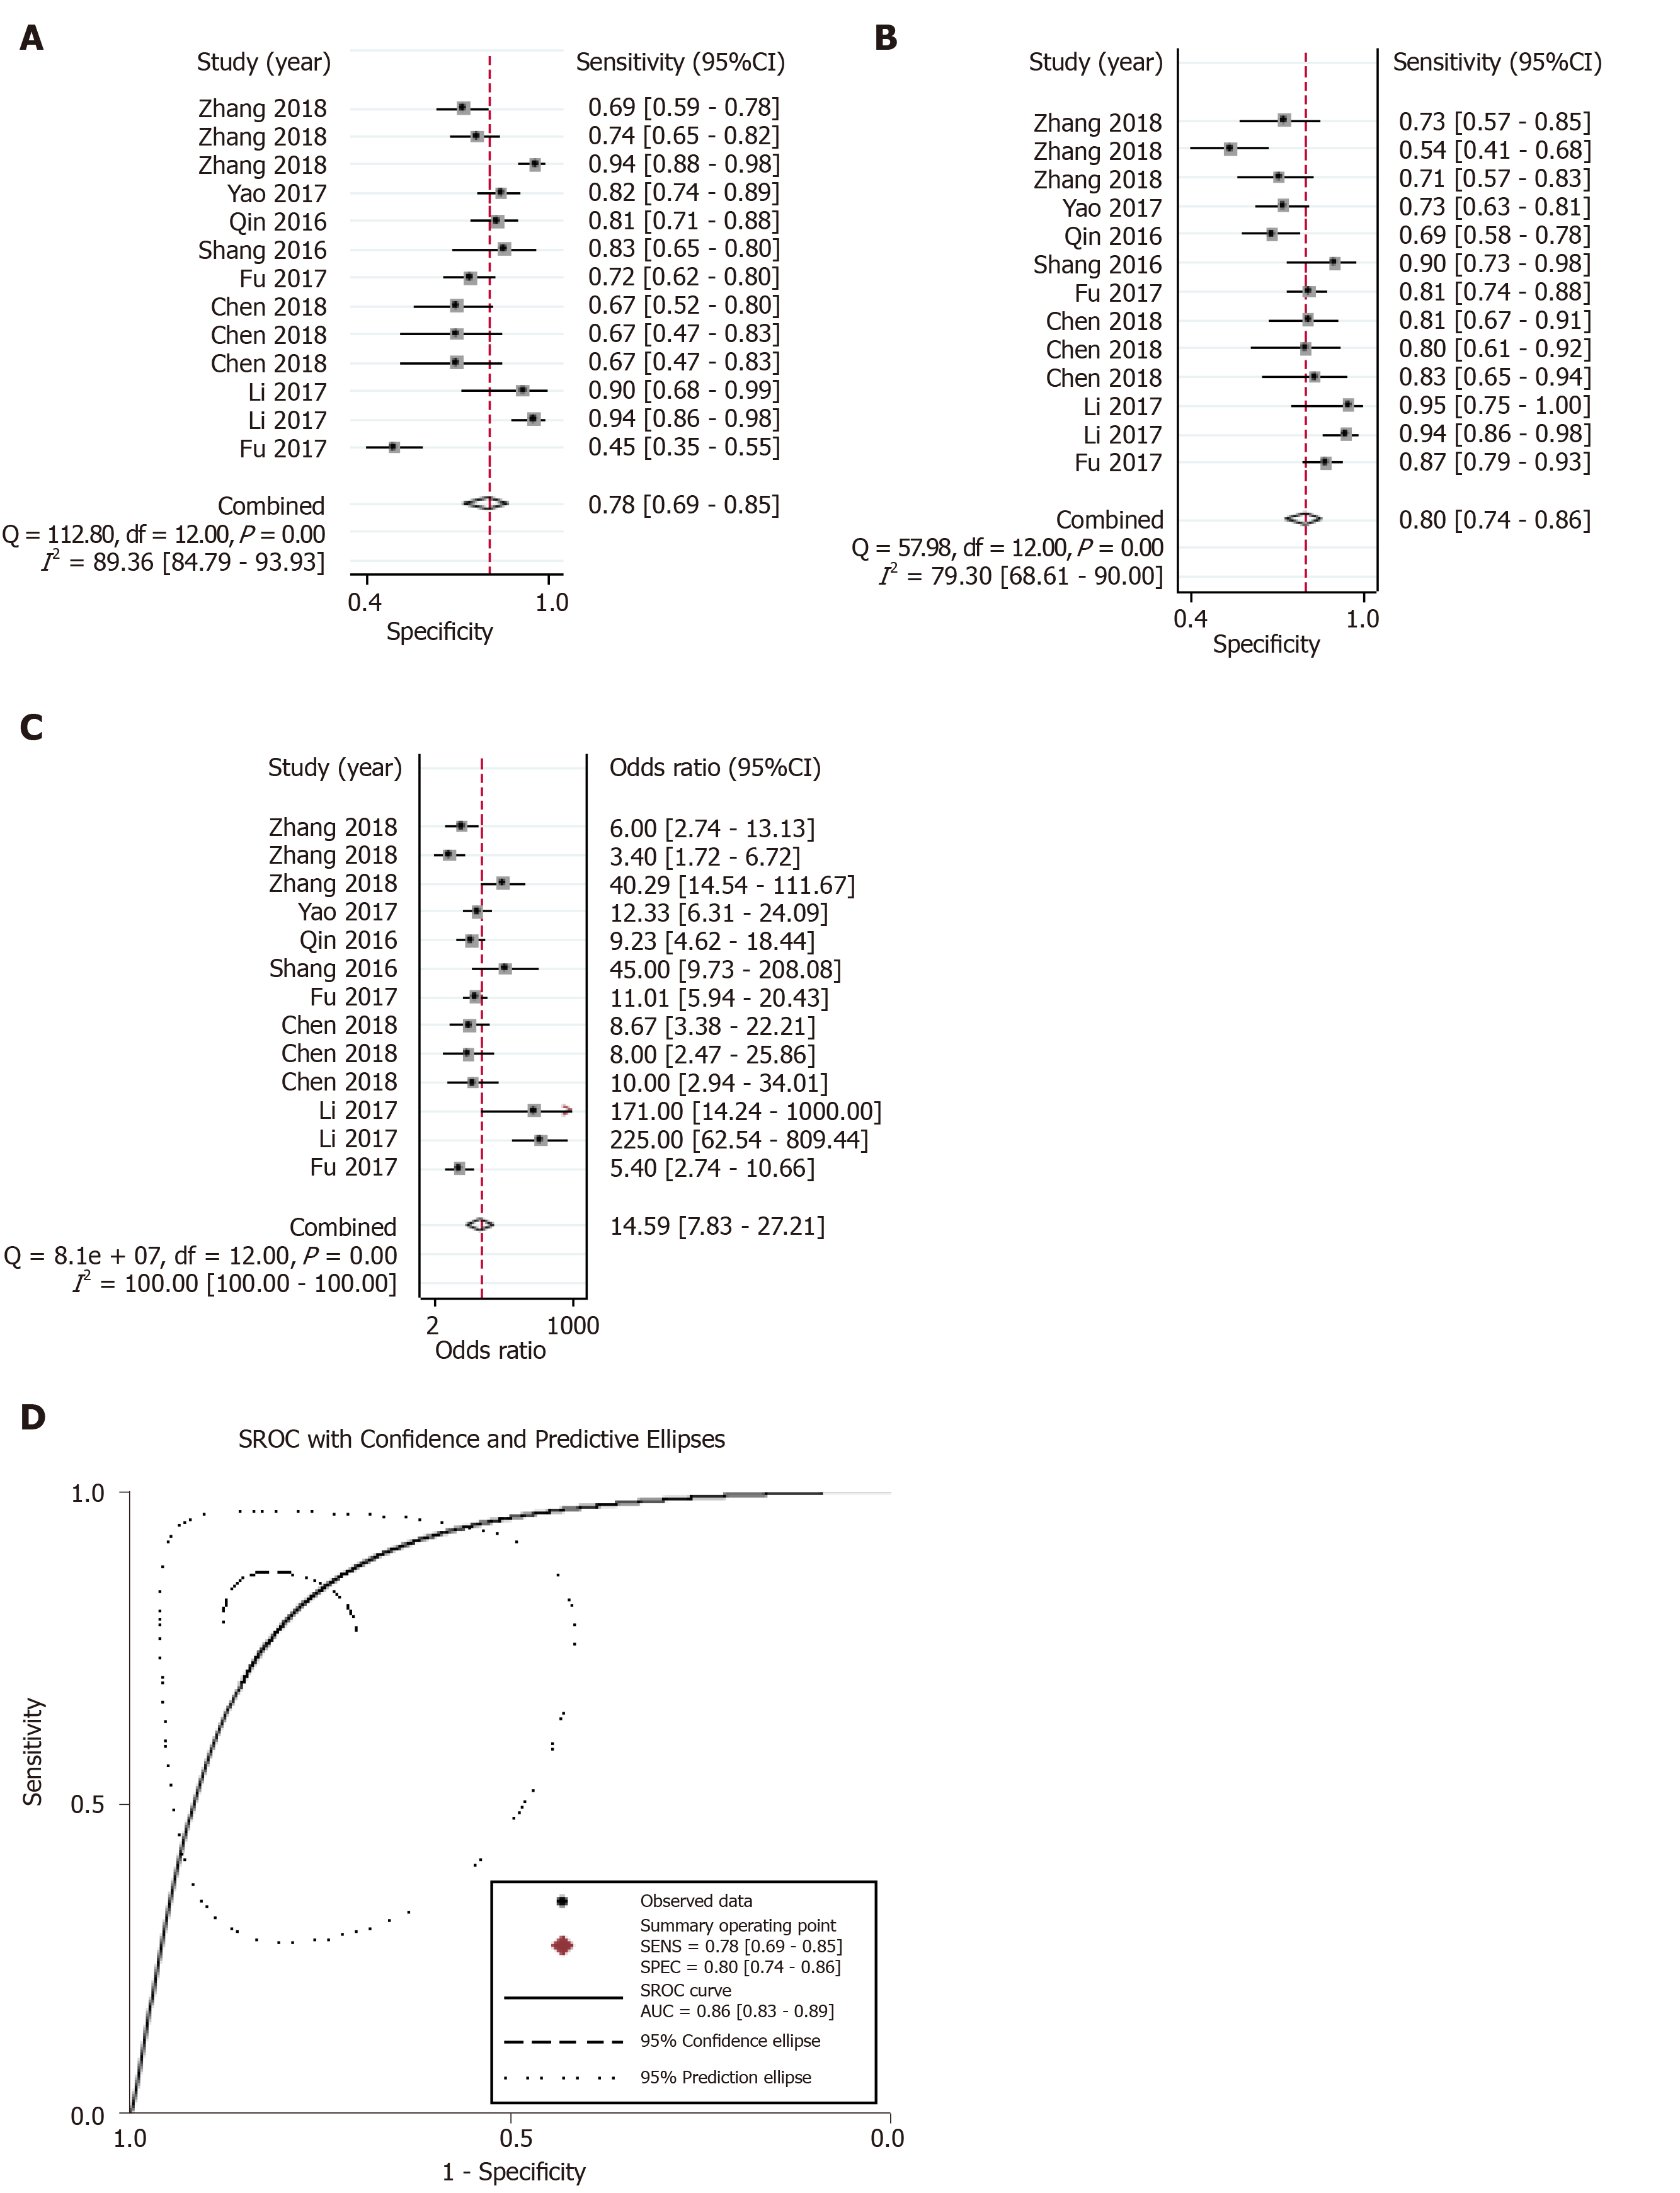
Figure 3 Overall diagnostic performance.
A-D: Forest plots of the combined (A) sensitivity, (B) specificity, (C) diagnostic odds ratio, and (D) area under the curves among the eight diagnostic studies.
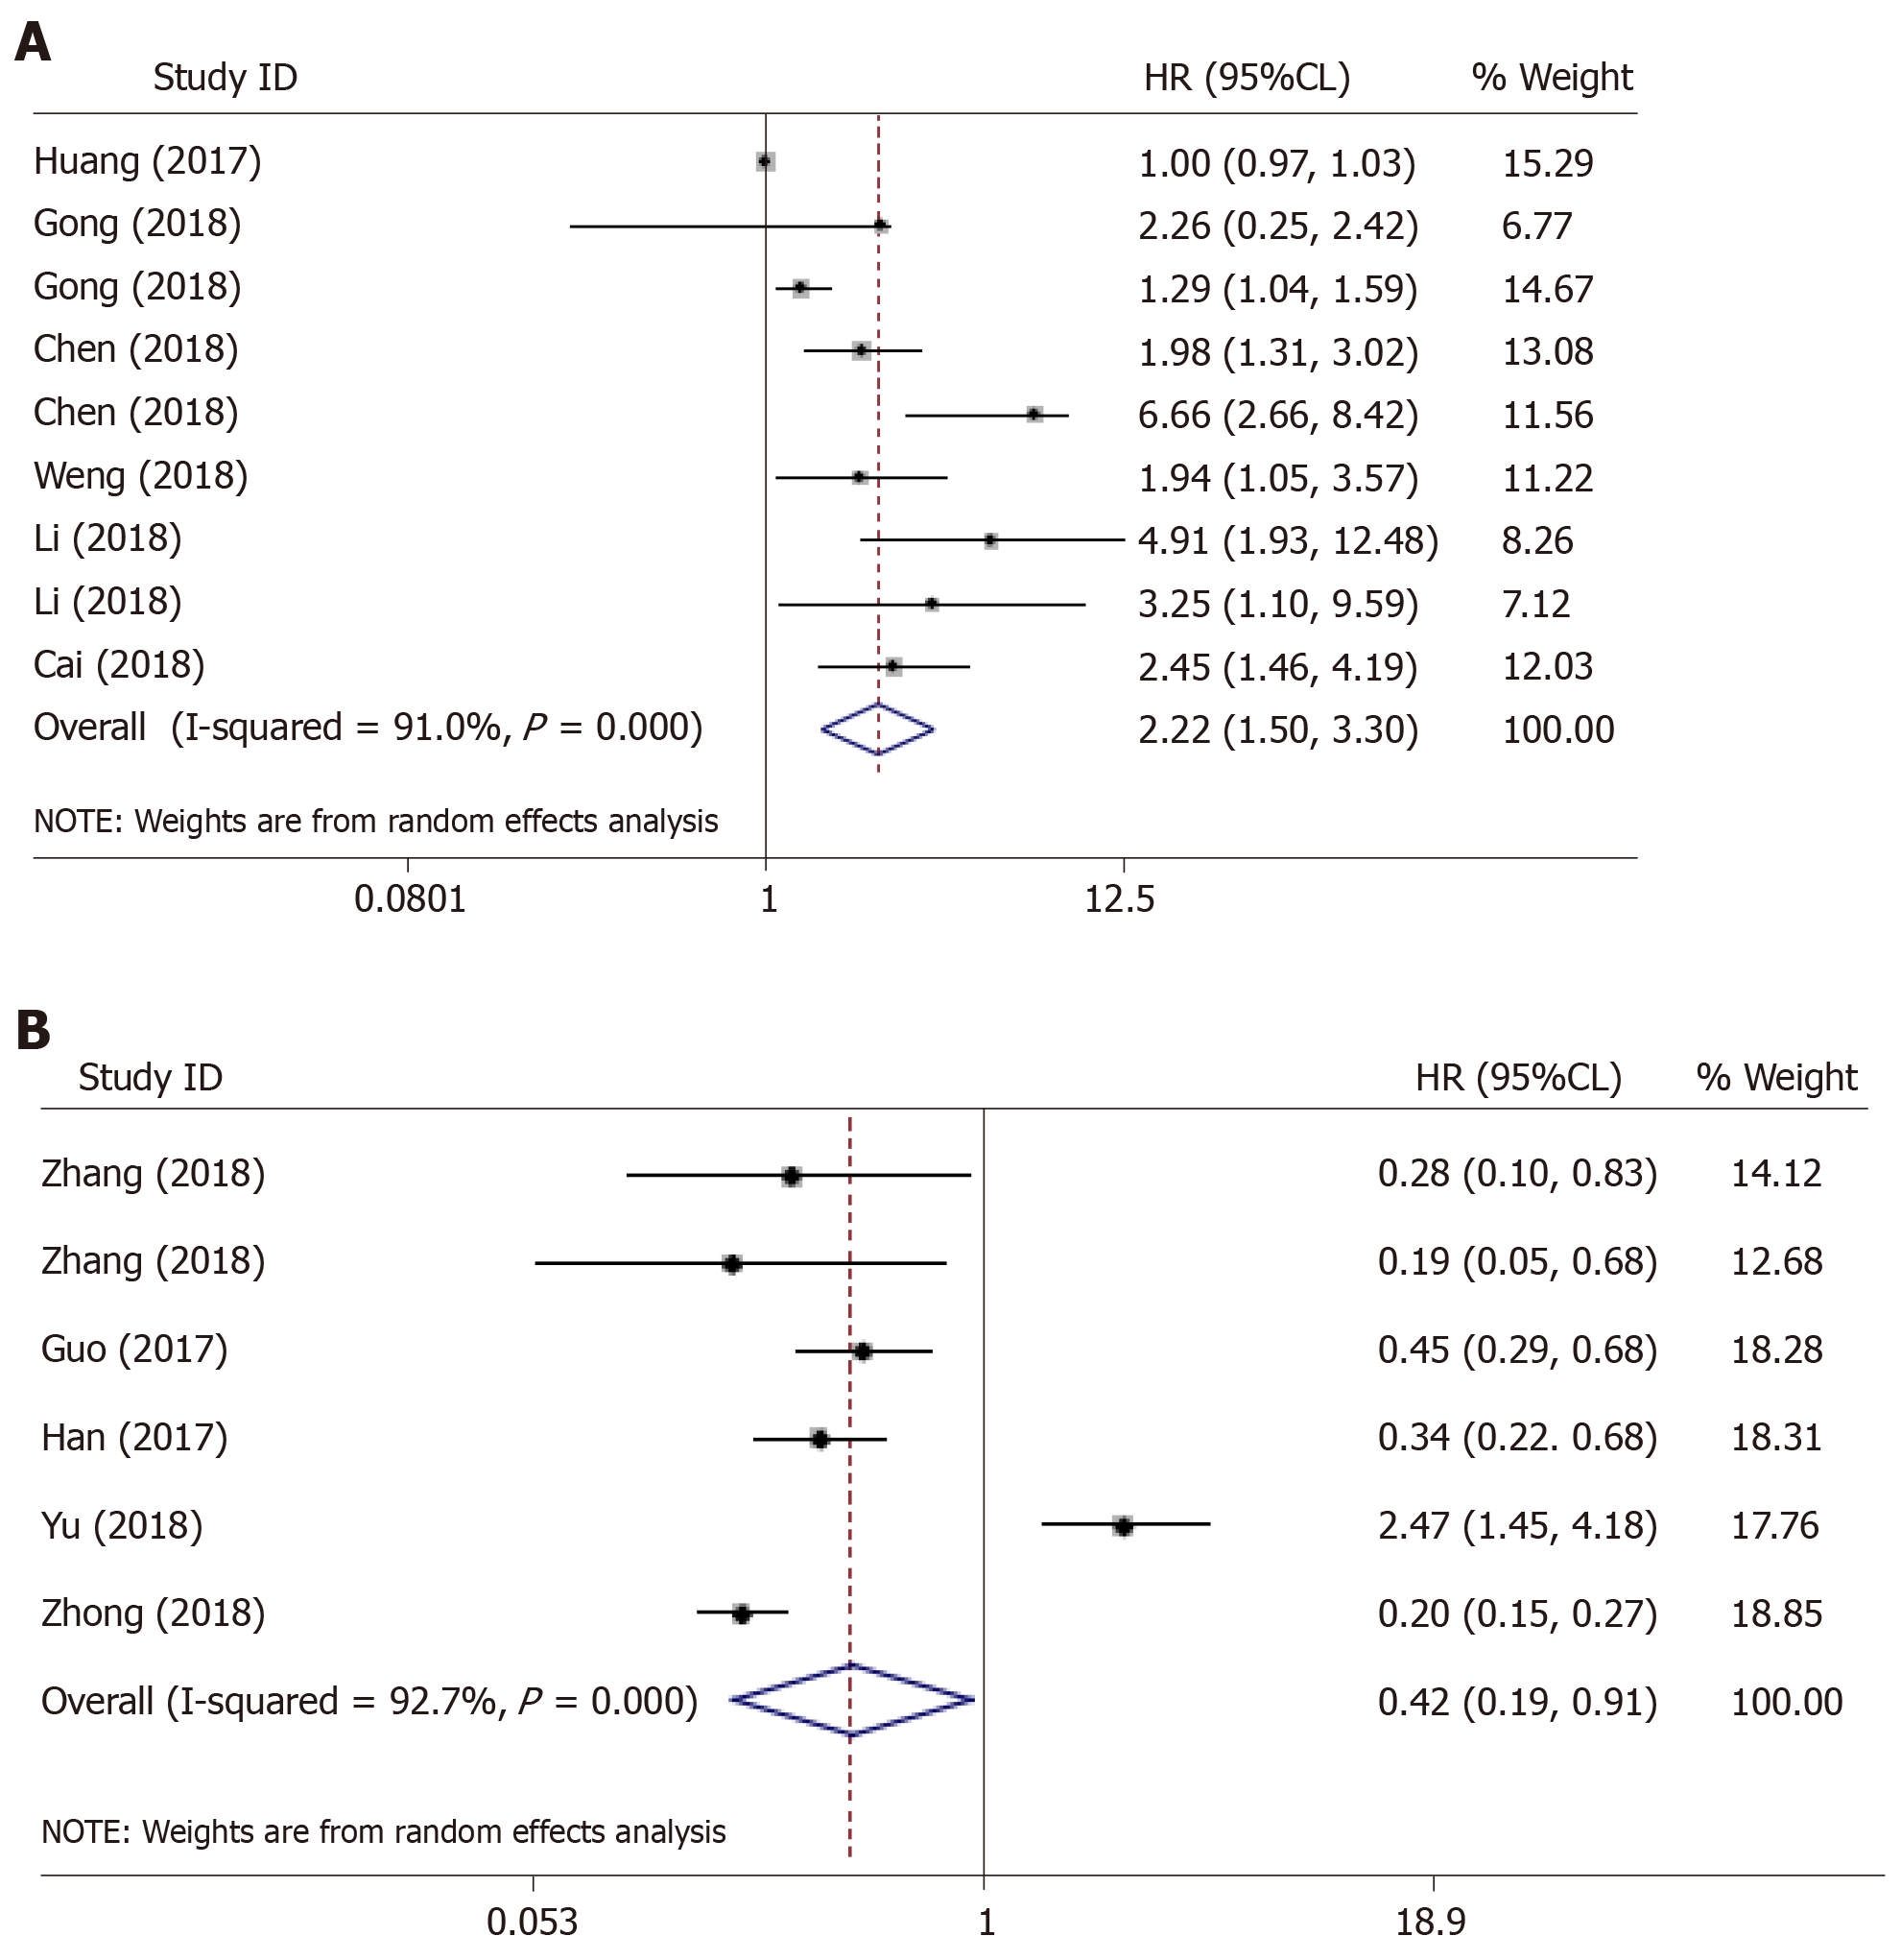
Figure 4 The outlier in the pooled prognostic effects of down-regulated circular RNAs in hepatocellular carcinoma.
A and B: Forest plots of the combined hazard ratios with 95% confidence intervals for the (A) up-regulated and (B) down-regulated circular RNA profiles in predicting the overall survival of hepatocellular carcinoma patients.
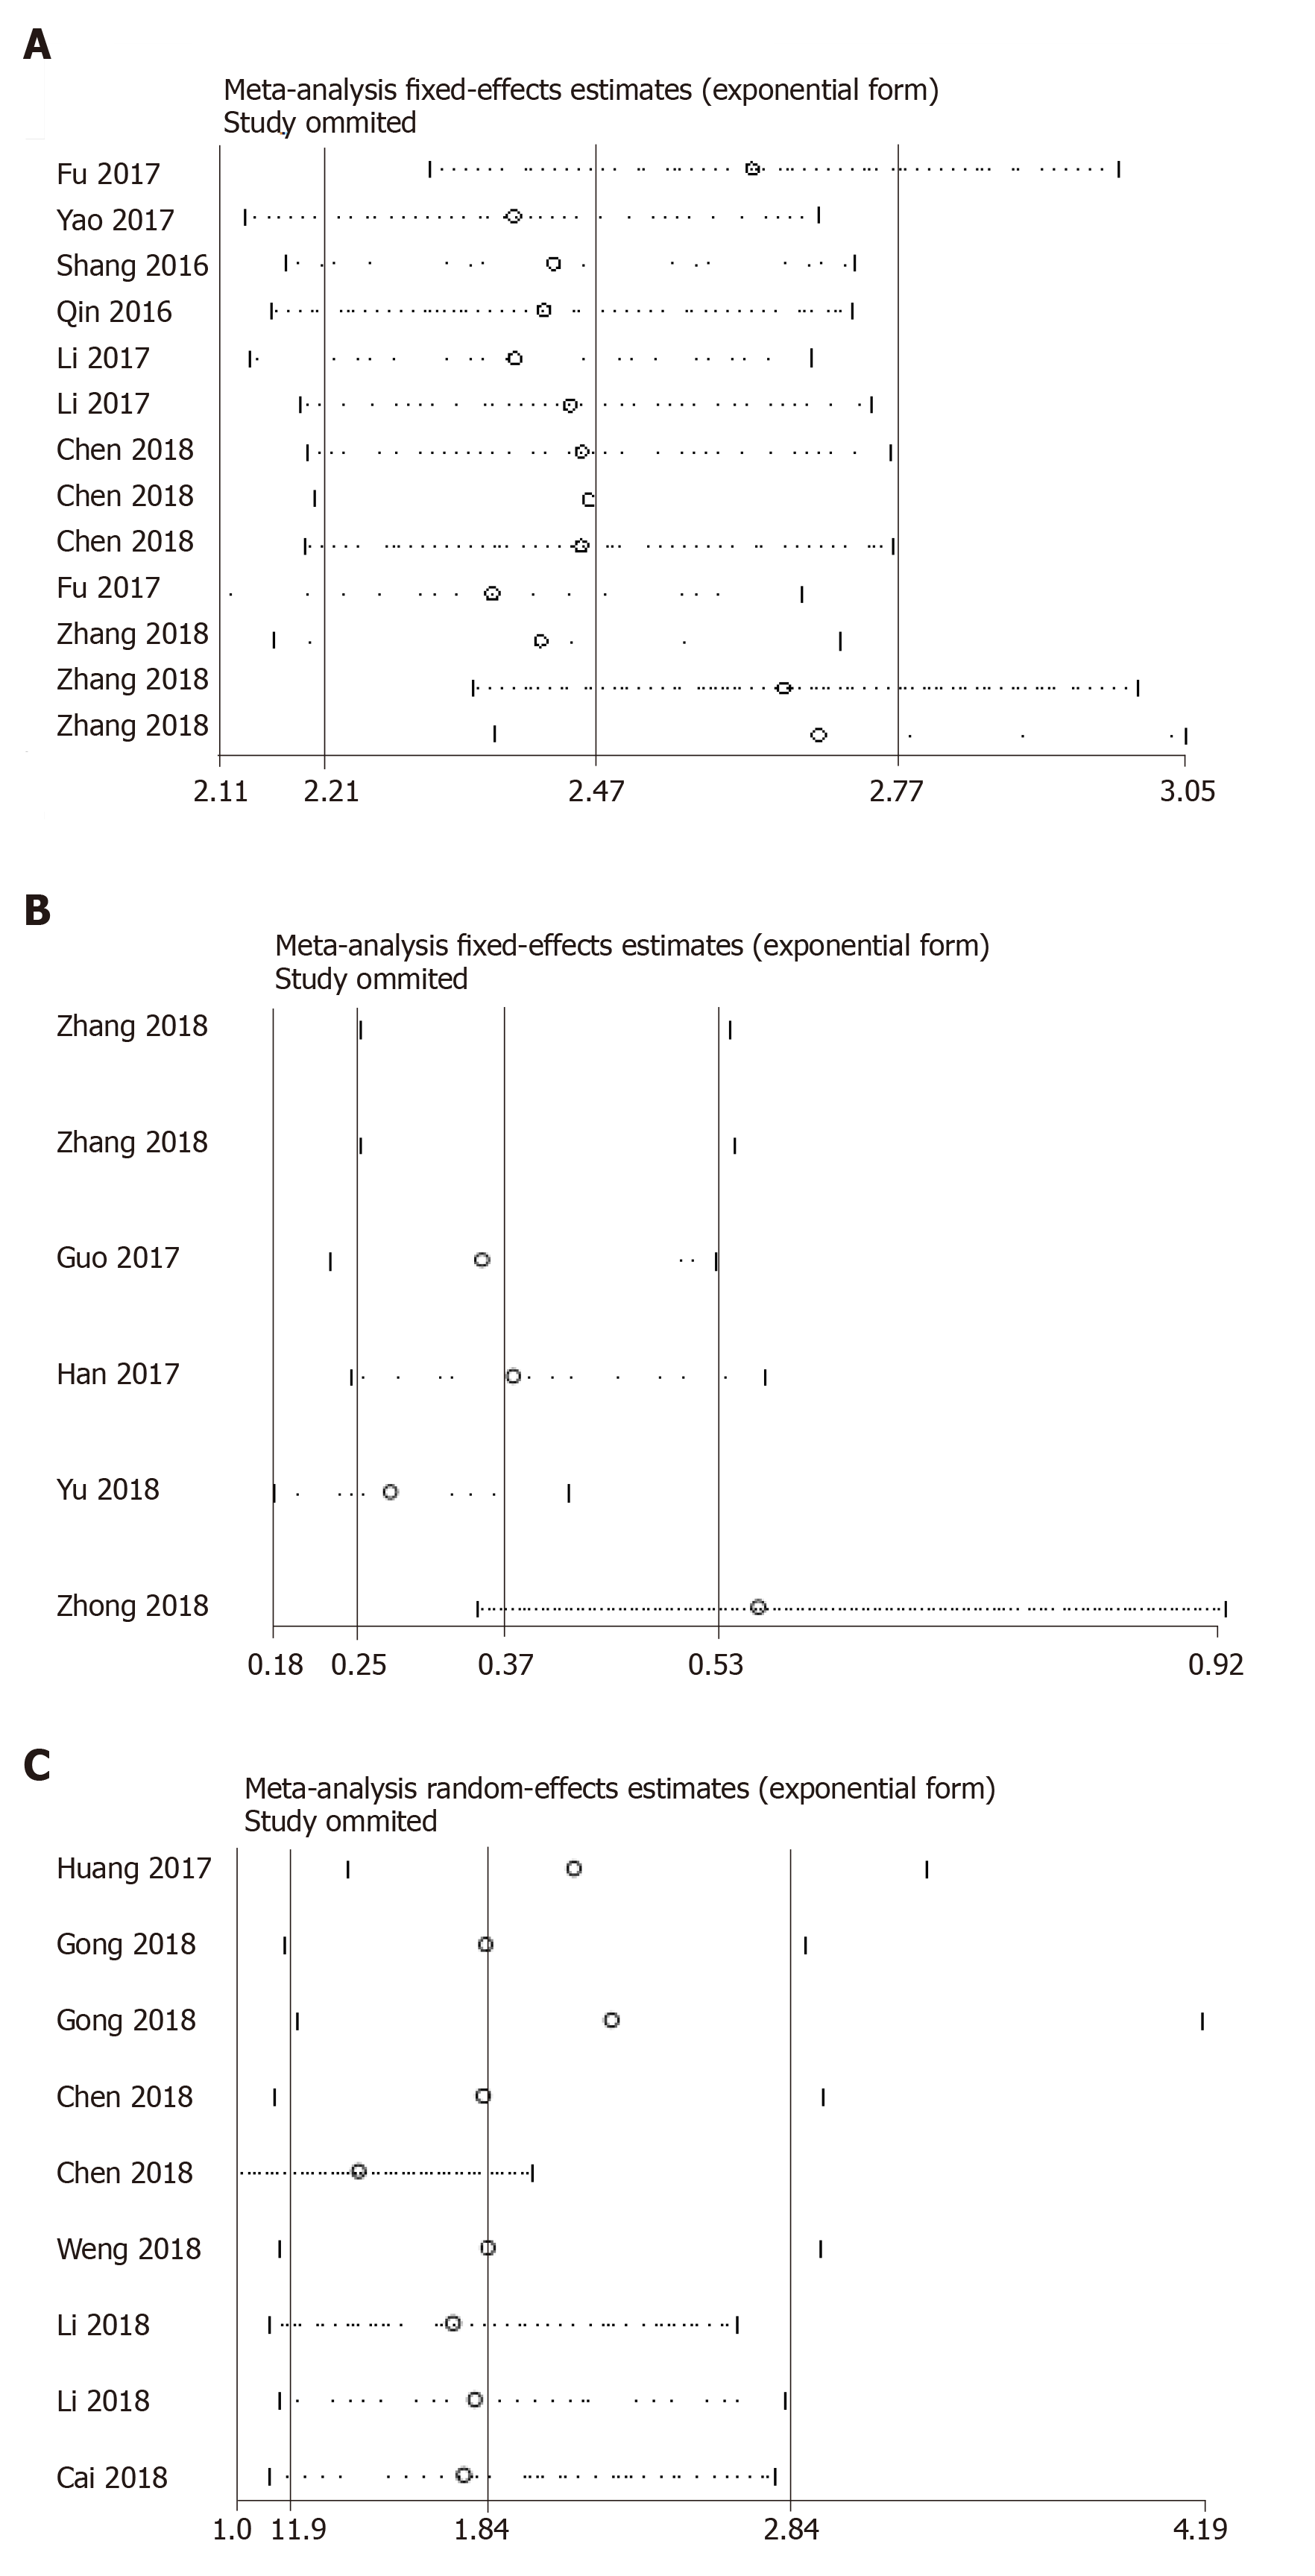
Figure 5 Sensitivity analysis of the outlier data.
A: Diagnostic studies; B: Down-regulated; and C: Up-regulated circular RNA profiles in predicting the overall survival in hepatocellular carcinoma.
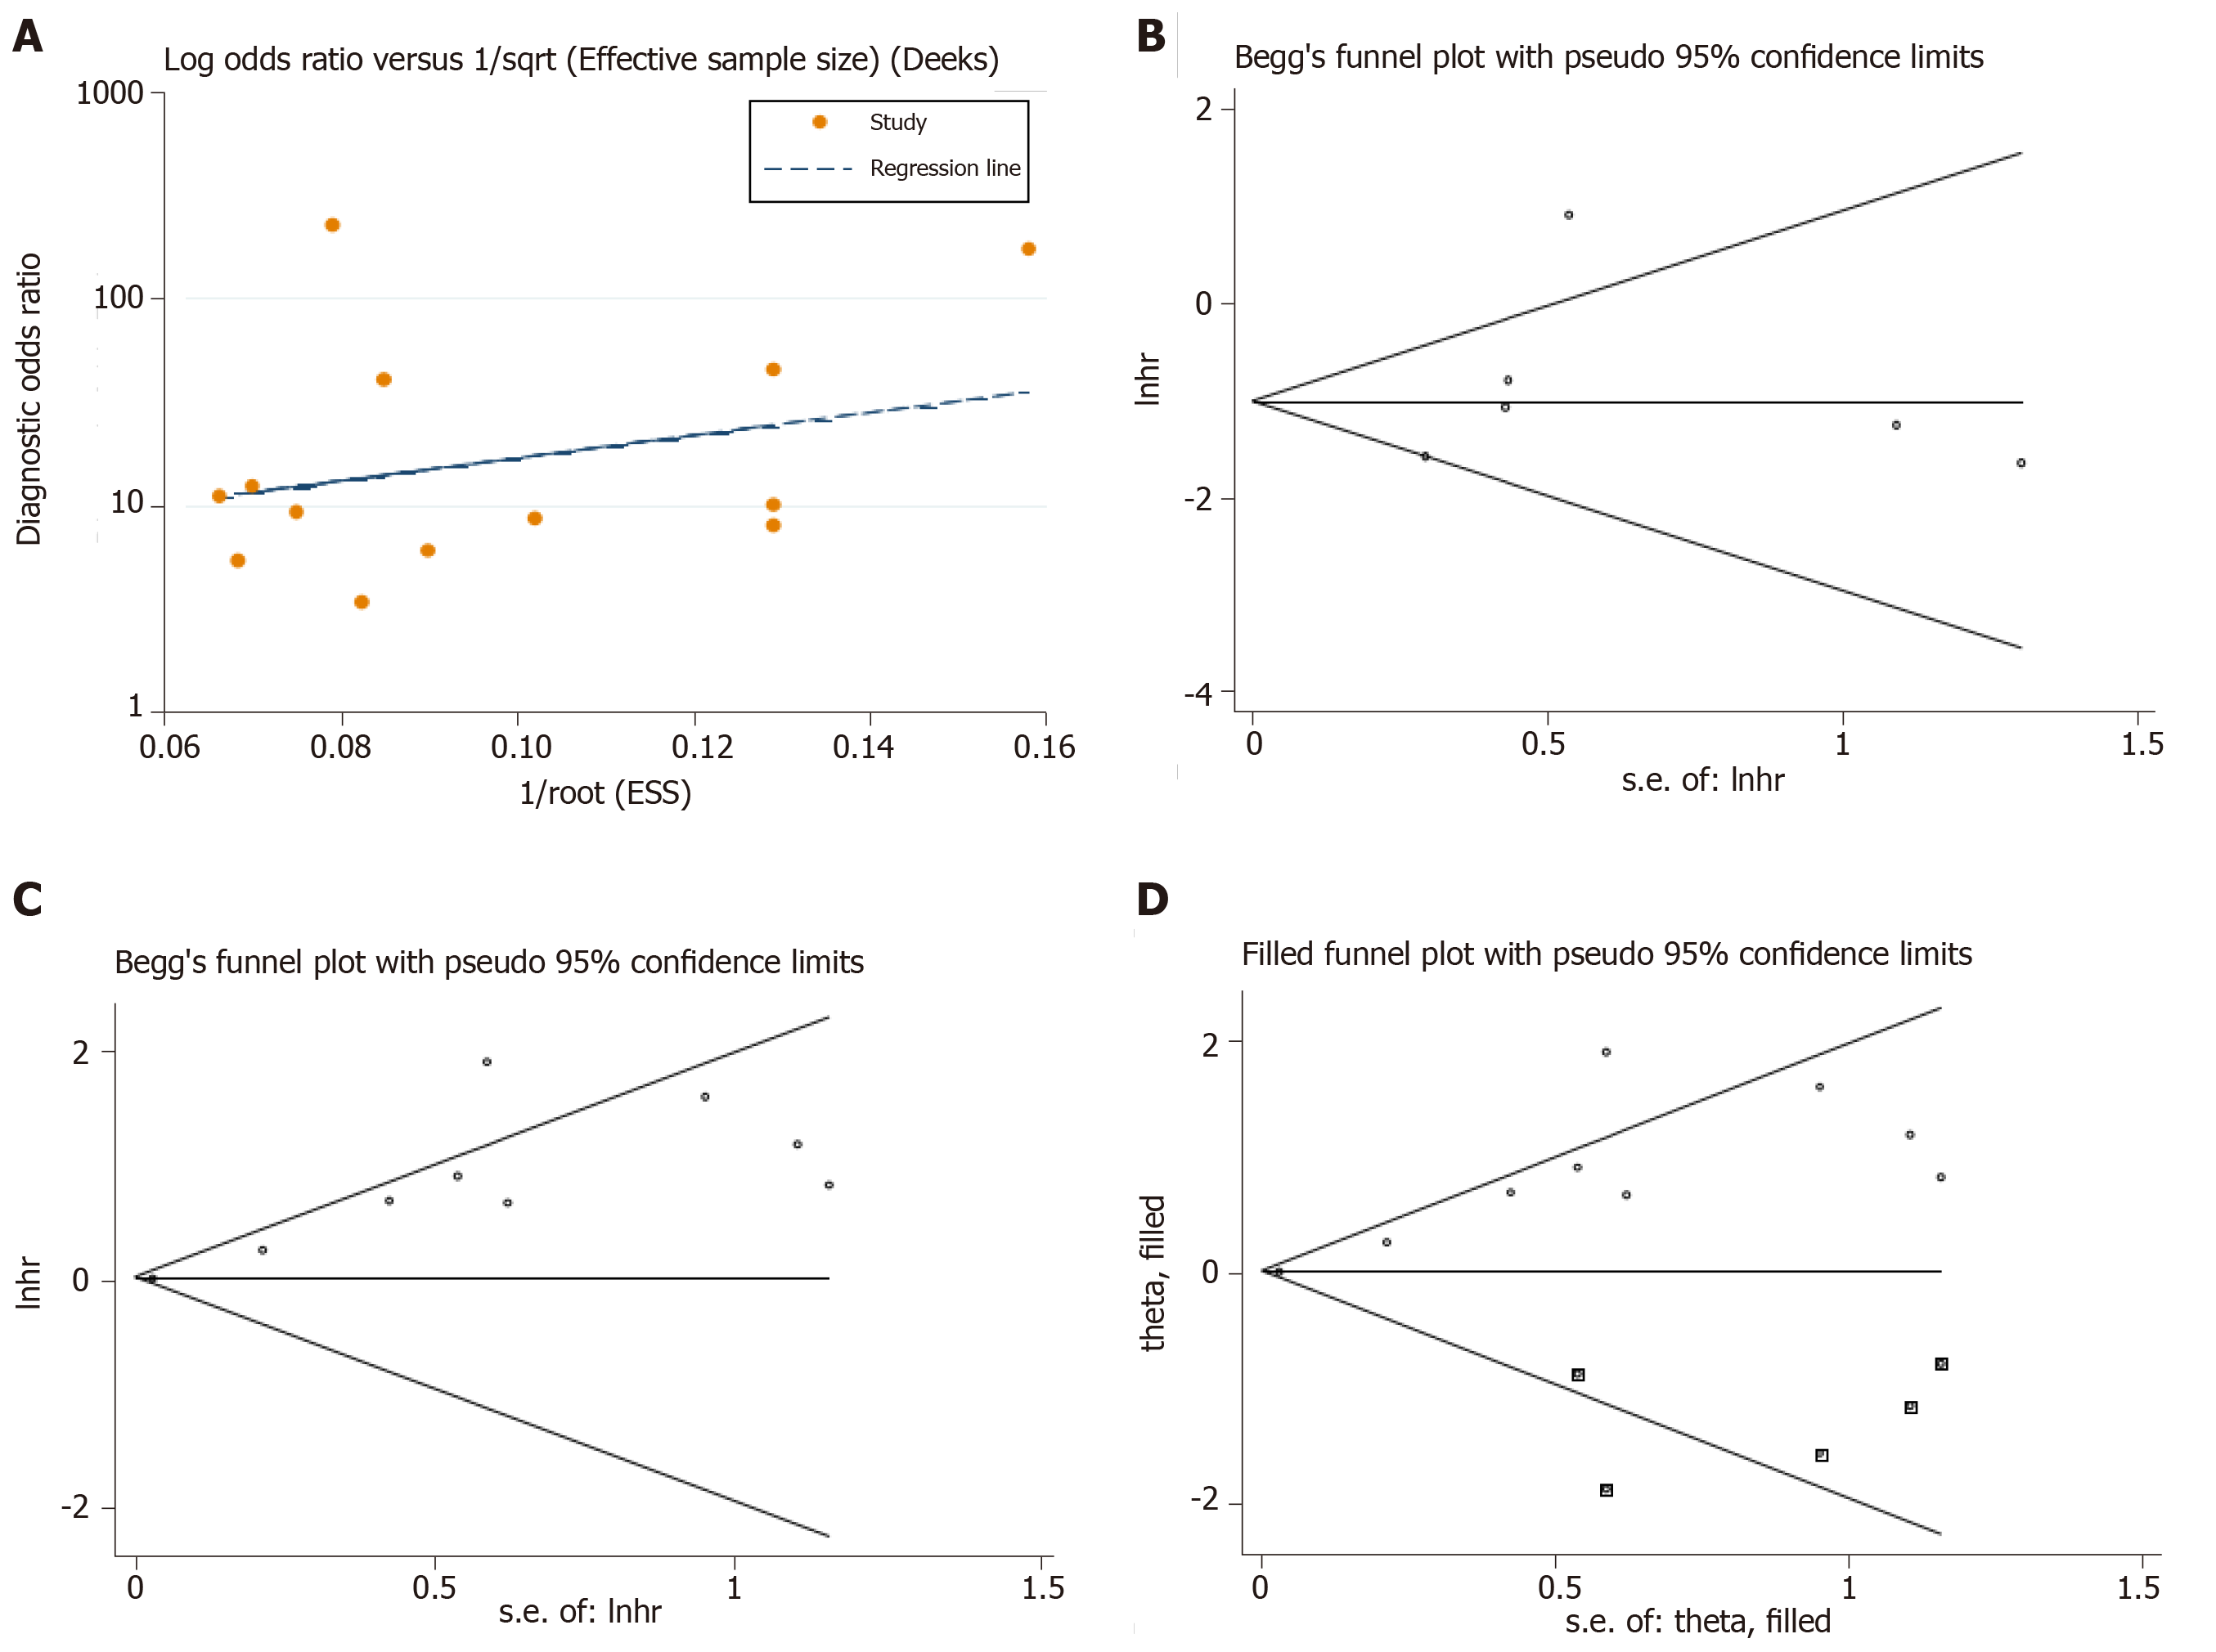
Figure 6 Publication bias judged by the Deek’s funnel plot for the diagnostic meta-analysis.
A-C: Begg’s test for the down-regulated and up-regulated circular RNA (circRNA) signatures in predicting the overall survival in hepatocellular carcinoma; D: The trim and fill method performed to assess the possible effects of bias on the overall pooled effects of the up-regulated circRNA signature. The hollow circles in squares indicate the imputed studies.
- Citation: Jiang YL, Shang MM, Dong SZ, Chang YC. Abnormally expressed circular RNAs as novel non-invasive biomarkers for hepatocellular carcinoma: A meta-analysis. World J Gastrointest Oncol 2019; 11(10): 909-924
- URL: https://www.wjgnet.com/1948-5204/full/v11/i10/909.htm
- DOI: https://dx.doi.org/10.4251/wjgo.v11.i10.909


