Copyright
©The Author(s) 2016.
World J Stem Cells. Dec 26, 2016; 8(12): 399-427
Published online Dec 26, 2016. doi: 10.4252/wjsc.v8.i12.399
Published online Dec 26, 2016. doi: 10.4252/wjsc.v8.i12.399
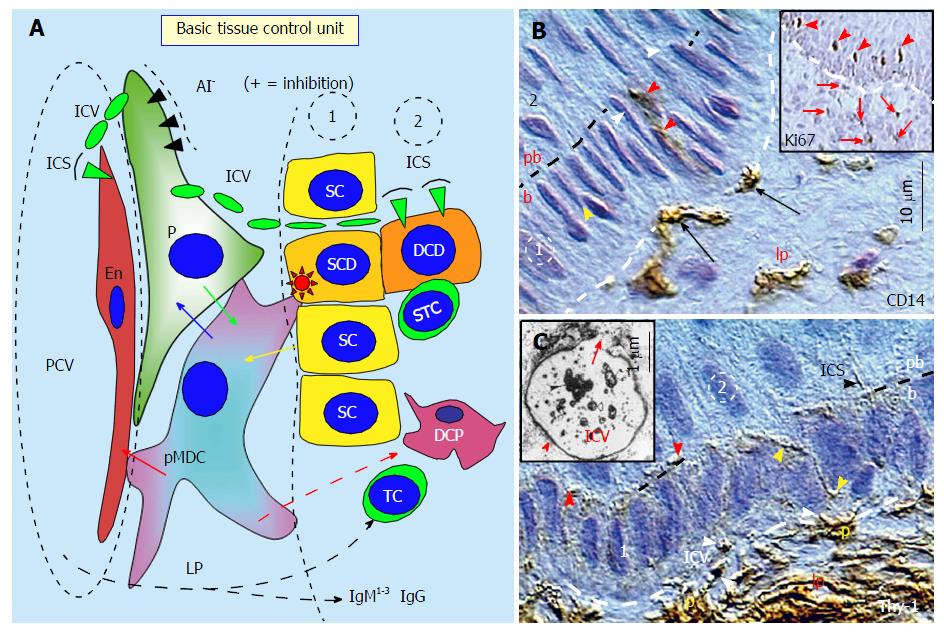
Figure 1 The basic tissue control unit and early cellular differentiation.
A: The tissue control unit (TCU) is associated with postcapillary venules (PCV). It consists of CD14+ primitive MDCs (pMDCs), pericytes (P) accompanying PCV, and autonomic innervation (AI). The TCU influences properties of Endothelial cells (En) and an involvement of other components of the TCS regulating the differentiation of tissue stem cells into the tissue-specific functional stage by the influence of DCP dendritic cell precursors (DCP), and eventually by T cells (TC), dendritic cells, and immunoglobulins (IgM1-3 and IgG). The pMDCs physically interact with adjacent En (red arrow) and receive requests (yellow arrow) to regenerate from tissue stem cells (SC) when required. The pMDCs communicate with pericytes (blue arrow), and if the pericytes are not blocked by AI, the positive signal (green arrow) is provided to pMDC to stimulate stem cell division. The asymmetric division is initiated by pMDC (red asterisk) and accompanied by a suicidal T cell (STC). It gives a rise to the stem cell daughter (SCD) and differentiating cell daughter (DCD). The pericytes provide by Thy-1+ intercellular vesicles (ICV) growth factors and cytokines to the endothelial and tissue cells. After release of ICV content (green arrowheads), the vesicles collapse into intercellular spikes (ICS); B: CD14 MDCs (arrows) in lamina propria (lp) migrate to basal layer (b) of the stratified epithelium, interact with basal stem cells (yellow arrowhead), and migrate to the parabasal layer (red arrowheads). White arrowheads indicate basal epithelial cells mowing to the parabasal (pb) layer. Inset shows Ki67+ postmitotic parabasal epithelial cells (arrowheads) represented by differentiating stem cell daughters, and postmitotic stromal cells in the lamina propria (arrows); C: Thy-1 P in the lamina propria produce ICV (white arrowheads) migrating (yellow arrowheads) toward postmitotic parabasal cells (red arrowheads) where they release their content and collapse into ICS (black arrowhead). Inset shows transmission electron microscopy of Thy-1 immunolabeling of a pericyte-derived ICV releasing its content (arrow)[1].
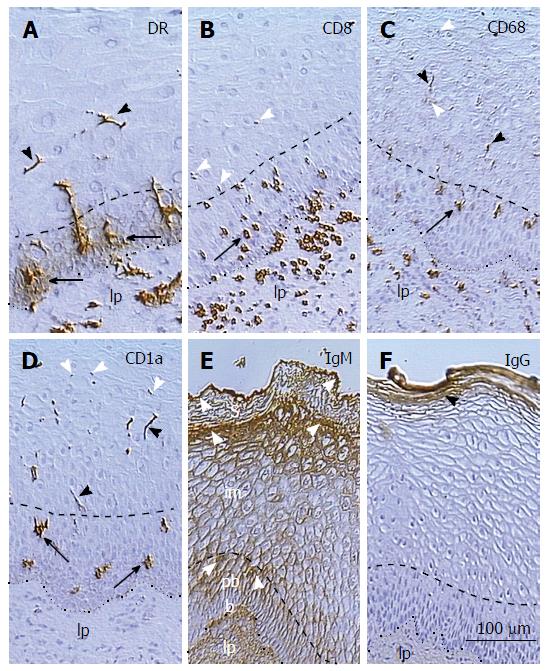
Figure 2 Distribution of monocyte derived cells, T cells, and immunoglobulins in the squamous epithelium of uterine ectocervix.
A: Dendritic cell (DC) precursors accompany vessels in the lamina propria (lp), release HLA-DR in the parabasal layer (arrows), and form DC (arrowheads) in the intermediate layer; B: T cells associate with basal epithelial cells, reach parabasal(arrow)/intermediate interface, and degenerate thereafter (arrowheads); C: The CD68 expression (arrow) accompanies mature DC (black arrowheads), which secrete CD68 (white arrowheads); D: CD1a+ DC precursors (arrows) and mature DC (black arrowheads) undergoing fragmentation (white arrowheads); E: The IgM binds to upper parabasal, upper intermediate, and upper superficial layers (arrowheads); F: IgG binds to the entire superficial layer only. The lp indicates epithelium lp, doted line is basement membrane, and dashed line is parabasal/intermediate interface[14].
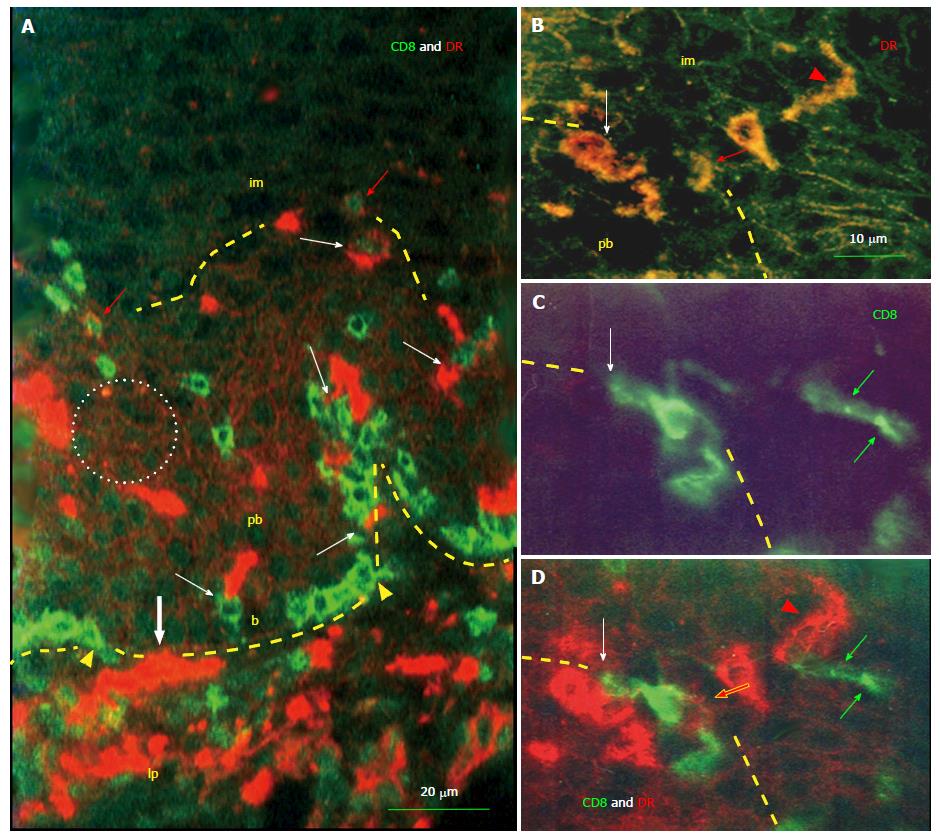
Figure 3 Interaction of monocyte derived cells and T cells in the squamous epithelium.
A: HLA DR+ monocyte-derived cells (MDCs) (red color) and CD8 T cells (TC) (green color) enter (bold white arrow and arrowheads) basal epithelial layer (b) from the lamina propria (lp). Note accumulation of TC among basal epithelial cells. Both cell types interact by themselves (white arrows). After reaching the parabasal (pb)/intermediate (im) interface (dashed line) TC also express DR (red arrows) indicating their activation. Note binding of DR released from MDCs (see Figure 2A) to parabasal epithelial cells (doted circle); B-D: Detail of pb/im interface shows MDC/T cell interaction (white arrows), the DR expression by TC (red arrows), transition of MDC into elongated dendritic cell (arrowheads), and remnants of regressing T cell in the lower intermediate layer (green arrows)[14].
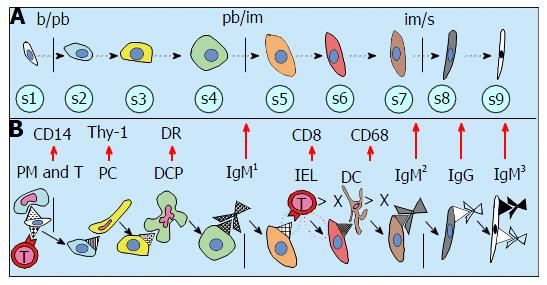
Figure 4 Hierarchy of tissue cell differentiation by an involvement of distinct elements of the tissue control system.
A: The differentiation of tissue cells may pass up to nine stages (s1-s9). The epithelial cells pass through basal to parabasal b/pb, from parabasal to intermediate pb/im and from intermediate to superficial im/s layers, with intermediate steps in between; B: Cellular differentiation is regulated by distinct IMS components. The stem cell asymmetric division is mediated by primitive MDC (PM) and T cell (T). The pericytes (PC) cause s2 > s3 transition by substances released from Thy-1 intercellular vesicles. DR+ dendritic cell precursors (DCP) stimulate s3 to s4 transfer, s4 > s5 stage is caused by a binding of IgM1, and regression of intraepithelial T lymphocytes (IEL) induces s5 > s6 transition. Regressing dendritic cells (DC) cause s6 > s7 change, binding of IgM2 induces s7 > s8 transfer, and binding of IgG accompanies s8 > s9 stage exhibiting a binding of IgM3. > X indicates the regression IEL and DC[1].
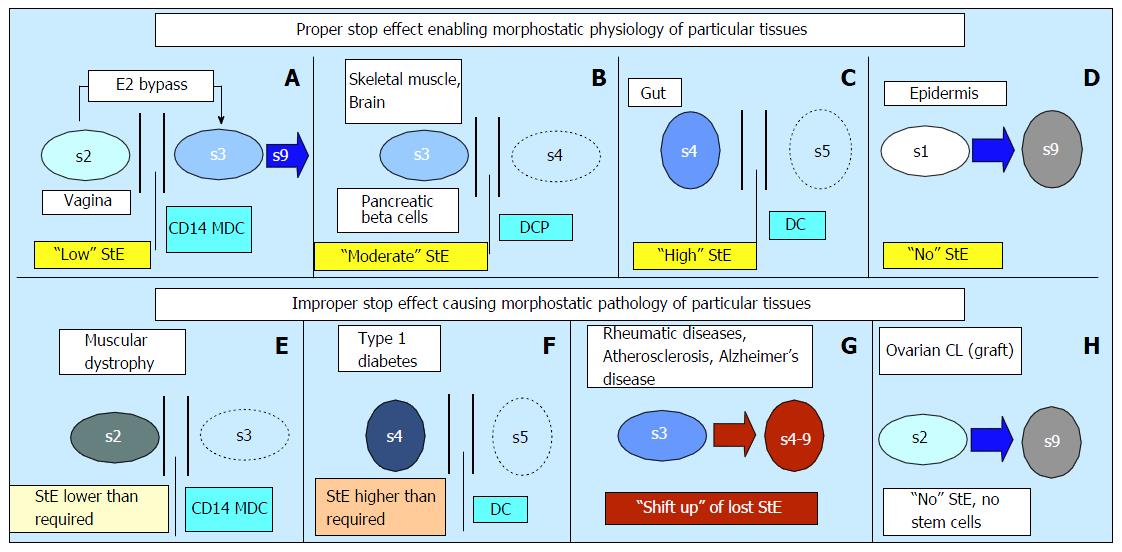
Figure 5 Proper stop effect is distinct for various tissue types and its alteration causes tissue dysfunction.
A: Low StE bypass; B: Moderate StE with a lack of T cells (TC); C: High StE with the presence of TC; D: Lack of StE; E: Functional insufficiency > compare with panel B; F: Inappropriate presence of TC > compare with panel B; G: Shift up of lost StE; H: Absence of tissue during the prenatal IMS adaptation (autologous CL graft). Adjusted from[1]: ©Antonin Bukovsky. DCP: DC precursor; MDC: Monocyte-derived cells; StE: Stop effect.
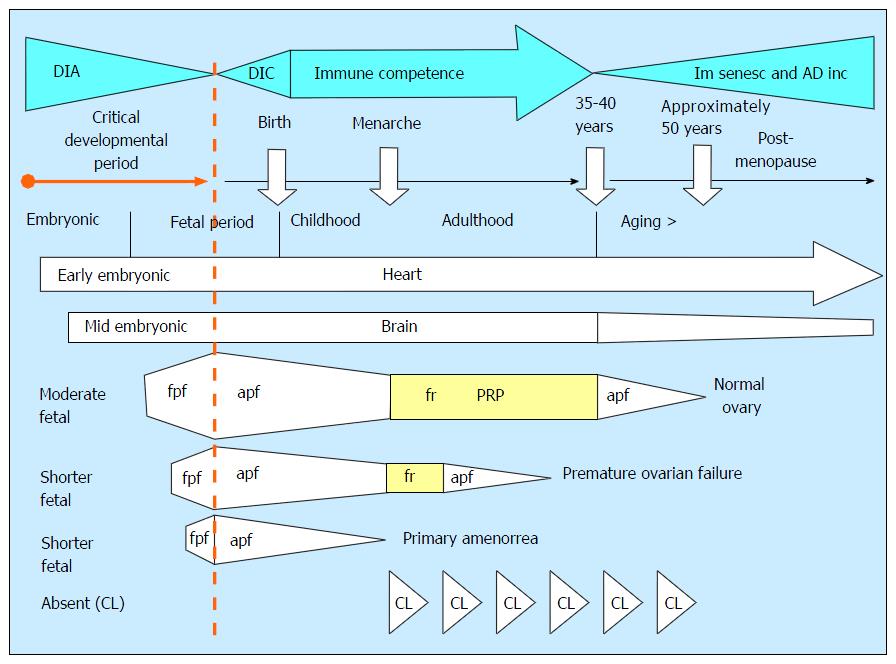
Figure 6 Developmental immune adaptation and the longevity of the tissue control system “stop effect”.
The functional persistence of various body tissues depends on their proper support by the TCS. The immune components of TCS underwent during an organism development the developmental immune adaptation (DIA), developing immune competence (DIC), mature immune competence (immune competence), and immune senescence and aging diseases incidence (Im senesc and AD inc). The DIA represents a critical developmental period for the preservation of tissue function during the postnatal lifetime. The heart differentiates and functions from early stages of embryonic period (early embryonic) and it can function throughout the life. The brain begins to differentiate a little bit later (mid embryonic), and its function can be deteriorated earlier compared to that of the heart. The fetal ovarian primary follicles (fpf) begin to differentiate during the fetal period (moderate fetal), aging fetal follicles are depleted till menarche, after which they are replaced by the cyclic follicular renewal (fr). Normal function of the ovary lasts from menarche till 35-40 years. Aging primary follicles with altered oocytes are gradually depleted till menopause. The premature ovarian failure (POF) results from shorter development of the ovary during DIA (shorter fetal), and short DIA of ovarian development causes primary amenorrea. The prenatal lack of corpora lutea causes their cyclic rejection[1]. TCS: Tissue control system; CL: Corpus luteum; PRP: Prime reproductive period.
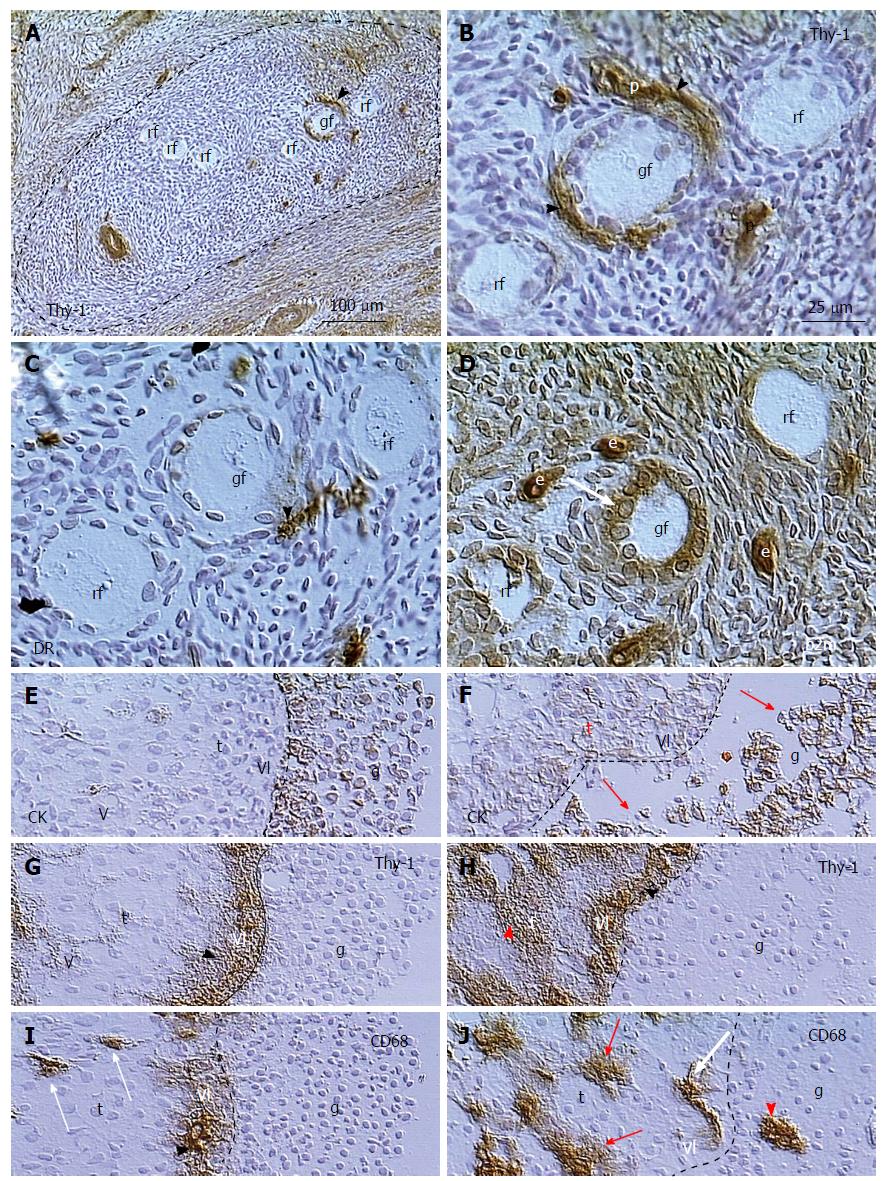
Figure 7 Follicular selection.
A: Resting primary follicles (rf) are present in ovarian area without Thy-1 expression by stromal cells, where growing primary follicle (gf) receives Thy-1 supply from vascular pericytes (arrowhead); B: Detail from (A) shows Thy-1 supply (arrowheads) from vascular pericytes (p) for the growing primary follicle; C: Parallel section showing association of DR+ activated MDC (arrowhead) with the growing but not resting primary follicles; D: Growing primary follicle exhibits large granulosa cells with strong expression of beta2m; E: Dominant preovulatory follicle granulosa cells (g) with expression of cytokeratin (CK) are attached to the follicular basement membrane (dashed line). Note lack of staining in vascular lamina propria (vl) and theca interna cells (t); F: Regressing large antral follicle in the same ovary exhibits detachment of granulosa cells (arrows) and CK expression in the vascular lamina and thecal cells; G: Thy-1 expression in vascular lamina (arrowhead) but no staining of theca interna in dominant follicle; H: Regressing follicle with Thy-1 staining in both, vascular lamina propria and theca interna (red arrowhead); I: CD68 is released from MDCs in the vascular lamina (arrowhead) of the dominant follicle, but not from thecal MDCs (arrows), and no MDCs are present among the granulosa cells; J: In the regressing follicle the MDCs release CD68 in theca interna (red arrows), and invade among granulosa cells (arrowhead)[171].
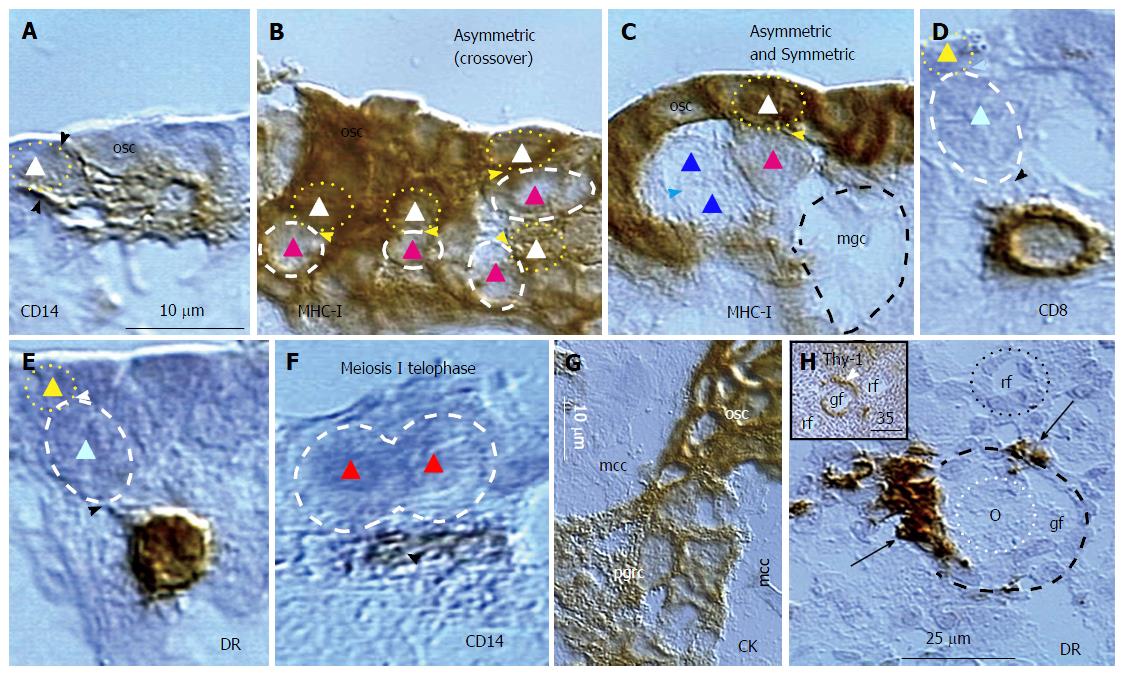
Figure 8 Origin of germ and granulosa cells in the ovary of the human midpregnancy fetus.
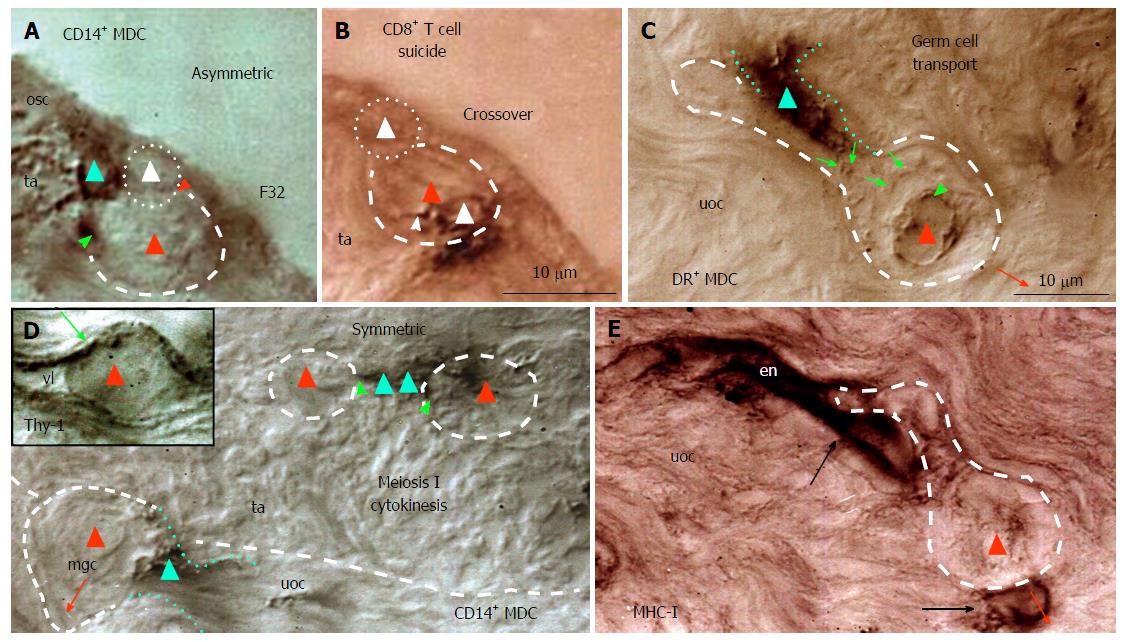
A: Isolated ovarian stem cell (triangle) is associated with CD14 pMDC (arrowheads); B: Fetal germ cells (red triangles) lacking MHC-I expression originate from MHC-I+ ovarian stem cells (white triangles); C: The symmetric division of germ cells (blue triangles) follows asymmetric division (white and red triangles) of ovarian stem cells, and causes emergence of moving germ cell (mgc); D: The origin of germ cells requires association of CD8+ (D) and DR+ (E) T cell; F: Meiosis I telophase (red triangles) is associated with a primitive MDC (arrowhead); G: The fetal primitive granulosa cells (pgrc) originate from ovarian stem cells between the mesenchymal cell cords (mcc); H: Small growing follicle (gf) is accompanied by DR+ MDCs (arrows), which are absent at the resting follicle (rf). Inset shows Thy-1+ pericytes (arrowhead) during follicular selection (Figure 7). Bar in A for A-F. Adjusted from[44] with a permission: ©Springer United States. MDC: Monocyte-derived cell; pMDC: Primitive MDC.
Figure 9 Origin and migration of germ cells during the midfollicular phase in the adult human ovary.
A: In the presence of primitive MDC (green triangle) the dividing ovarian stem cell (white triangle) produces a germ cell (red triangle); B: This is accompanied by the presence of CD8 T cell (white triangle) with extensions (arrowhead) within the germ cell; C: Migrating germ cell (dashed line) is accompanied by DR+ MDC (dotted lines), which releases DR (arrows) accumulating at the germ cell nucleus (arrowhead); D: In the tunica albuginea (ta) MDCs (green triangles) are associated (green arrowheads) with meiosis I cytokinesis (red triangles) and accompany moving germ cell (mgc) in the upper ovarian cortex (uoc). Inset shows Thy-1+ cortical venule containing germ cell (red triangle); E: Migrating germ cell lacking MHC-I expression is associated with stained endothelial cells of a venule in the upper ovarian cortex. F32 indicates a female patient’s age[18]. MDC: Monocyte-derived cell.
Figure 10 Meiotic events during midfollicular phase are followed by follicular renewal.
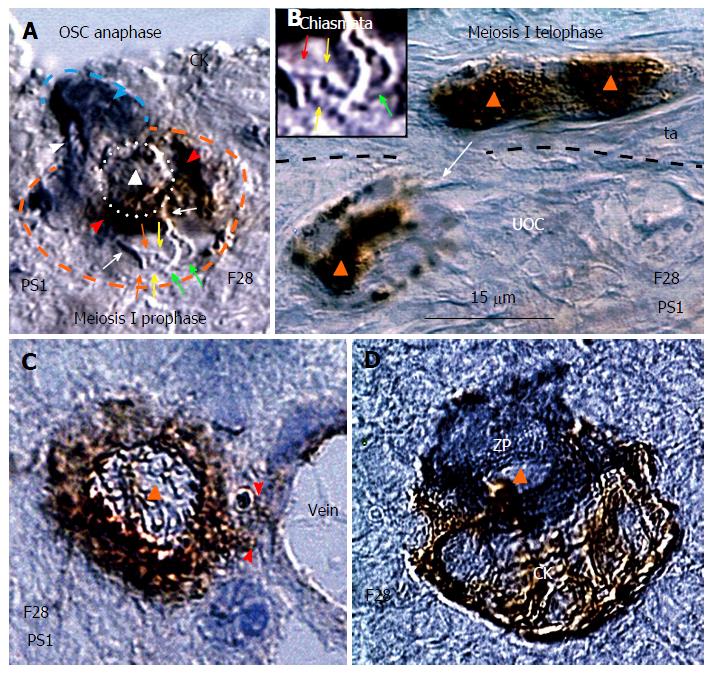
A: Cytokeratin stained ovarian stem cell (OSC) (blue arrowhead) moves its chromosomes (white arrowhead) during the OSC anaphase to the OSC end. The germ cell expressing PS1 meiotic protein (red arrowhead) exhibits meiosis I prophase with chromosome (white arrows) duplication (red and green arrows) and crossover of sister chromatids (yellow arrows). The triangle indicates putative suicidal T cell (see Figure 9B) inducing expression of PS1 in the emerging germ cel; B: Marked nuclear expression of PS1 accompanies germ cell telophase of meiosis I in the tunica albuginea (ta). Arrow indicates migrating postmeiotic germ cell. Inset shows a detail of interacting chromosomes (red and green arrows) from panel A; C: The germ cell entering (arrowheads) the cortical vein exhibits cytoplasmic but not nuclear (triangle) PS1 staining; D: Association of zona pellucida+ small oocyte with CK+ granulosa cell nest during the new primary follicle formation in the lower ovarian cortex[43]. All panels are from the identical ovary during midfollicular phase of the 28-year-old women.
Figure 11 Origin of ovarian stem cells and formation of granulosa cell nests migrating to the lower ovarian cortex in midfollicular ovaries.
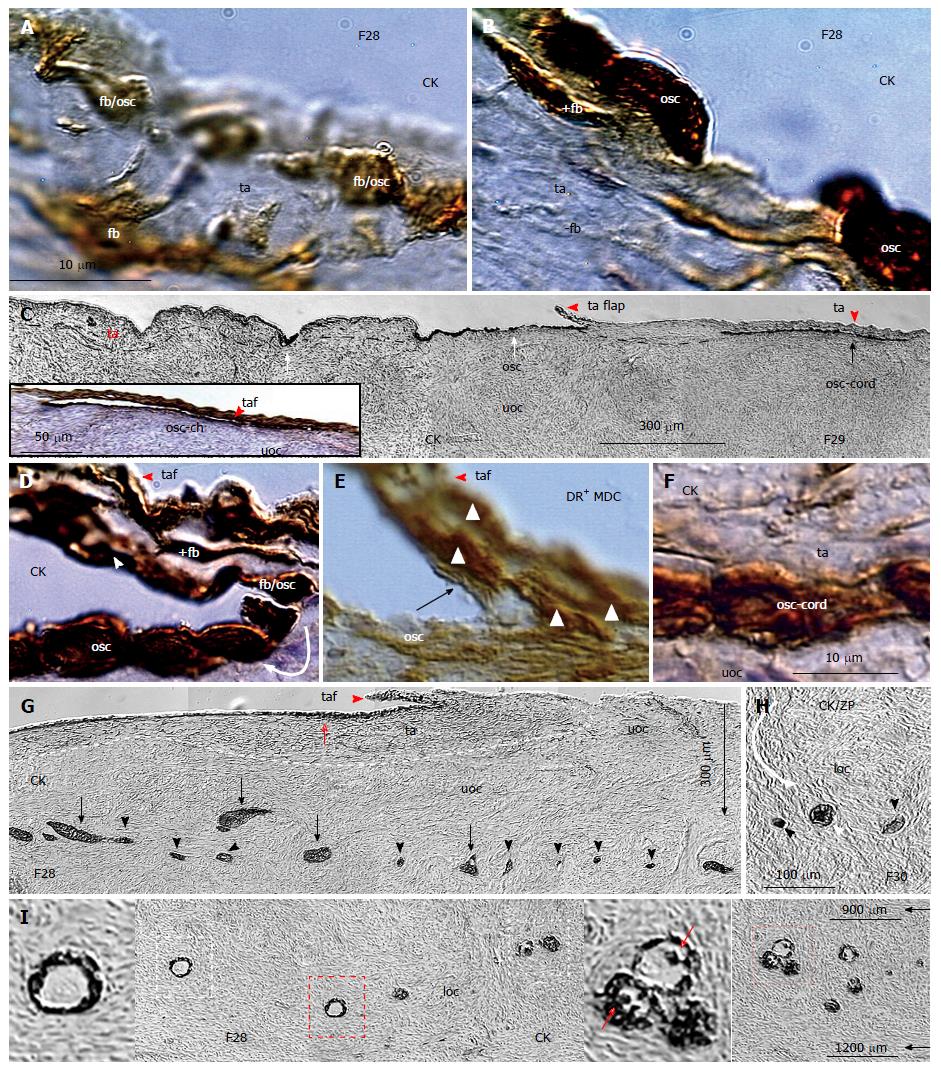
A: The CK+ fibroblast-shape cells (fb) in tunica albuginea develop into ovarian stem cells (OSC) precursors (fb/osc) to form new OSC cells (B); C: Certain segments of ovarian surface are covered by OSCs (white arrows) to form by extensions the tunica albuginea flaps, the OSC channels (inset), and OSC cords (black arrow). The flaps originate from CK+ fibroblasts, and are covered by CK+ OSC precursors (fb/osc) (D), contain DR+ (activated) MDCs (E), and form bilaminar OSC cords (F); G: The CK+ OSC-derived clusters (arrows) of granulosa cells undergo fragmentation into granulosa cell nests (arrowheads), which are transferred by stromal rearrangements to the lover ovarian cortex (H) to form new primary follicles (white arrowhead); I: New primary follicles contain CK+ primary Balbiani bodies (right inset), which are consumed, and absent in the resting follicles (left inset)[43]. The panels A, B, G and I are from the identical ovary of 28-year-old women presented in the Figure 10. MDC: Monocyte-derived cell.
Figure 12 Granulosa cells are essential for the in vivo survival of the newly formed oocytes.
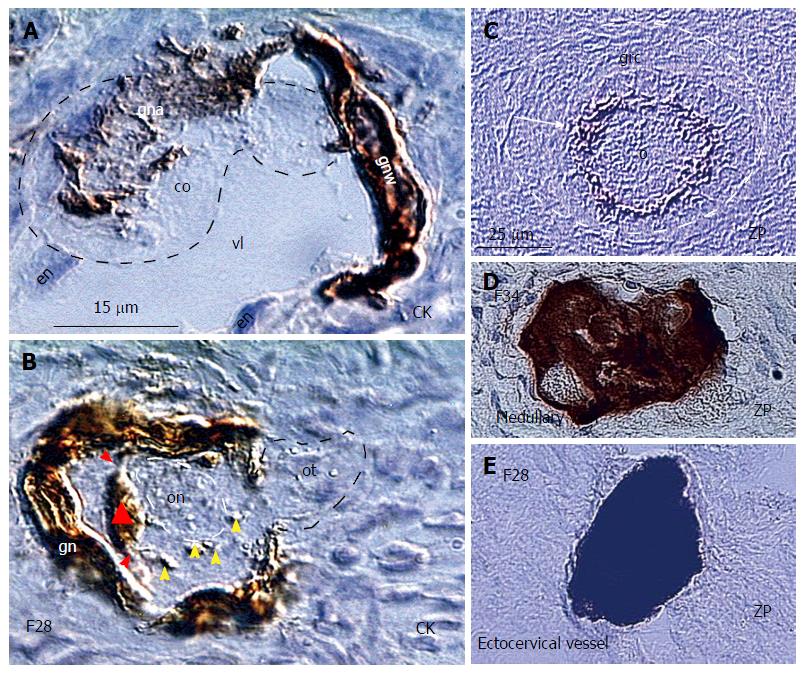
A: The small circulating oocyte (co) is captured in the lower ovarian cortex by CK+ granulosa nest arm (gna) in the vein lumen (vl) lined by endothelial cells (en) and granulosa nest wall (gnw); B: The CK+ primary Balbiani body (triangle) adjacent to the oocyte nucleus (on) is formed by granulosa cell extensions (red arrowheads) and disperses its particles (yellow arrowheads) to the freshly captured oocyte, which still exhibits the oocyte tail (ot) outside of the nest; C: Intact oocyte (o) covered by ZP+ membrane (arrow) and granulosa cells (grc) in the primary follicle (dashed line); D: The vein in ovarian medulla in the identical ovary contains regressing oocyte with marked cytoplasmic ZP staining; E: Regressing oocyte with strong cytoplasmic ZP expression found in the ectocervical vein in the women showing follicular renewal in A and B panels. Panels A and B adjusted from[43]: © Antonin Bukovsky; C-E from[172], with a permission: ©Elsevier/North-Holland Biomedical Press. The panels A, B, and E are from the identical ovary of 28-year-old women presented in the Figure 10.
Figure 13 ZP3 expression on growing preantral follicles and development of secondary Balbiani body in small antral follicles.
A: Resting primary follicles express ZP1, ZP2 and ZP4[172], but lack ZP3 expression; Growing preantral follicles show oocyte ZP3 expression (B), but lack the secondary CK+ Balbiani body (C); which develops in the small antral follicles (blue arrowhead in D)[46]. ZP: Zona pellucida glycoprotein.
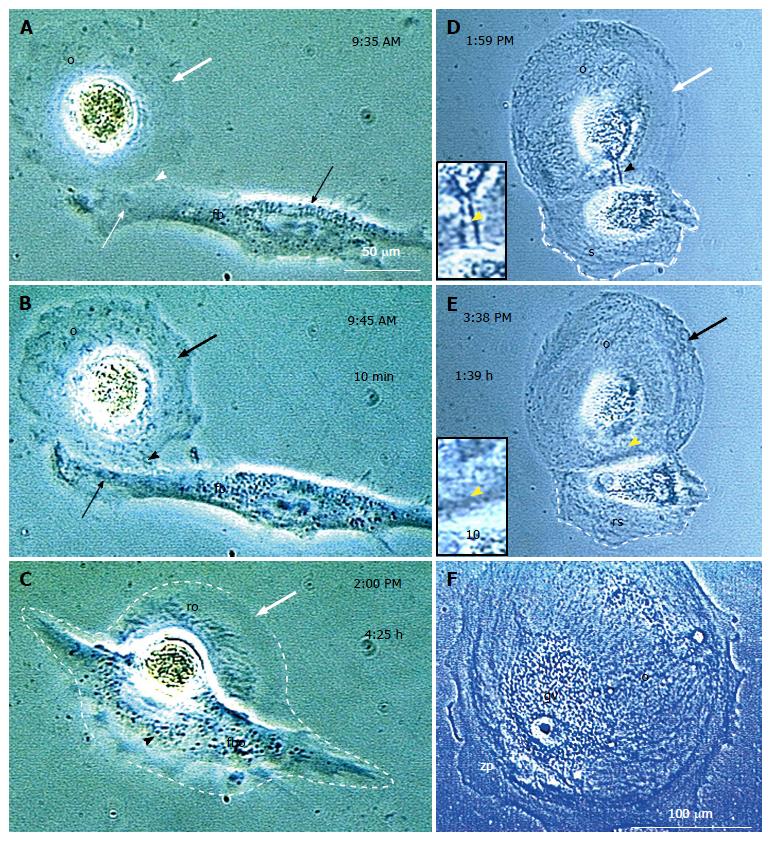
Figure 14 In vitro developed oocyte-like cells retrieve meiotically nonfunctional organelles from fibroblasts or satellite daughter cells.
A: The in vitro developed oocyte-like cell (OLC) (o) with a lack of optically dense organelles (bold white arrow) is joined (arrowhead) by a fibroblast (fb) which provides organelles (B), but forms a fibro-oocyte hybrid causing oocyte regression (C); Alternatively, the OLC forms a satellite daughter (s in D), which is drained (black arrowhead and inset) and regresses (rs in E) when the OLC is saturated (black arrow). This results in the large OLC (F) with germinal vesicle (gv) and thick zona pellucida (zp), but provided organelles are not functional for resuming meiosis II. Panel F reprinted from[10]: ©Antonin Bukovsky. Other panels adjusted from[50], with a permission: ©Wiley-Liss, Inc.
Figure 15 Fibroblasts steal the ZP3 sperm-binding protein from in vitro maturation treated oocyte-like cells.
A: Untreated culture shows low perinuclear ZP3 in the oocyte-like cell and traces in the satellite cell (SC) and accompanying fibroblasts (FB); B: After hCG, the marked ZP3 staining is apparent, which is drained by FBs (red arrowheads); C: Adding sperm to OSC culture after IVM treatment caused that the sperm were binding to the fibroblasts (arrowheads) instead to the OLCs[46]. IVM: In vitro maturation; ZP3: Zona pellucida glycoprotein 3; OLCs: Oocyte-like cells.
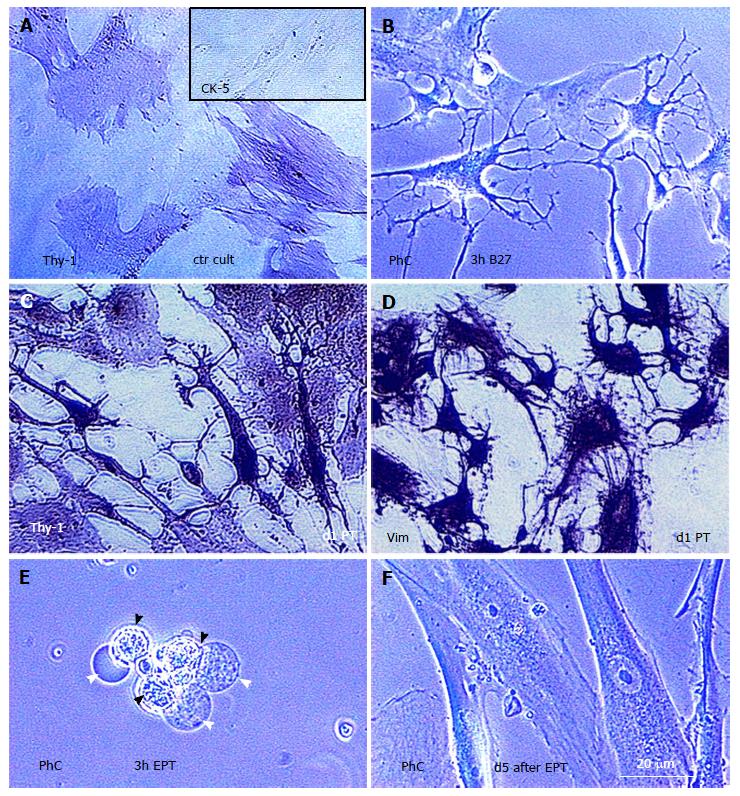
Figure 16 Transdifferentiation of human vascular smooth muscle cells to the neuronal cells and smooth muscle stem cells after the treatment with sex steroid combinations.
A: Untreated human smooth muscle cell control culture exhibits a moderate Thy-1 expression characteristic for vascular pericytes. Inset shows a lack of cytokeratin staining; B: Phase contrast (PhC) of smooth muscle cell culture 3 h after the treatment with Neurobasal/B27 medium showed a transdifferentiation of smooth muscle cells into neuronal cells connected multidirectionally by their neurites; C: The neuronal cells exhibited strong expression of Thy-1 glycoprotein characteristic for neuronal cells (compare with panel A) after the treatment with 20 mmol/L progesterone and 60 mmol/L testosterone (d1 PT); D: The so called “brain in vitro” shows strong expression of vimentin, which is characteristic for the human neural cells; E: When 12 mmol/L estradiol was added to the progesterone and testosterone, the proportion of human smooth muscle cell culture dedifferentiated in 3 h into human smooth muscle stem cells (black arrowheads), which exhibited anchors of bubble-like type (white arrowheads), indicating their ability for a settlement. These cells redifferentiated in a few days in the fresh new human smooth muscle cells (F - compare with panel A). Adjusted from[81] with permission: ©Landes Bioscience.
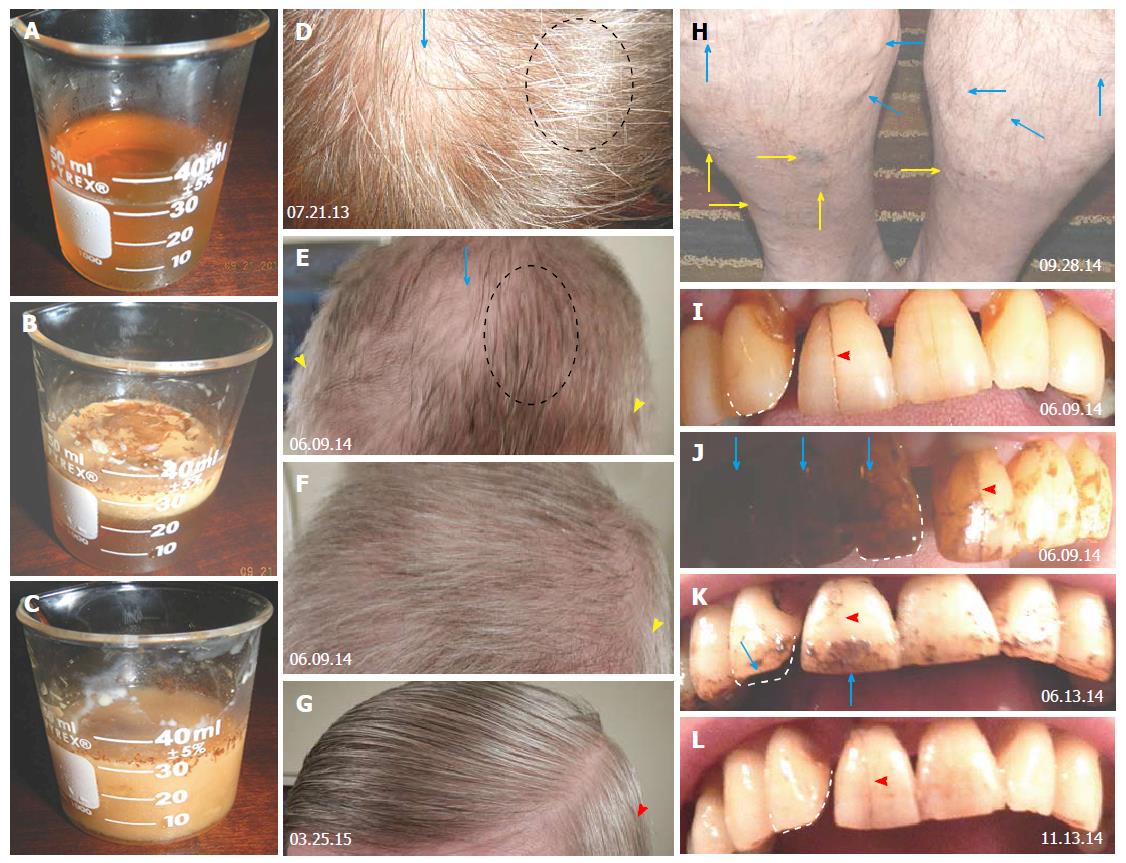
Figure 17 Propolis tincture preparation for the dental and systemic use, and local effects for the hair, varicose veins, and teeth.
A: Glass container with 30 mL 40% alcoholic distillate; B: The distillate is over layered with 1 mL of propolis tincture for a short local teeth treatment (about 2-3 s) and then poured back (C) to be consumed for the systemic propolis treatment; D: Developing frontal alopecia (arrow) before the local propolis treatment; dashed line circle indicates accompanying hair color depletion; E: Persisting unchanged frontal alopecia (arrow) with a restoration of the original hair color (compare with D) but persistence of color depletion in propolis untreated coat sides (yellow arrowhead); F: Hair condition in normal (side to side) hair orientation; G: Hair appearance showing further improvement of hair condition, including partial color regeneration in propolis treated sides (red arrowhead); H: Shrinking (blue arrows) and regressed (yellow arrows) varicose veins on the legs after the several weekly local propolis treatment; I: Upper teeth row after professional dental cleaning; J: Heavy propolis deposits (arrows) thereafter on the dentist densely brushed teeth; K: Residual propolis attachments four days later; L: Teeth's status after five months of daily propolis treatment showing no propolis binding without any dental brushing, which indicates well-regenerated dental enamel. Arrowheads indicate a diminution of dental fissure (compare with panel I). Numbers indicate the image collection dates[161].
Figure 18 The pyramid above the bed for the natural healing of the shoulder and back pains.
The device is hanged to the chain, which is fixed to the room ceiling, and oriented by one bottom side exactly to the earth north pole. It was constructed from the copper round (6.4 mm in diameter), measuring 54 cm at the bottoms and 49 cm at the sides.
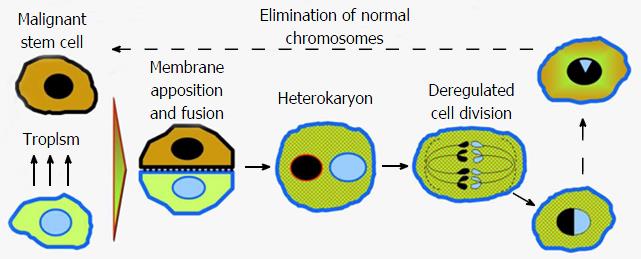
Figure 19 Hybrids of cancer cells with normal cells or monocyte derived cells contribute to the lack of cancer rejection and its progression.
The malignant and normal cell exhibit a tropism resulting in apposition and a heterokaryon after the fusion with the surface expression of normal cell markers. After deregulated divisions, the multiple hybrid cells persist and some of them can gradually lose normal cell chromosomes and revert back to the malignant stem cells[1].
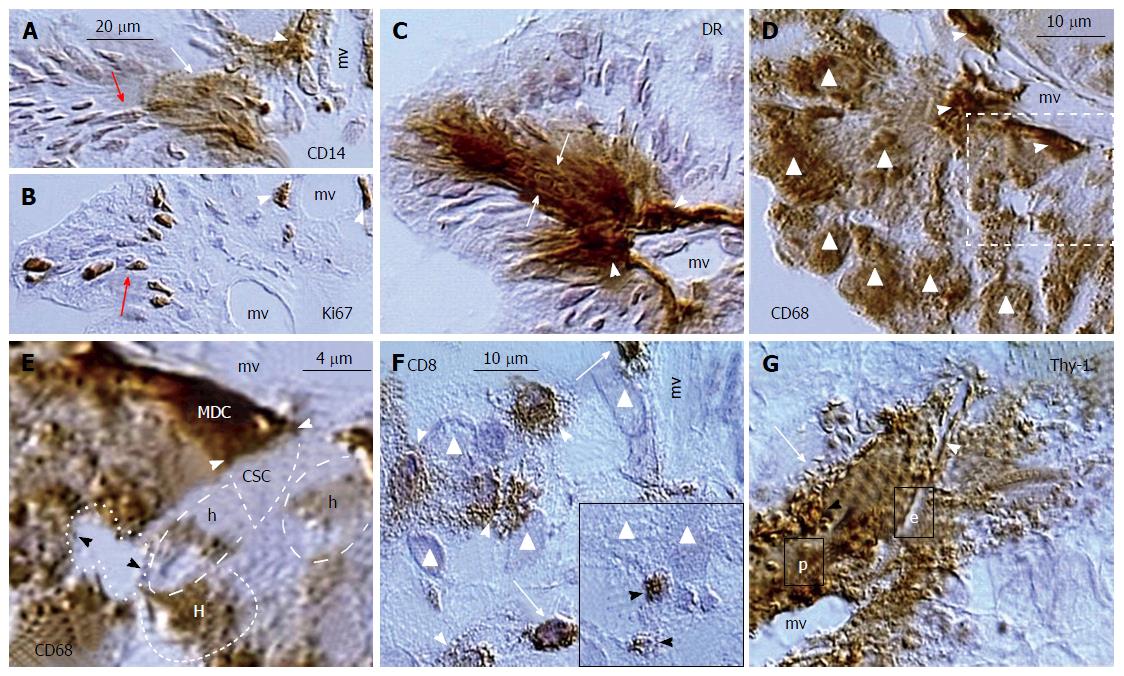
Figure 20 Ovarian cancer augmentation by the immune/morphostatic system.
A: Association of CD14+ MDC (arrowhead) with cancer microvasculature (mv) results in nuclear and cytoplasmic CD14 expression by cancer/MDC hybrids (white arrow) and nuclear CD14 expression in more distant cancer cells (red arrow); B: Ki67 expression by divided perivascular (arrowheads) and postmitotic malignant cells (arrow); C: HLA DR+ expression by perivascular MDCs (arrowheads) and adjacent cancer cells (arrows); D: CD68 MDCs associate with microvasculature (arrowheads) and most malignant cells express CD68 (triangles); E: Detail from panel D shows an apposition (white arrowheads) of perivascular CD68 MDC with unstained cancer stem cell (CSC). The fresh cancer/normal cell hybrids (h) show partial CD68 expression and more advanced hybrids (H) are more distinctly stained. Dividing cancer stem cell (dotted line) is unstained; F: CD8 T cells (TC) evade (arrows) from cancer microvasculature (mv) and exhibit increase in size (arrowheads) among cancer cells (triangles). Inset shows regressing TC (arrowheads) among cancer cells; G: Cancer microvasculature (mv) is accompanied by hyperactive pericytes (p) producing Thy-1+ vesicles (black arrowhead) releasing their growth promoting substances among adjacent cancer cells and collapsing into the Thy-1+ spikes (arrow). The microvasculature produces new endothelial cells (e) accompanied by new Thy-1+ pericytes (white arrowhead). Adjusted from[21]: ©Antonin Bukovsky.
- Citation: Bukovsky A. Involvement of blood mononuclear cells in the infertility, age-associated diseases and cancer treatment. World J Stem Cells 2016; 8(12): 399-427
- URL: https://www.wjgnet.com/1948-0210/full/v8/i12/399.htm
- DOI: https://dx.doi.org/10.4252/wjsc.v8.i12.399


