Copyright
©©The Author(s) 2022.
World J Stem Cells. Jan 26, 2022; 14(1): 104-116
Published online Jan 26, 2022. doi: 10.4252/wjsc.v14.i1.104
Published online Jan 26, 2022. doi: 10.4252/wjsc.v14.i1.104
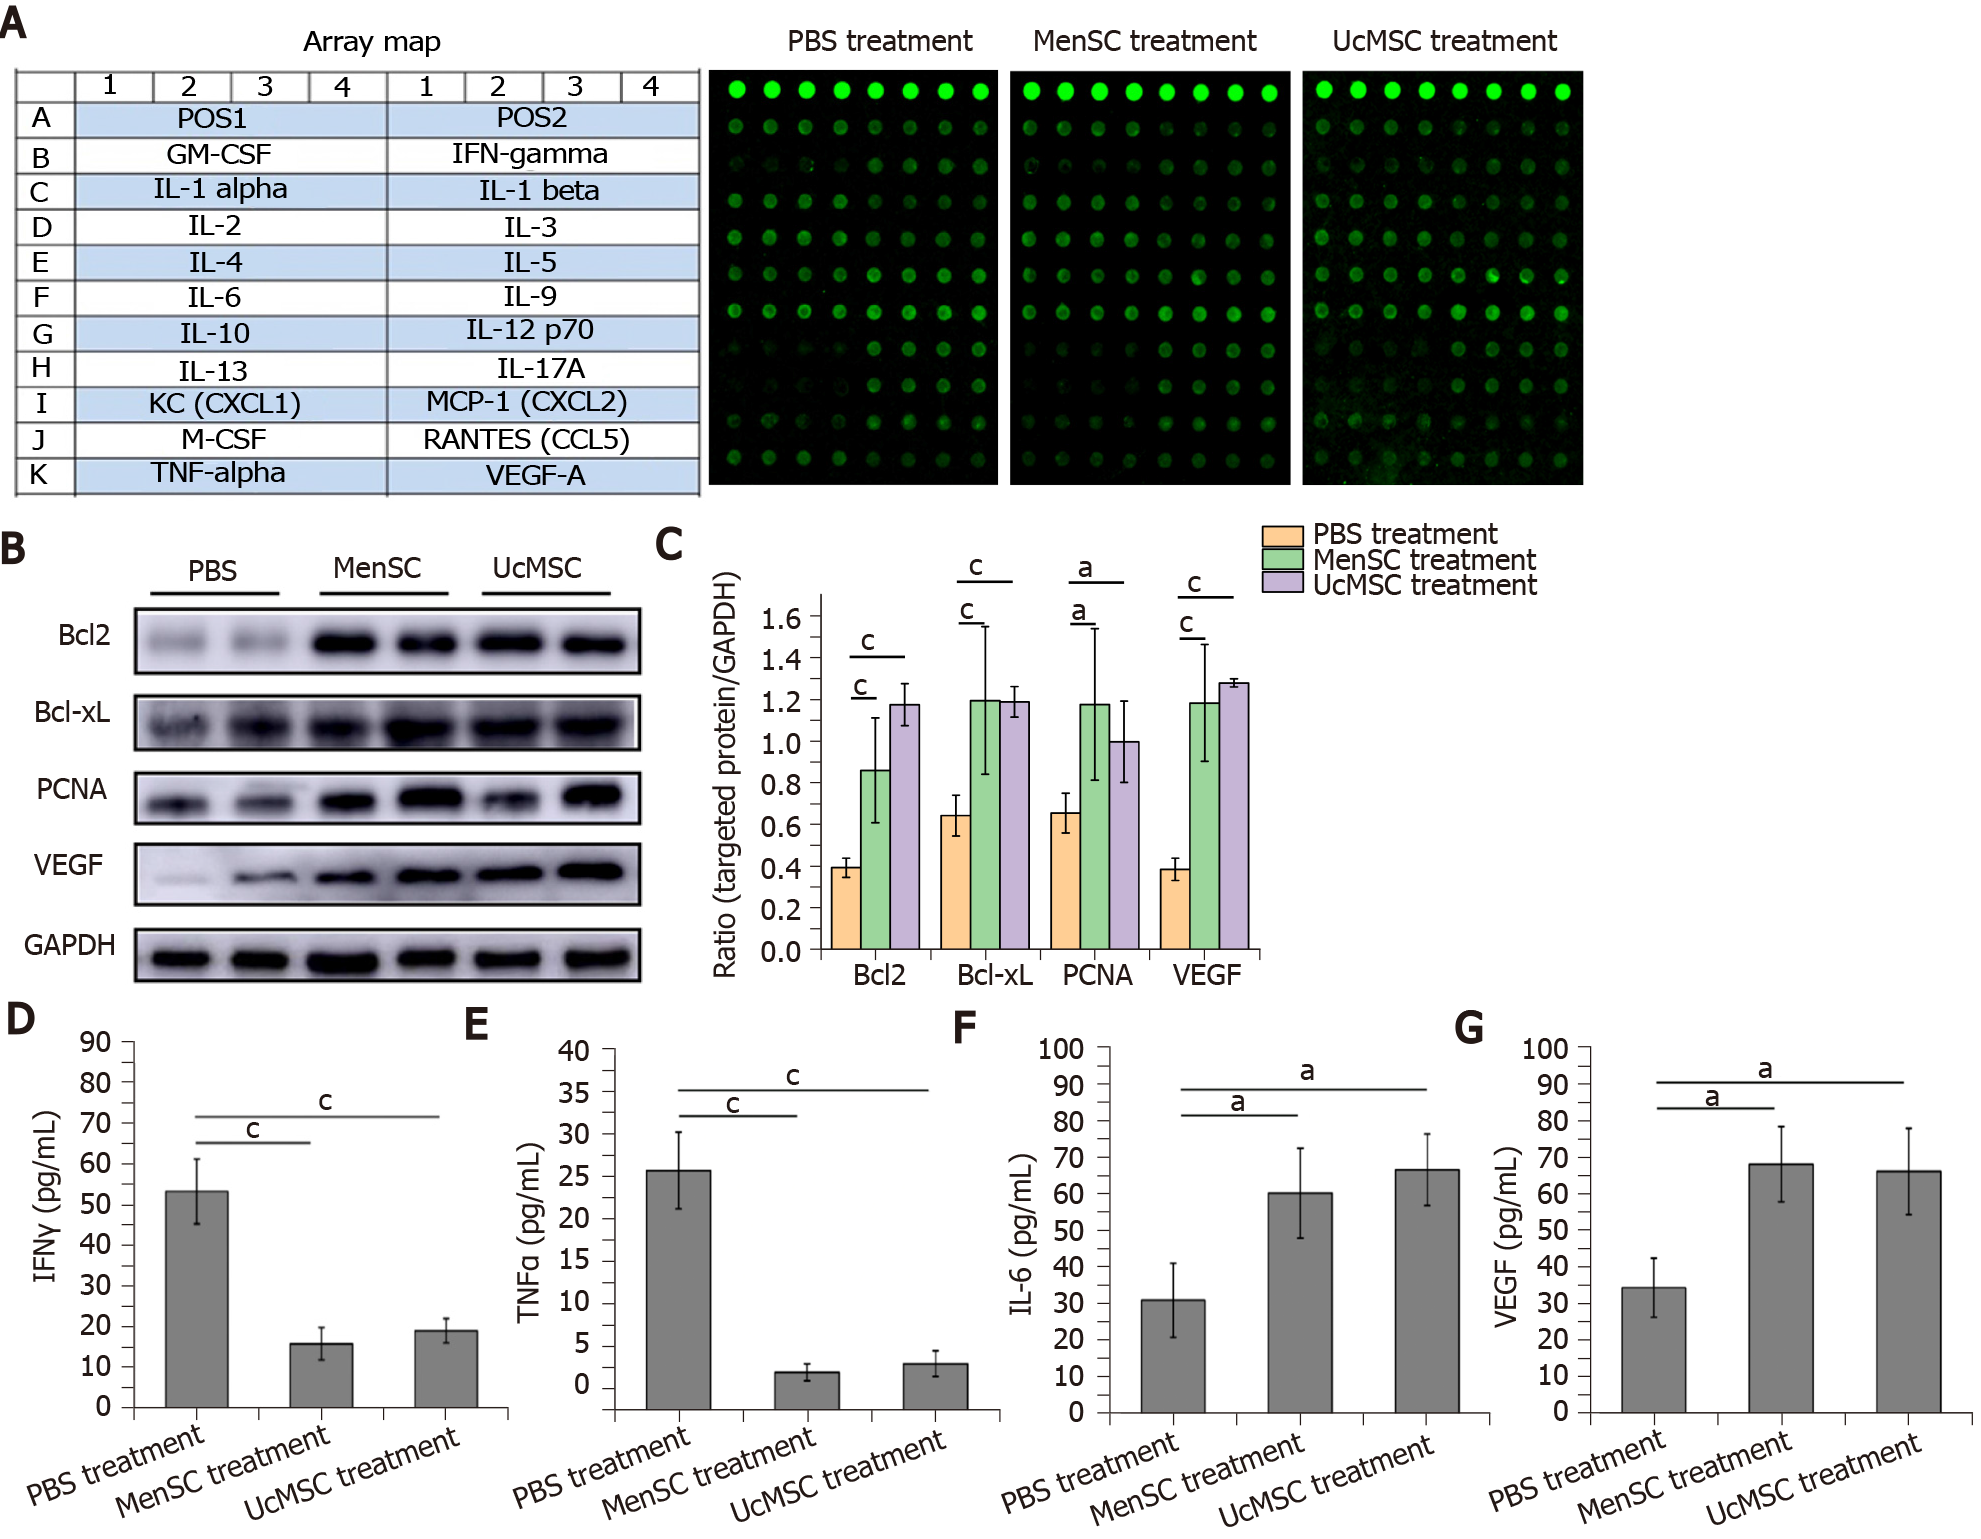
Figure 1 Mesenchymal stem cell transplantation promotes pancreatic regeneration and regulates immune homeostasis in streptozotocin-induced type 1 diabetes mice.
A: The cytokines examined and representative array images are shown; B and C: The expression levels of vascular endothelial growth factor, Bcl2, BCL-xL, and proliferating cell nuclear antigen in the mouse pancreas were detected by WB, and the relative expression of targeted proteins was quantitated using ImageJ software; D-G: The concentrations of significantly changed cytokines were quantified based on the fluorescence intensities. aP < 0.05; bP < 0.01; cP < 0.001. MSC: Mesenchymal stem cell; UcMSC: Umbilical cord-derived MSC; MenSC: Menstrual blood-derived endometrial stem cells; IFN: Interferon; TNF: Tumor necrosis factor; IL: Interleukin; VEGF: Vascular endothelial growth factor; PCNA: Proliferating cell nuclear antigen.
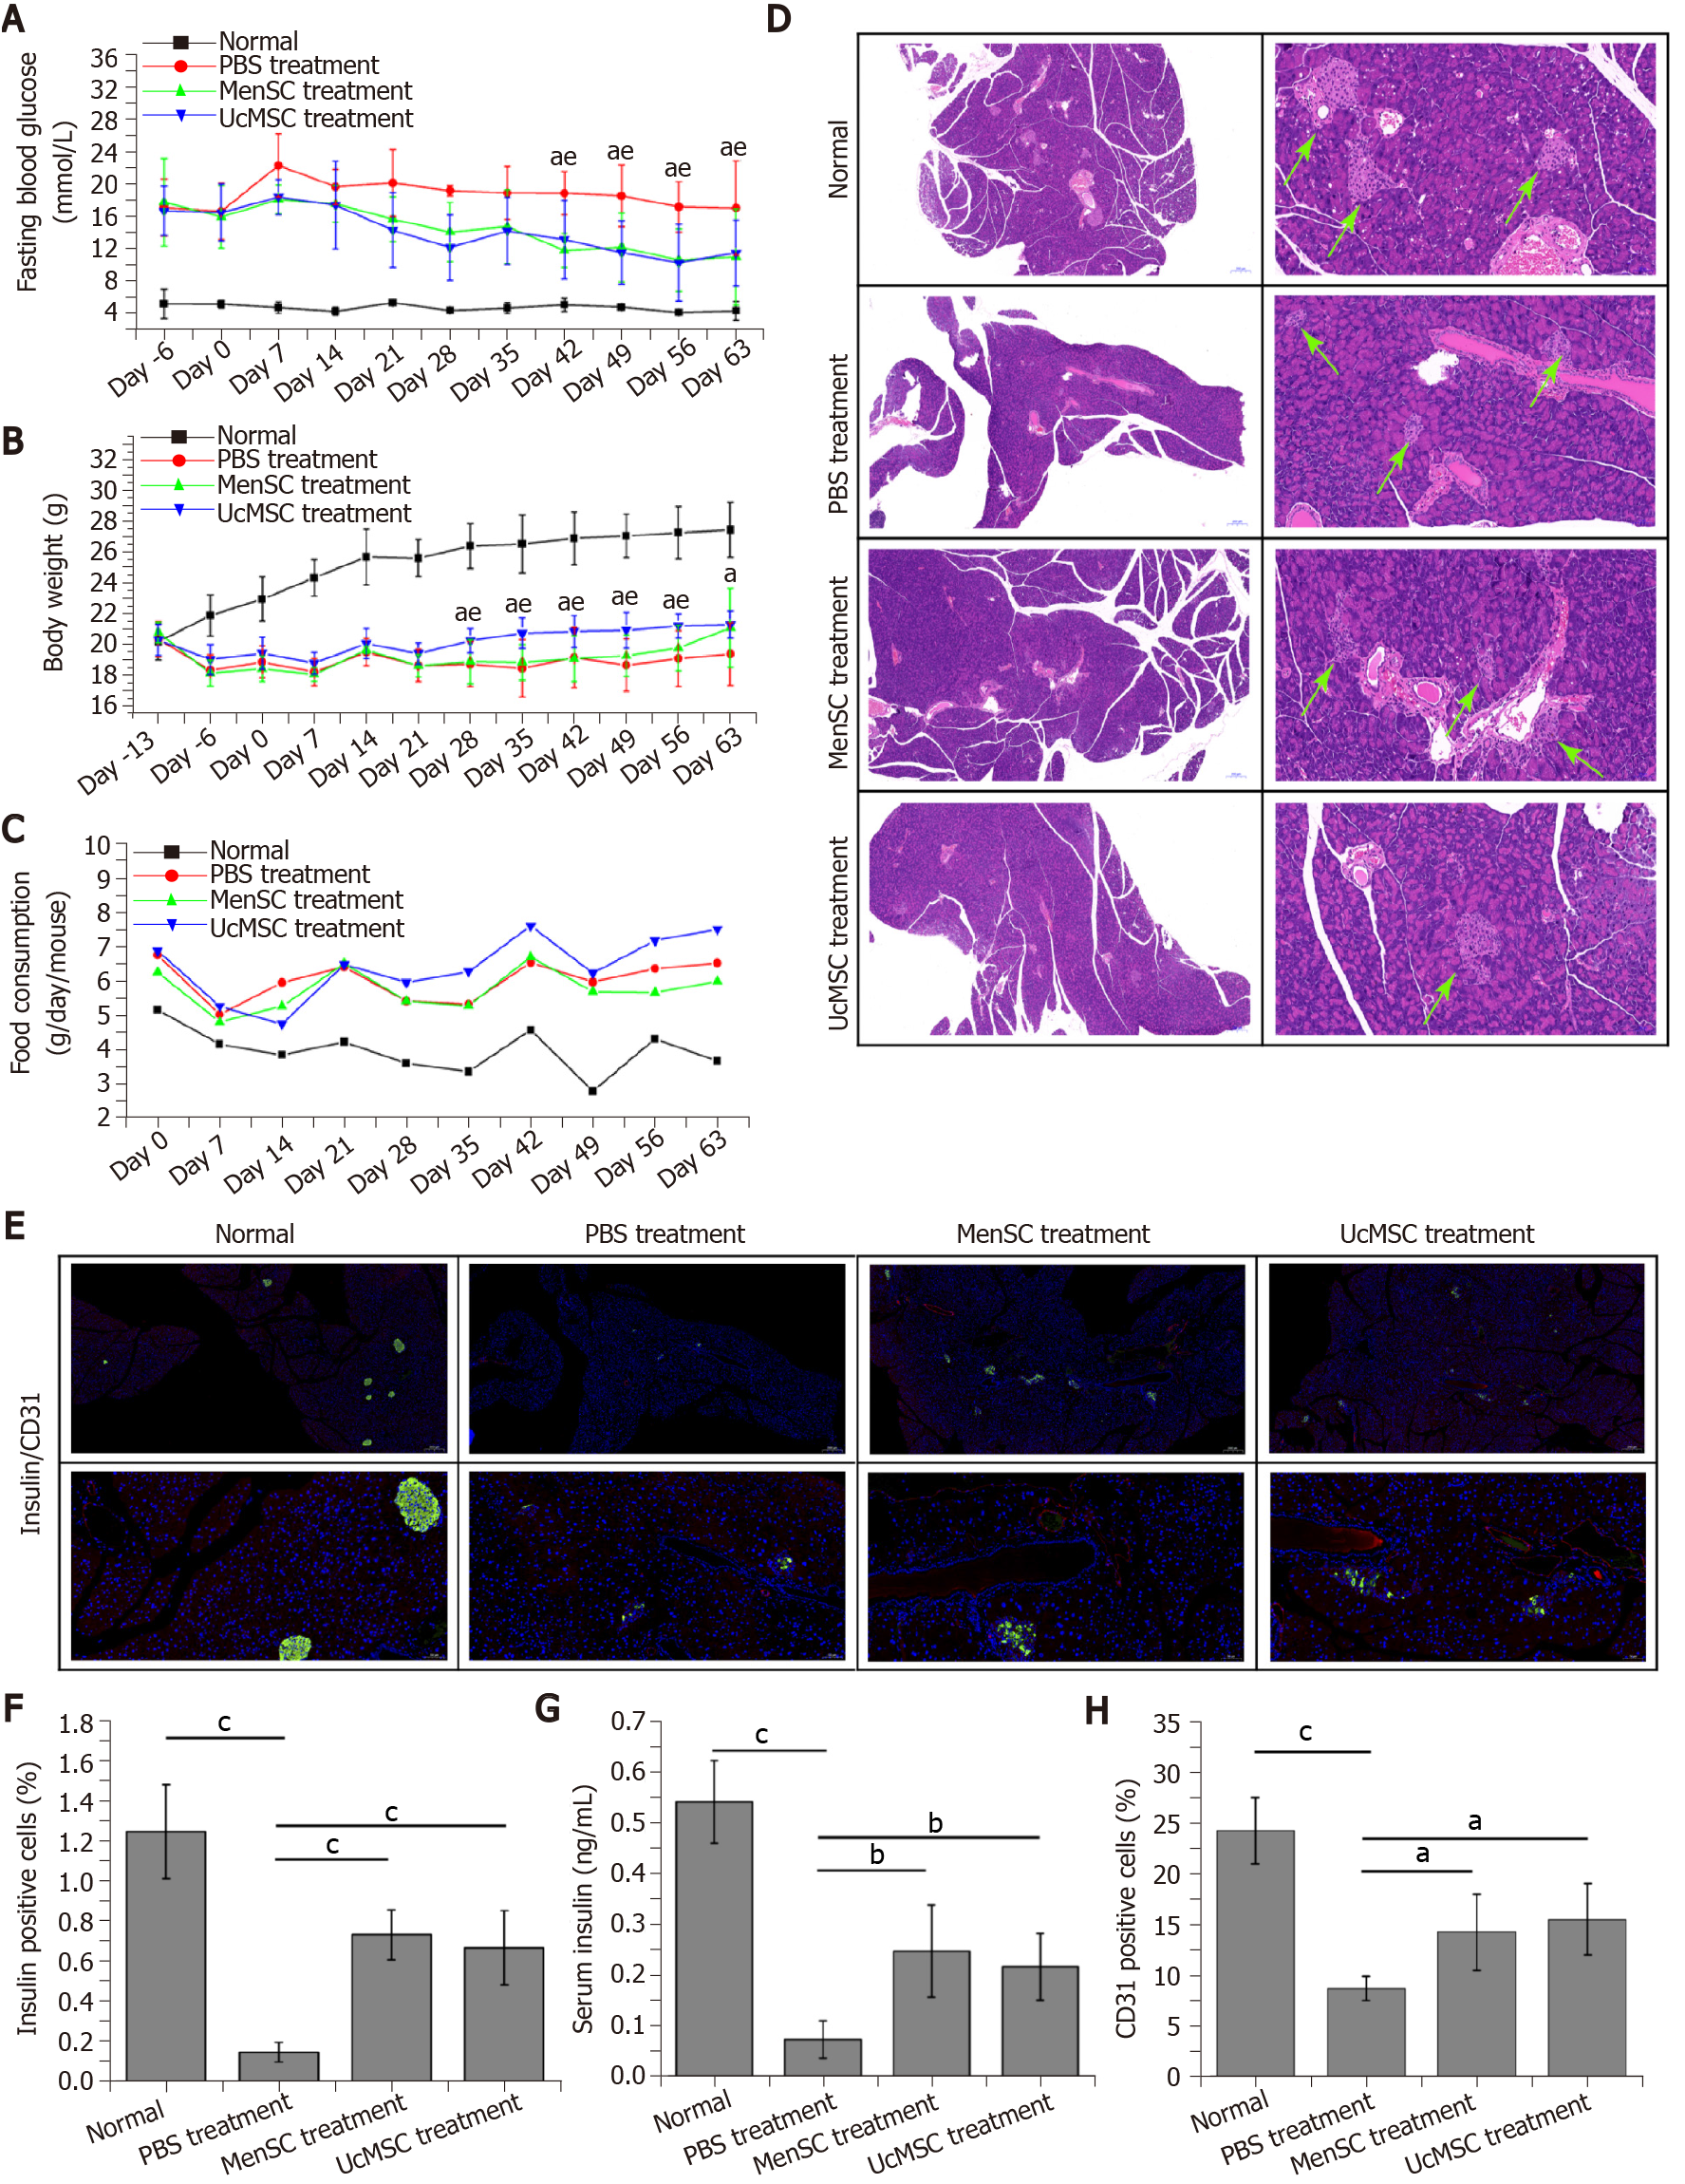
Figure 2 Menstrual blood-derived endometrial stem cells transplantation significantly improves the morphology and function of the pancreas in streptozotocin-induced type 1 diabetes mice.
A: Both Menstrual blood-derived endometrial stem cells Menstrual blood-derived endometrial stem cells (MenSC) and Umbilical cord-derived mesenchymal stem cell (UcMSC) treatments significantly improved the fasting blood glucose levels. aP < 0.05 UcMSC treatment vs PBS treatment; eP < 0.05 MenSC treatment vs PBS treatment; B and C: UcMSC treatment significantly inhibited the body weight loss and increased the food intake in streptozotocin-induced type 1 diabetes mice. aP < 0.05 UcMSC treatment vs PBS treatment; eP < 0.05 UcMSC treatment vs MenSC treatment; D: Morphological changes in the pancreases of mice were examined by hematoxylin and eosin staining, and the islets are indicated by green arrows. The images in the left column provide a full view of the pancreas, and the images in the right column are locally magnified; E, F and H: Insulin+ (green fluorescence) and CD31+ (red fluorescence) cells in the mouse pancreas were detected by immunofluorescence and quantified by IPP software. The images in the top row provide a full view of the pancreases, and the images in the bottom row are locally magnified; G: The serum insulin levels in the mice were determined by ELISA. aP < 0.05; bP < 0.01; cP < 0.001. MSC: Mesenchymal stem cell; UcMSC: Umbilical cord-derived MSC; MenSC: Menstrual blood-derived endometrial stem cells.
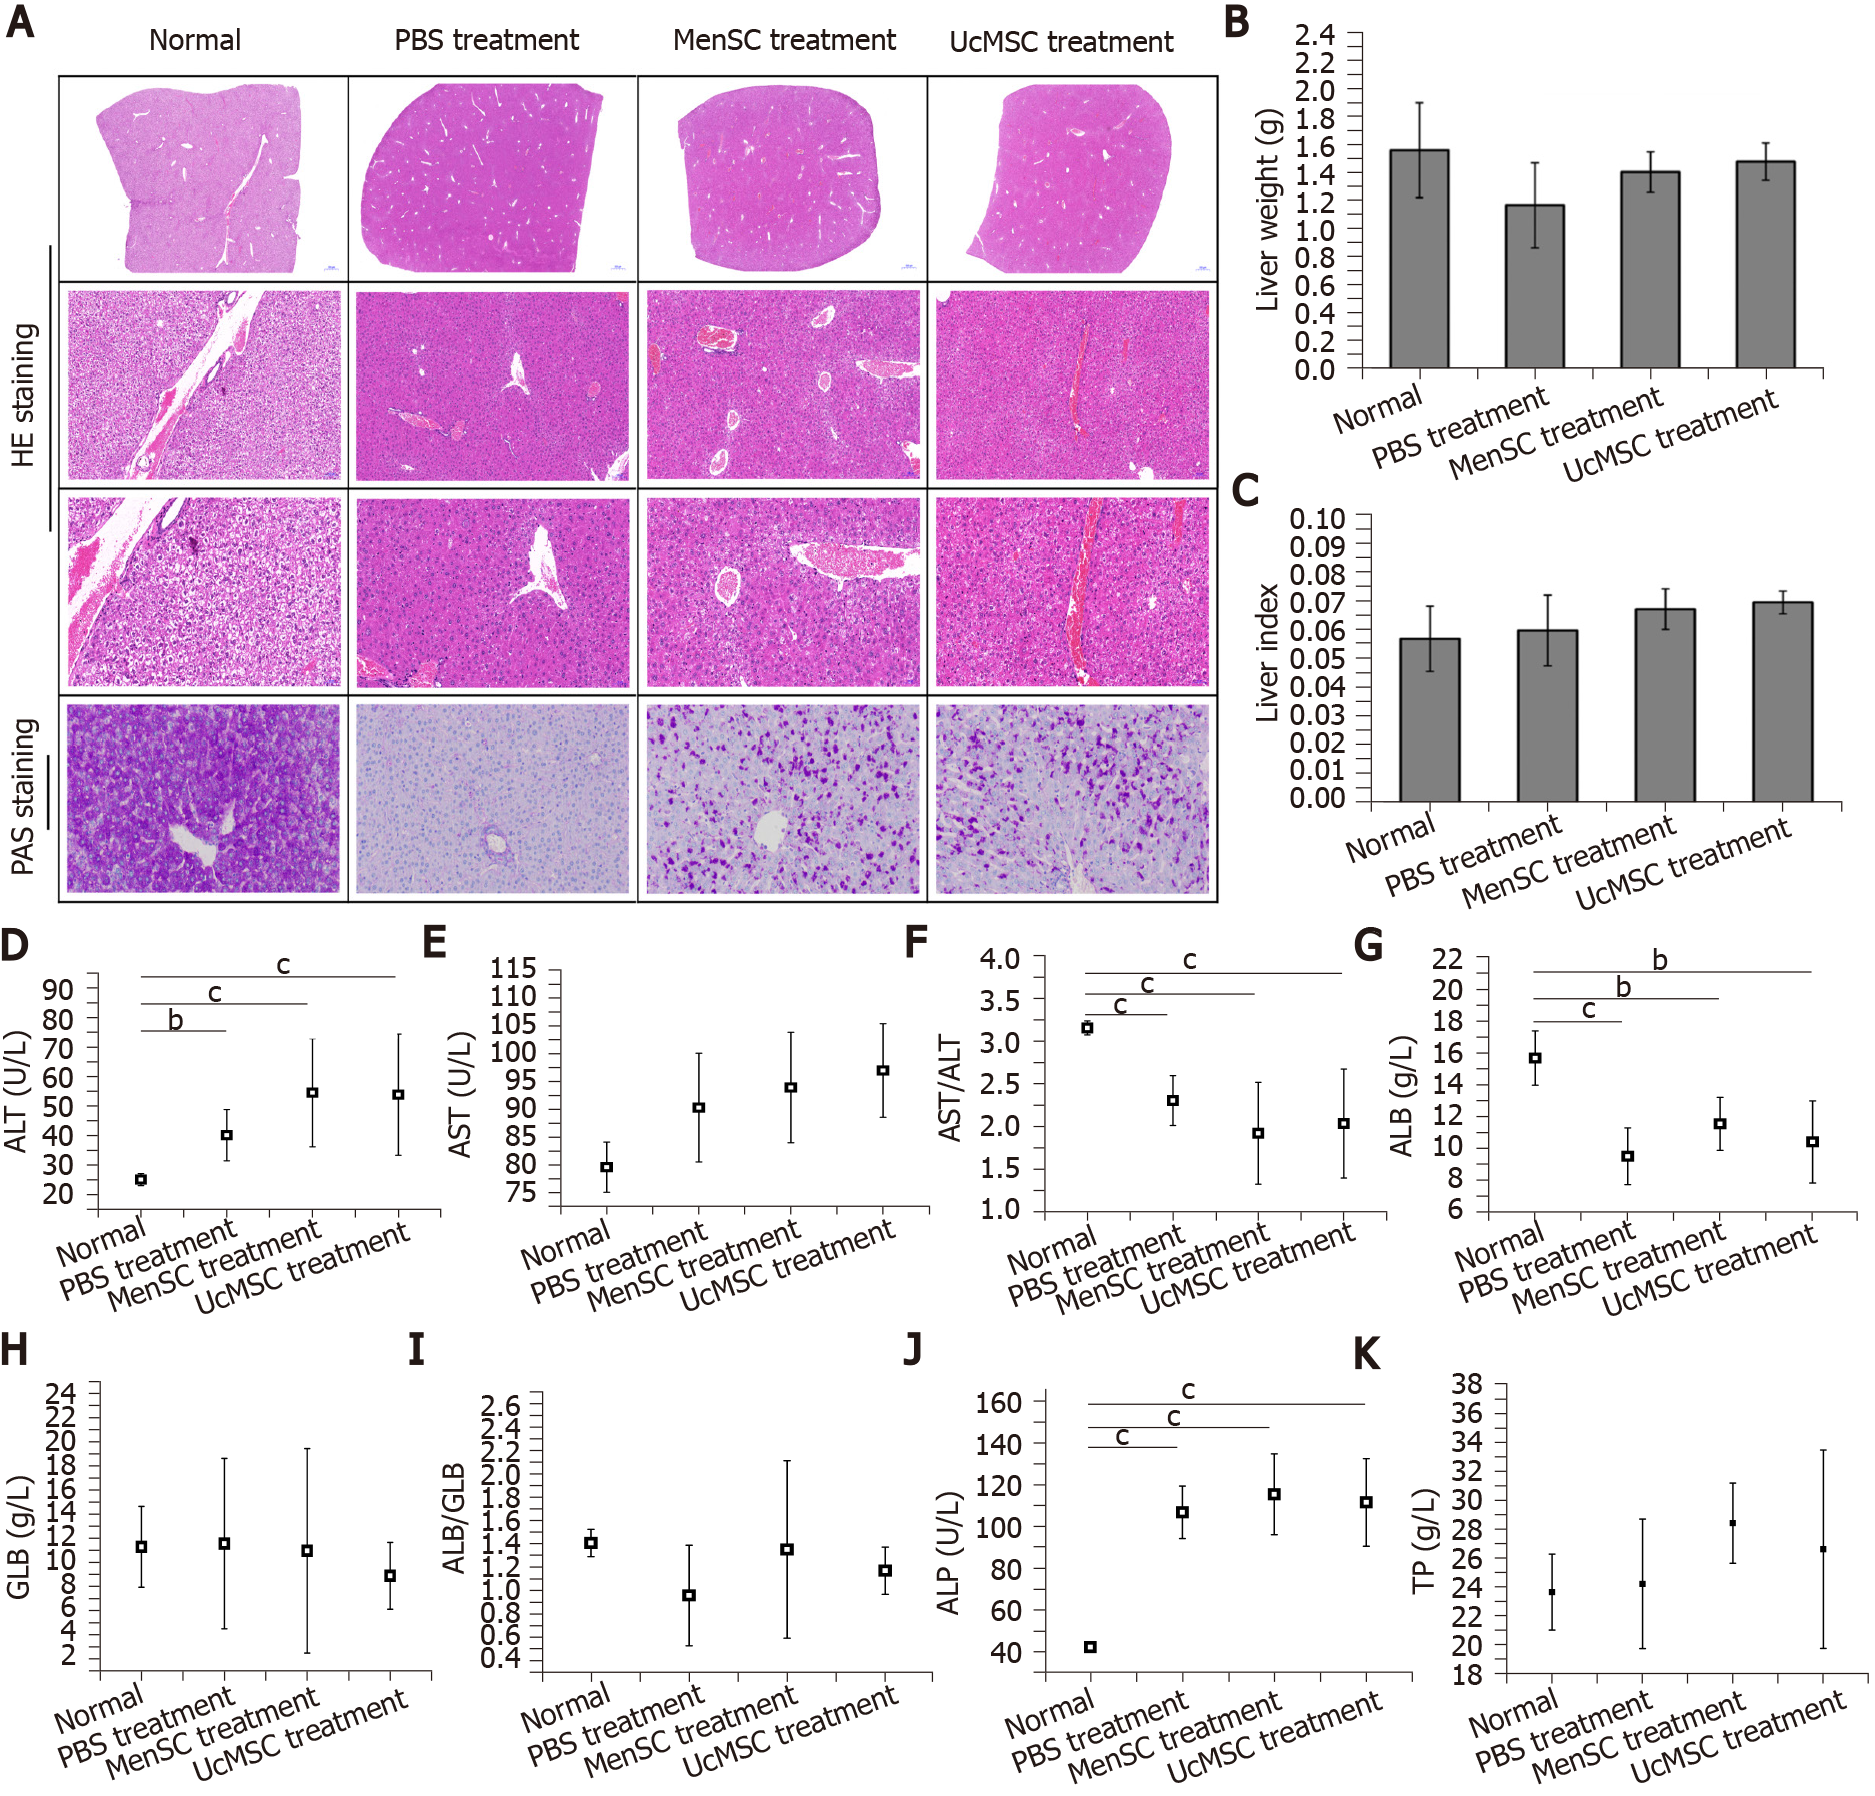
Figure 3 Morphological and functional improvements in the livers of streptozotocin-induced type 1 diabetes mice after mesenchymal stem cell transplantation.
A: Morphological changes in the livers of mice were examined by hematoxylin and eosin staining (the images in the top row provide a full view of the livers, and the images in the middle row are locally magnified), and the capacity for glycogen synthesis and storage in the livers was determined by Periodic Acid-Schiff staining; B and C: Mesenchymal stem cell treatment had no obvious effect on the liver weights or liver indexes in streptozotocin-induced type 1 diabetes mice; D-K: The activities of alanine transaminase and aspartic acid transaminase in the mouse serum were examined, and the concentrations of albumin, globulin, total protein, and alkaline phosphatase in the serum were measured. aP < 0.05; bP < 0.01; cP < 0.001. MSC: Mesenchymal stem cell; UcMSC: Umbilical cord-derived MSC; MenSC: Menstrual blood-derived endometrial stem cells; UA: Uric acid; CRE: Creatinine; HE: Hematoxylin and eosin; PAS: Periodic Acid-Schiff; ALT: Alanine transaminase; AST: Aspartic acid transaminase; ALP: Alkaline phosphatase; ALB: Albumin; GLB: Globulin; TP: Total protein.
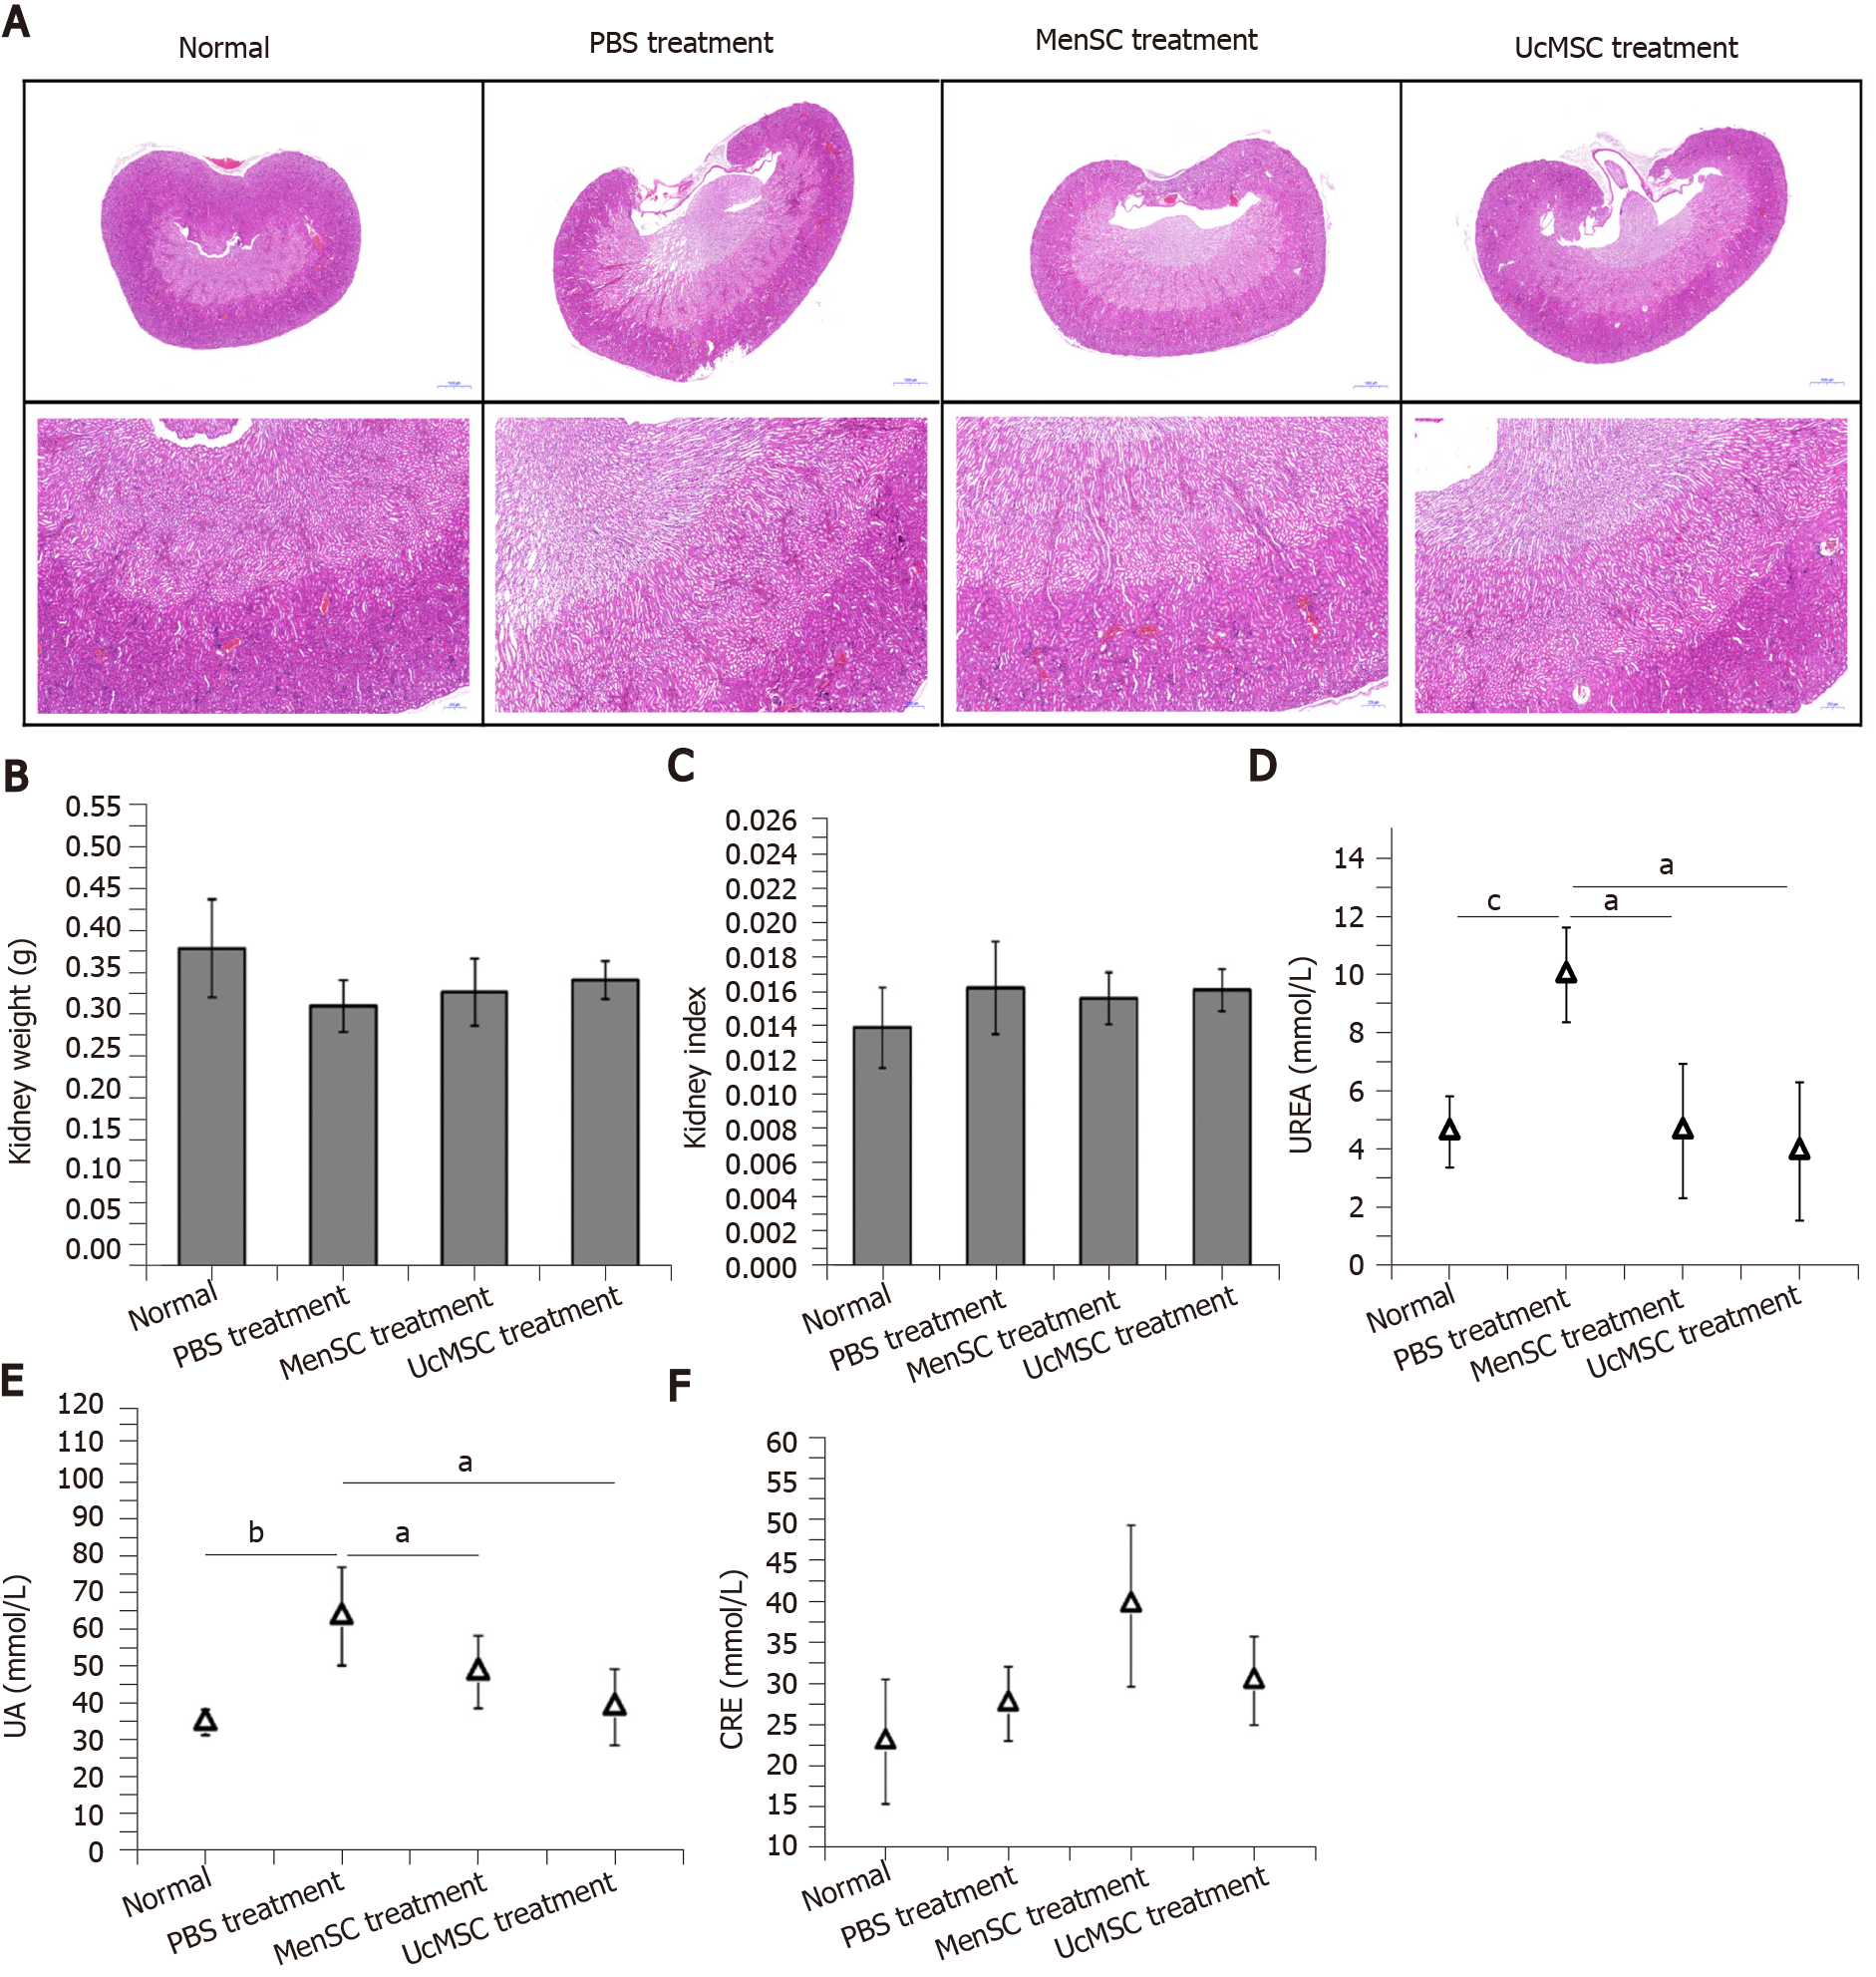
Figure 4 Morphological and functional differences in the kidneys of streptozotocin-induced type 1 diabetes mice after mesenchymal stem cell transplantation.
A: Morphological changes in the kidneys of mice were examined by hematoxylin and eosin staining. The images in the top row provide a full view of the kidneys, and the images in the bottom row are locally magnified; B and C: Mesenchymal stem cell treatment had no obvious effect on the kidney weights or kidney indexes of streptozotocin-induced type 1 diabetes mice; D-F: The serum concentrations of UREA, uric acid, and creatinine in the mice were measured. aP < 0.05; bP < 0.01; cP < 0.001. MSC: Mesenchymal stem cell; UcMSC: Umbilical cord-derived MSC; MenSC: Menstrual blood-derived endometrial stem cells; UA: Uric acid; CRE: Creatinine.
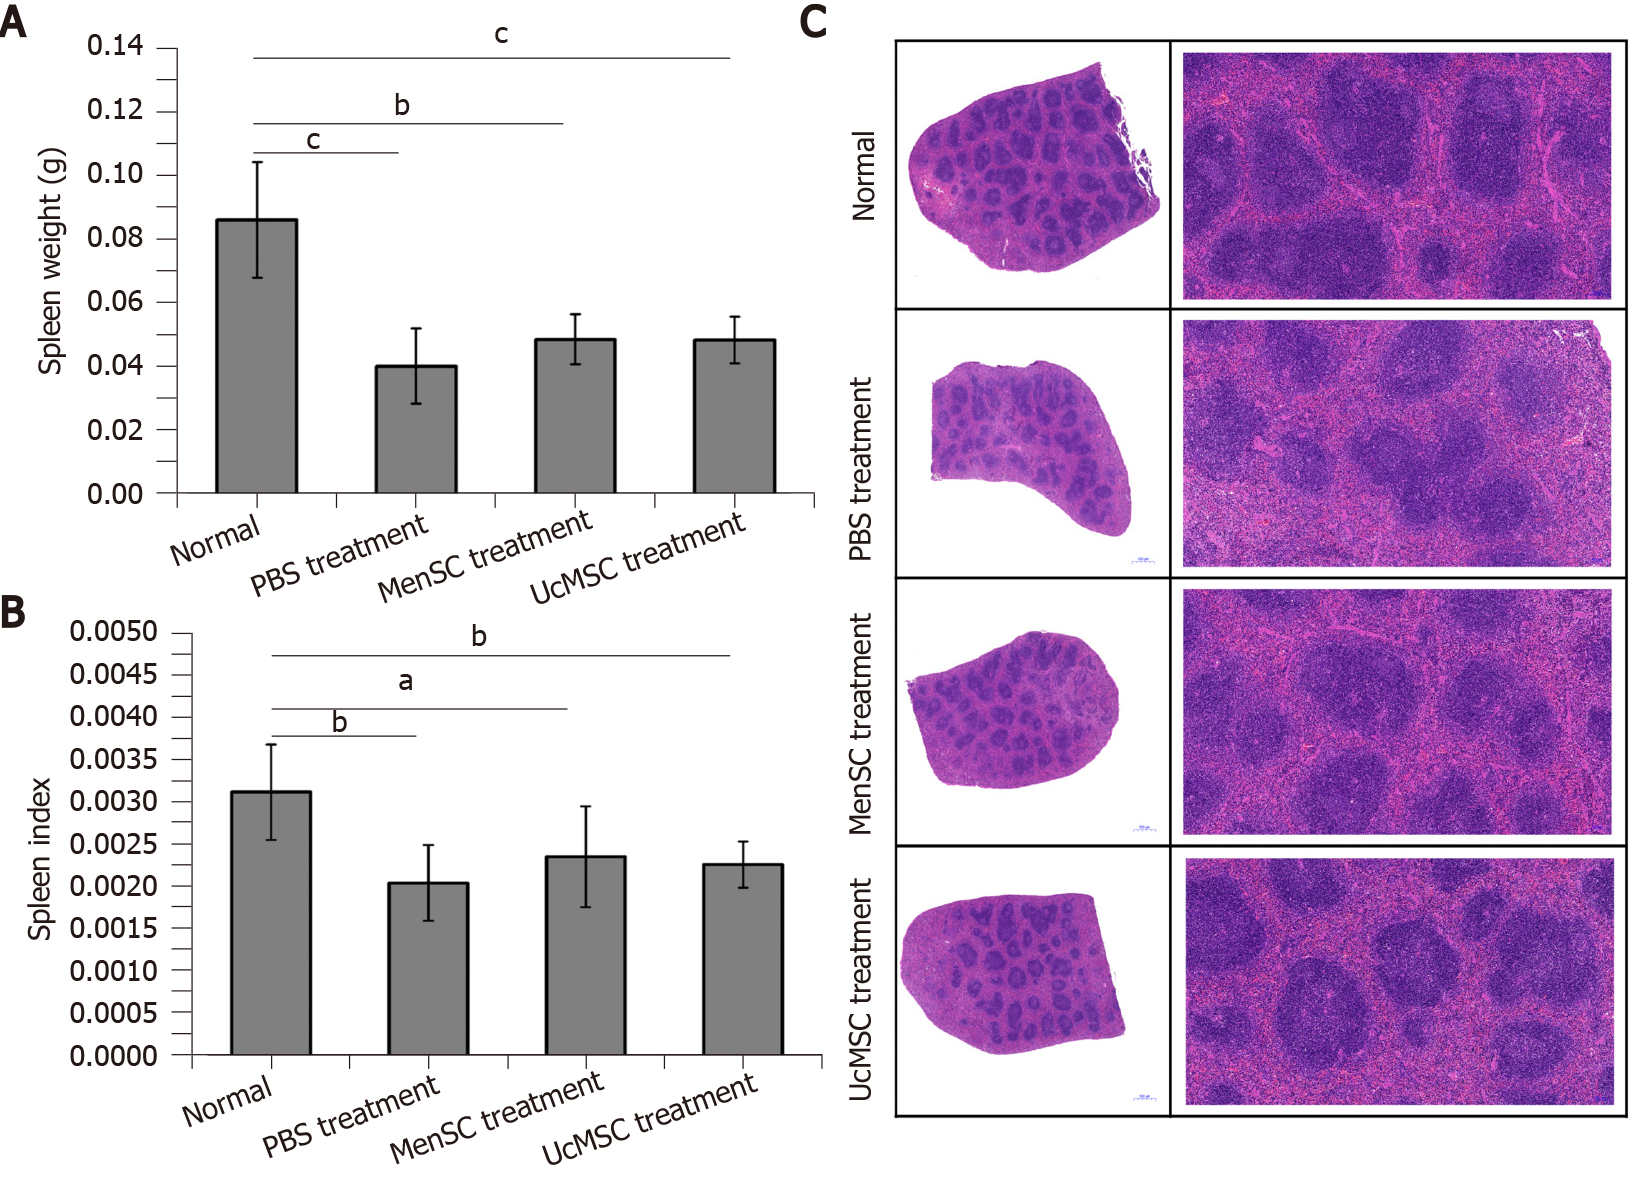
Figure 5 Morphological differences in the spleens of streptozotocin-induced type 1 diabetes mice after mesenchymal stem cell transplantation.
A and B: Mesenchymal stem cell treatment did not significantly increase the spleen weights or spleen indexes in streptozotocin-induced type 1 diabetes mice; C: Morphological changes in the spleens of mice were examined by hematoxylin and eosin staining. The images in the left column provide a full view of spleens, and the images in the right column are locally magnified. aP < 0.05; bP < 0.01; cP < 0.001. MSC: Mesenchymal stem cell; UcMSC: Umbilical cord-derived MSC; MenSC: Menstrual blood-derived endometrial stem cells.
- Citation: Sun YL, Shang LR, Liu RH, Li XY, Zhang SH, Ren YK, Fu K, Cheng HB, Yahaya BH, Liu YL, Lin JT. Therapeutic effects of menstrual blood-derived endometrial stem cells on mouse models of streptozotocin-induced type 1 diabetes. World J Stem Cells 2022; 14(1): 104-116
- URL: https://www.wjgnet.com/1948-0210/full/v14/i1/104.htm
- DOI: https://dx.doi.org/10.4252/wjsc.v14.i1.104


