Copyright
©The Author(s) 2015.
World J Gastroenterol. Jan 28, 2015; 21(4): 1108-1116
Published online Jan 28, 2015. doi: 10.3748/wjg.v21.i4.1108
Published online Jan 28, 2015. doi: 10.3748/wjg.v21.i4.1108
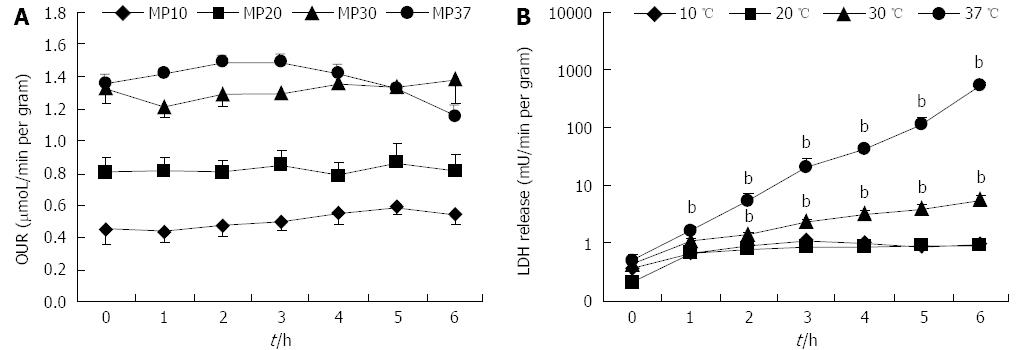
Figure 1 Liver oxygen uptake rate and lactate dehydrogenase release rate in rat livers perfused for 6.
A: OUR; and B: Lactate-dehydrogenase (LDH) release rate over 6 h of perfusion at 10, 20, 30 or 37 °C (n = 6/group; bP < 0.01 vs 20 °C). OUR: Oxygen uptake rate.
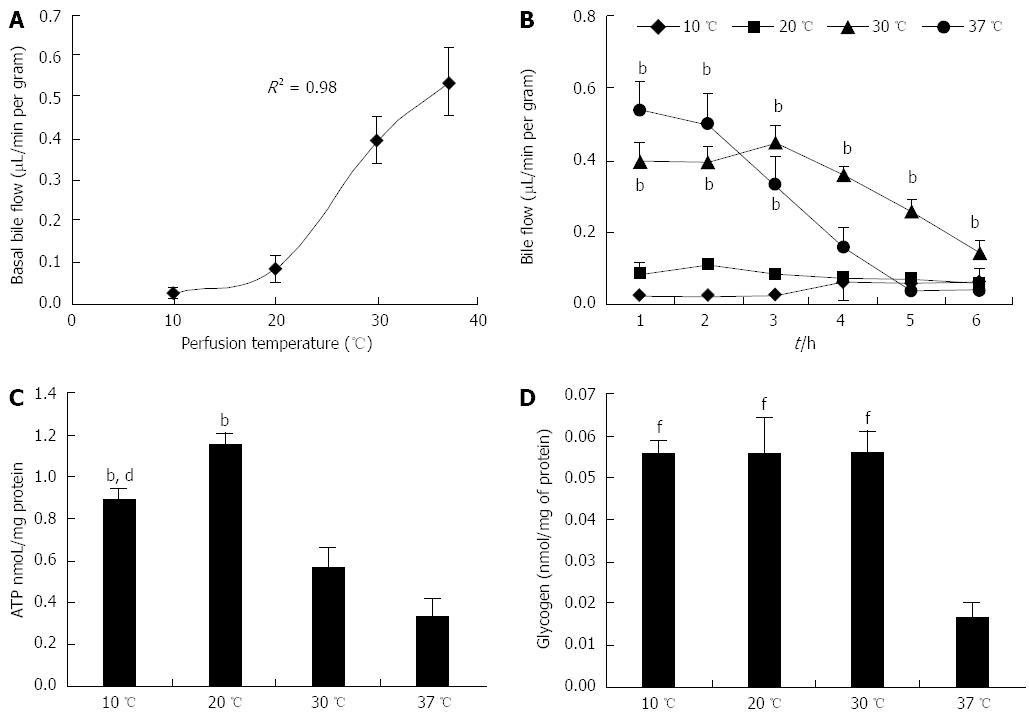
Figure 2 Bile flow, ATP and glycogen levels in rat livers perfused for 6 h.
A: Basal bile flow; B: Bile flow during perfusion; C: ATP content; and D: Glycogen content in livers perfused for 6 h at 10, 20, 30 or 37 °C (n = 6/group; B: bP < 0.01 vs 10 and 20 °C; C: bP < 0.01 vs 30 and 37 °C, dP < 0.01 vs 20 °C; D: fP < 0.01 vs 37 °C).
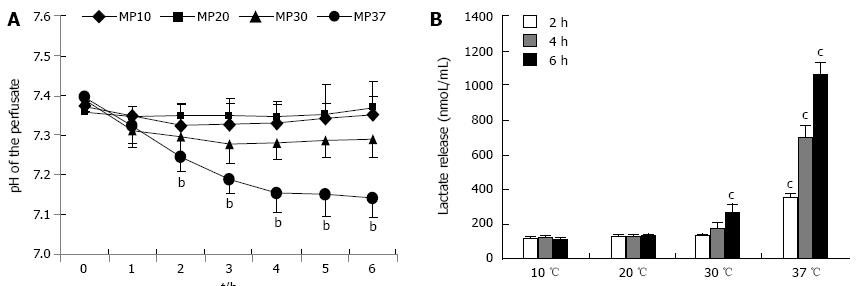
Figure 3 pH levels and lactate release in rat livers perfused for 6 h.
A: Normalized pH; B: Lactic acid release in livers perfused for 6 h at 10, 20, 30 or 37 °C (n = 6/group; bP < 0.01 vs 10 and 20 °C; cP < 0.05 vs 10 and 20 °C).
Figure 4 Hepatic hypoxia inducible factor-1α expression in rat livers perfused for 6 h.
A: mRNA; and B: Protein expression of hypoxia inducible factor (HIF)-1α in livers perfused for 6 h at 10, 20, 30 or 37 °C (n = 6/group; aP < 0.05, bP < 0.01 vs 10 and 20 °C; cP < 0.05 vs 10 and 20 °C).
- Citation: Ferrigno A, Pasqua LGD, Bianchi A, Richelmi P, Vairetti M. Metabolic shift in liver: Correlation between perfusion temperature and hypoxia inducible factor-1α. World J Gastroenterol 2015; 21(4): 1108-1116
- URL: https://www.wjgnet.com/1007-9327/full/v21/i4/1108.htm
- DOI: https://dx.doi.org/10.3748/wjg.v21.i4.1108


