Published online Sep 6, 2021. doi: 10.12998/wjcc.v9.i25.7365
Peer-review started: April 8, 2021
First decision: April 28, 2021
Revised: July 3, 2021
Accepted: July 28, 2021
Article in press: July 28, 2021
Published online: September 6, 2021
Processing time: 144 Days and 22.1 Hours
With the development of the economy and improvements in living standards, the incidences of diabetes mellitus (DM) and diabetic retinopathy (DR), which is a complication of DM, are on the rise.
To analyze early DR in patients with macular zone changes in biological images using optical coherence tomography angiography
A prospective case study was performed on 59 participants: 35 healthy eyes (control group), 35 eyes with diabetes but no DR group (no DR group), and 35 eyes with mild DR (NPDR group). All quantitative comparisons of parameters, including the fovea vascularity area, circularity index, and vascular complexity parameters, were performed using a biological image analysis software.
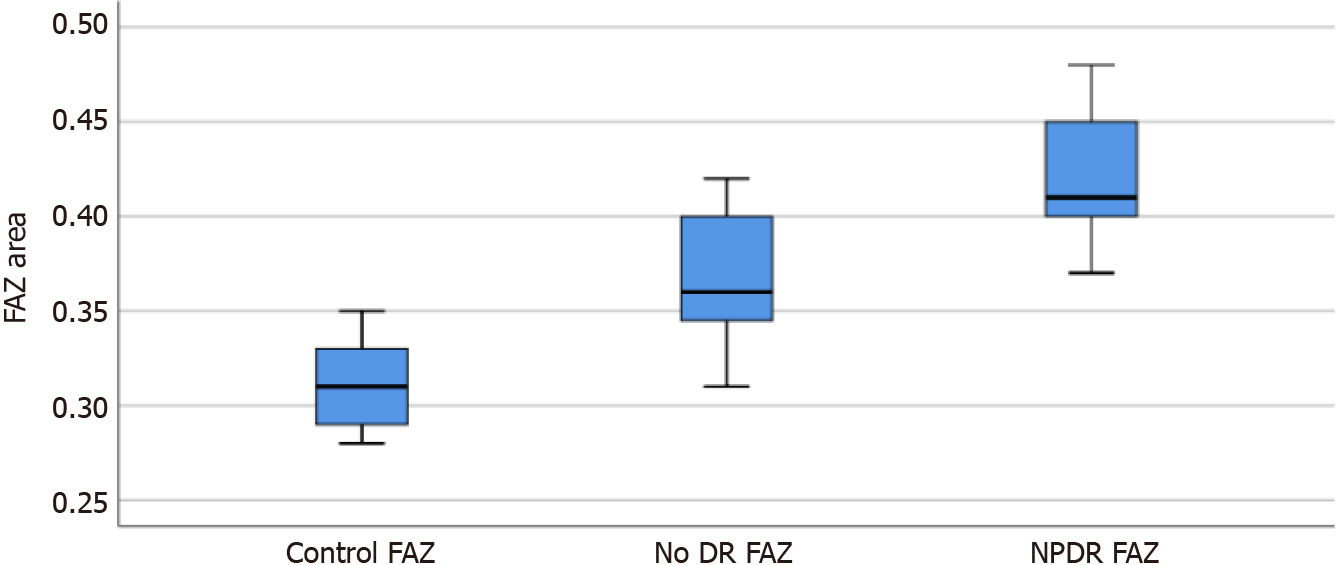
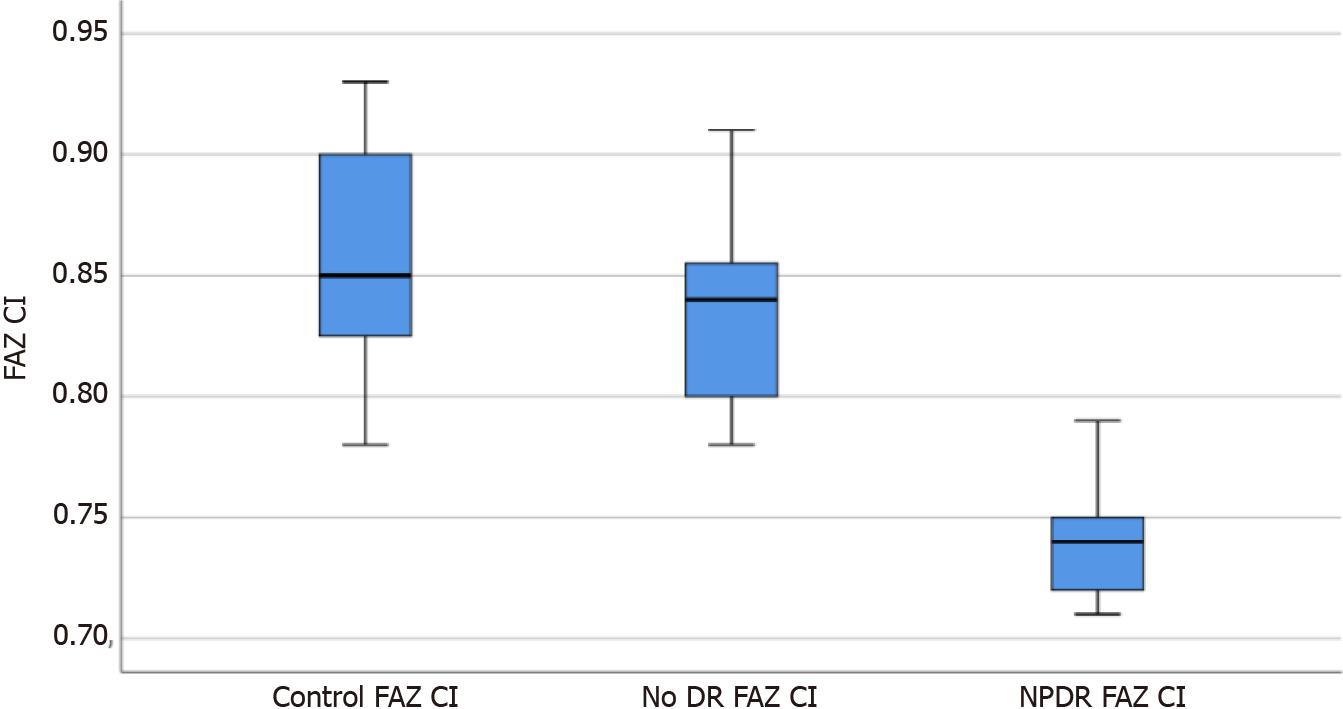
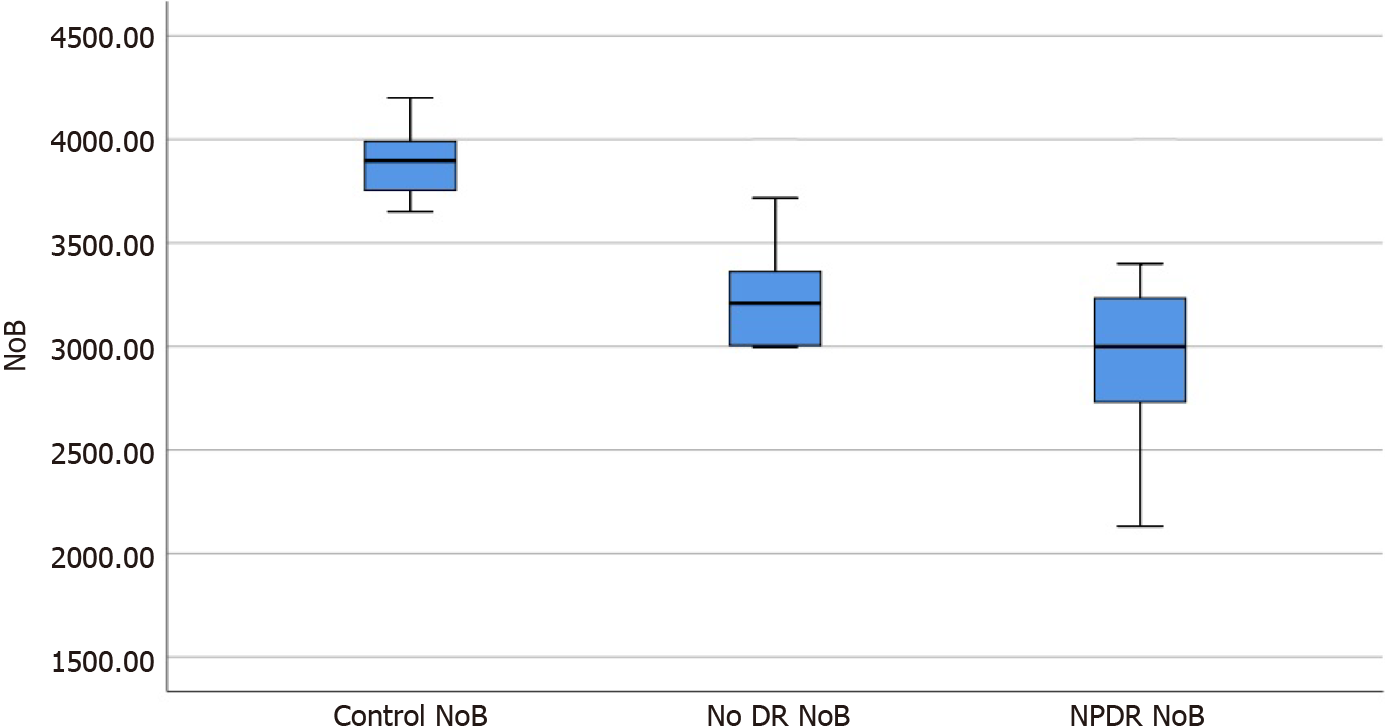
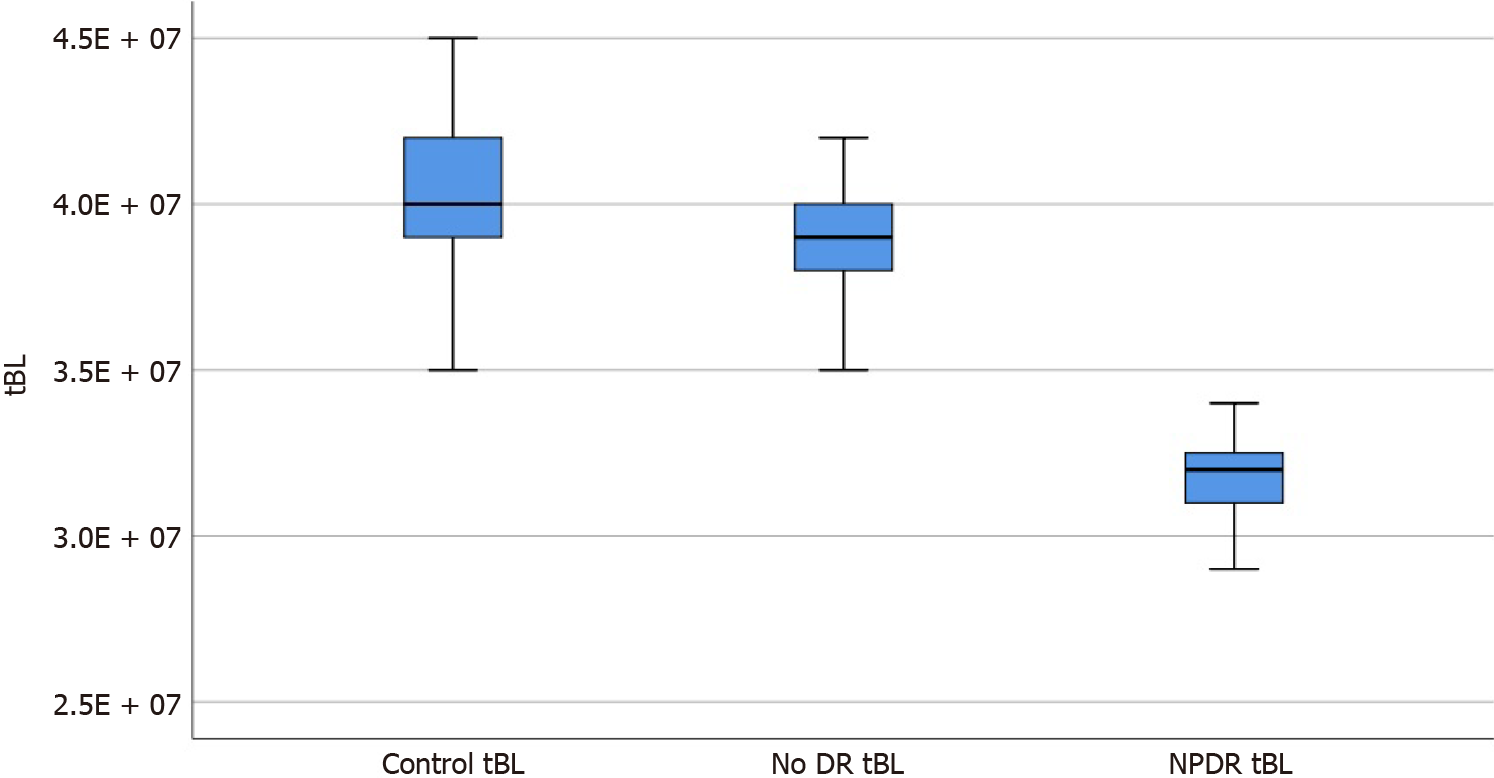
The foveal avascular zone (FAZ) area, FAZ circularity index, number of branches in the area, and the total of the single branches’ length in the area was 0.366 ± 0.031, 0.834 ± 0.037, 3241.8 ± 268.3, and 3.860 × 10⁷ ± 0.194 × 10⁷, and 0.421 ± 0.030, 0.739 ± 0.023, 2956.6 ± 476.4, and 3.177 × 10⁷ ± 0.161 × 10⁷ in the no DR group and the NPDR group, respectively, which were significantly different from the corresponding parameters of the control group (P < 0.05). Moreover, there were signi
This study shows that early microcirculation changes in the macular area of the retina is associated with disease progression. Early changes in DR can be analyzed using optical coherence tomography angiography.
Core Tip: Optical coherence tomography angiography has the advantage of being rapid, noninvasive, high-resolution, repeatable, and consistent. It can also be used as an early fundus screening method for patients with diabetes mellitus.
- Citation: Shi Y, Lin PY, Ruan YM, Lin CF, Hua SS, Li B. Quantitative analysis of early diabetic retinopathy based on optical coherence tomography angiography biological image. World J Clin Cases 2021; 9(25): 7365-7371
- URL: https://www.wjgnet.com/2307-8960/full/v9/i25/7365.htm
- DOI: https://dx.doi.org/10.12998/wjcc.v9.i25.7365
Diabetic retinopathy (DR) occurs in 24.8% to 37.5% of patients with diabetes mellitus (DM) in China according to the latest epidemiological survey data from the International Diabetes Federation. With the development of the economy and improvements in living standards, the incidence of DM and DR, which is a complication of DM, are on the rise[1]. DR is characterized by lesions caused by microvascular retinal damage. Macular ischemia is a significant feature of DR and is thought to be caused by oc
Fluorescein angiography is used to visualize the vascular structures in DR for sta
This was a prospective case study. There were 59 participants in this study. Thirty-eight patients with DM (70 eyes) underwent fundus fluorescein angiography (FFA) at Ningbo First Hospital from May 2019 to December 2019. The group included 18 male patients (35 eyes) and 20 female patients (35 eyes), aged 38-70 years (mean ± SD: 53.11 ± 6.21 years). There were 35 eyes that had no diabetic retinopathy (no DR) and 35 eyes that had non proliferative diabetic retinopathy (NPDR). Another 21 healthy subjects (35 eyes) with matched age participated as the control group and included 13 males (20 eyes) and 8 females (15 eyes), aged 36-63 years (mean ± SD: 53.11 ± 5.81 years).
Exclusion criteria were as follows: (1) Proliferative diabetic retinopathy observed on fundus examination after pupil dilatation; (2) Failure to cooperate with the required examination; (3) History of glaucoma and uveitis; (4) History of retinal photocoagulation, vitrectomy, and other intraocular surgery in any form; and (5) The refractive media was cloudy. In this study, all participants and their families were informed of the details of the study and signed an informed consent form. This study was appro
All selected participants underwent examination for best-corrected visual acuity and intraocular pressure (IOP), optometry, slit lamp examination, fundus examination, FFA, and OCTA (Heidelberg Engineering, Germany). Both FFA and OCTA were performed on the same day by the same ophthalmologist. DR staging was confirmed by FFA and confirmed by another ophthalmologist. Before OCTA, the participants’ pupils were dilated with compound tropicamide eye drops for about 30 min, with the pupils dilated to at least 5 mm. Participants were asked to sit in front of the OCTA instrument, and a series of OCTA images were collected.
The software used was ImageJ analysis (version 1.52 p, http://imagej.nih.gov/ij/; Provided in the public Domain by the National Institutes of Health, Bethesda, MD, United States)[6]. The superficial plexus (SCP) indexes were used in this study because the foveal avascular zone (FAZ) is more superficial and more abstract. SCP imaging and selection tool were used to draw the outline of the FAZ manually, and the circumference and area of FAZ were calculated automatically by this software. Then the circularity index (CI) of FAZ was measured using the following formula: FAZ CI = (4π x area)/(circumference)2. CI is the expression of shape regularity, and the closer its value is to 1, the more similar its shape is[7]. The images were converted to 8-bit, subjected to binarization, and skeletonized for image skeletal analysis, focusing on two parameters: number of branches in the area (NoB) and total of the single branches’ length in the area (tBL)[8].
All data were analyzed using SPSS 25.0, and variable data are presented as mean ± SD. A one-way ANOVA was used for each variable, and a Scheffe test was used for comparison among groups. Statistical significance was set at P < 0.05.
There were no statistically significant differences in age, sex, IOP, or visual acuity between the groups (P > 0.05).
All parameters of the no DR group and the NPDR group were significantly different from those of the control group (F = 136.94, 105.41, 74.96, 130.22, P = 0.000, 0.000; P = 0.035, 0.000; P = 0.000, 0.000; P = 0.033, 0.000), and there were significant differences in parameters between the no DR and NPDR groups (P = 0.000, 0.000, and 0.002; Table 1).
The box diagrams in Figures 1-4 indicate that the FAZ area gradually increased with the development of DR, while FAZ CI, NoB, and tBL gradually decreased with the development of DR.
OCTA is a newly introduced clinical method that can provide a detailed image of the retinal microvascular system by segmenting the retinal vascular layers. It is a no
Recently, Gildea[9] published a review of the diagnostic value of OCTA in evalu
Recently, different quantitative methods for the evaluation of roundness of the FAZ in patients with DM have been proposed[15,16]. In this study, CI was an early parameter for FAZ variation in the SCP. From the control group to the no DR and DR groups, there was a significant downward trend in CI, indicating that with the progression of retinal microvascular injury caused by diabetes, the regularity of the FAZ gradually changed significantly in patients with DM compared with that in the control participants.
In this study, we found that compared with the values in the control group, NoB and tBL in the macular area in the NPDR group were significantly decreased. The findings were consistent with the conclusion of Stela V[17], where the same method was used to study the area around the optic disc in patients with DM. They found that patients with DM without clinical DR symptoms had a significant reduction in the area around the optic discs compared with that in healthy participants. Therefore, we believe that the decrease in NoB and tBL may be due to the loss of small branch vessels, which leads to a reduction in retinal branch complexity[18]. Additionally, these findings support the hypothesis that the complexity of the microvascular network decreases gradually as DR severity increases[18].
This study had some limitations. OCTA cannot be applied to all patients with DR, as patients need to have a clear refractive media and good vision. Thus, it is challenging to perform in patients with poor vision, such as those with PDR. A larger sample size is also needed to understand better the exact extent of microvascular damage in the early stages of DR.
In summary, this study shows that in patients with DM, fundus lesions with vascular parameters were visible through quantitative OCTA analysis before microcirculation changes in the macular area. OCTA is a new screening tool for patients with DM, and timely monitoring of clinical fundus changes before disease progression might allow for early diagnosis and treatment of DR.
According to the latest epidemiological survey data from the International Diabetes Federation, diabetic retinopathy (DR) occurs in 24.8% to 37.5% of patients with diabetes mellitus (DM) in China.
The early prevention and treatment of DR are challenging and are urgent problems to be solved.
Optical coherence tomography angiography (OCTA) was used to evaluate the macular area and demonstrate that it can be used as an early fundus screening method for patients with DM.
All selected participants underwent examination for best-corrected visual acuity and intraocular pressure, optometry, slit lamp examination, fundus examination, fundus fluorescein angiography, and OCTA (Heidelberg Engineering, Germany).
The values of the foveal avascular zone (FAZ), FAZ circularity index, number of branches in the area, and the total of the single branches’ length in the area of the no DR group and the NPDR groups were statistically different from the control group. The said parameters are also statistically different between the two groups.
OCTA is a new screening tool for patients with DM, and timely monitoring of clinical fundus changes before disease progression might allow for early diagnosis and treat
A novel approach provides novel insights for the diagnosis and treatment of diseases.
Manuscript source: Unsolicited manuscript
Specialty type: Ophthalmology
Country/Territory of origin: China
Peer-review report’s scientific quality classification
Grade A (Excellent): 0
Grade B (Very good): 0
Grade C (Good): C
Grade D (Fair): 0
Grade E (Poor): 0
P-Reviewer: Cankurtaran V S-Editor: Yan JP L-Editor: A P-Editor: Yuan YY
| 1. | Cao D, Yang D, Yu H, Xie J, Zeng Y, Wang J, Zhang L. Optic nerve head perfusion changes preceding peripapillary retinal nerve fibre layer thinning in preclinical diabetic retinopathy. Clin Exp Ophthalmol. 2019;47:219-225. [RCA] [PubMed] [DOI] [Full Text] [Cited by in Crossref: 49] [Cited by in RCA: 50] [Article Influence: 8.3] [Reference Citation Analysis (0)] |
| 2. | Spaide RF, Klancnik JM Jr, Cooney MJ. Retinal vascular layers imaged by fluorescein angiography and optical coherence tomography angiography. JAMA Ophthalmol. 2015;133:45-50. [RCA] [PubMed] [DOI] [Full Text] [Cited by in Crossref: 1007] [Cited by in RCA: 1067] [Article Influence: 106.7] [Reference Citation Analysis (0)] |
| 3. | Noordzij MJ, Mulder DJ, Oomen PH, Brouwer T, Jager J, Castro Cabezas M, Lefrandt JD, Smit AJ. Skin autofluorescence and risk of micro- and macrovascular complications in patients with Type 2 diabetes mellitus-a multi-centre study. Diabet Med. 2012;29:1556-1561. [RCA] [PubMed] [DOI] [Full Text] [Cited by in Crossref: 61] [Cited by in RCA: 72] [Article Influence: 5.5] [Reference Citation Analysis (0)] |
| 4. | Varma R, Bressler NM, Doan QV, Gleeson M, Danese M, Bower JK, Selvin E, Dolan C, Fine J, Colman S, Turpcu A. Prevalence of and risk factors for diabetic macular edema in the United States. JAMA Ophthalmol. 2014;132:1334-1340. [RCA] [PubMed] [DOI] [Full Text] [Cited by in Crossref: 204] [Cited by in RCA: 278] [Article Influence: 27.8] [Reference Citation Analysis (0)] |
| 5. | Mastropasqua R, Toto L, Mastropasqua A, Aloia R, De Nicola C, Mattei PA, Di Marzio G, Di Nicola M, Di Antonio L. Foveal avascular zone area and parafoveal vessel density measurements in different stages of diabetic retinopathy by optical coherence tomography angiography. Int J Ophthalmol. 2017;10:1545-1551. [RCA] [PubMed] [DOI] [Full Text] [Cited by in Crossref: 13] [Cited by in RCA: 49] [Article Influence: 6.1] [Reference Citation Analysis (0)] |
| 6. | Schindelin J, Arganda-Carreras I, Frise E, Kaynig V, Longair M, Pietzsch T, Preibisch S, Rueden C, Saalfeld S, Schmid B, Tinevez JY, White DJ, Hartenstein V, Eliceiri K, Tomancak P, Cardona A. Fiji: an open-source platform for biological-image analysis. Nat Methods. 2012;9:676-682. [RCA] [PubMed] [DOI] [Full Text] [Cited by in Crossref: 32937] [Cited by in RCA: 40903] [Article Influence: 3146.4] [Reference Citation Analysis (0)] |
| 7. | Mancia G, Fagard R, Narkiewicz K, Redon J, Zanchetti A, Böhm M, Christiaens T, Cifkova R, De Backer G, Dominiczak A, Galderisi M, Grobbee DE, Jaarsma T, Kirchhof P, Kjeldsen SE, Laurent S, Manolis AJ, Nilsson PM, Ruilope LM, Schmieder RE, Sirnes PA, Sleight P, Viigimaa M, Waeber B, Zannad F, Burnier M, Ambrosioni E, Caufield M, Coca A, Olsen MH, Tsioufis C, van de Borne P, Zamorano JL, Achenbach S, Baumgartner H, Bax JJ, Bueno H, Dean V, Deaton C, Erol C, Ferrari R, Hasdai D, Hoes AW, Knuuti J, Kolh P, Lancellotti P, Linhart A, Nihoyannopoulos P, Piepoli MF, Ponikowski P, Tamargo JL, Tendera M, Torbicki A, Wijns W, Windecker S, Clement DL, Gillebert TC, Rosei EA, Anker SD, Bauersachs J, Hitij JB, Caulfield M, De Buyzere M, De Geest S, Derumeaux GA, Erdine S, Farsang C, Funck-Brentano C, Gerc V, Germano G, Gielen S, Haller H, Jordan J, Kahan T, Komajda M, Lovic D, Mahrholdt H, Ostergren J, Parati G, Perk J, Polonia J, Popescu BA, Reiner Z, Rydén L, Sirenko Y, Stanton A, Struijker-Boudier H, Vlachopoulos C, Volpe M, Wood DA. 2013 ESH/ESC guidelines for the management of arterial hypertension: the Task Force for the Management of Arterial Hypertension of the European Society of Hypertension (ESH) and of the European Society of Cardiology (ESC). Eur Heart J. 2013;34:2159-2219. [RCA] [PubMed] [DOI] [Full Text] [Cited by in Crossref: 3156] [Cited by in RCA: 3233] [Article Influence: 269.4] [Reference Citation Analysis (0)] |
| 8. | Vujosevic S, Toma C, Villani E, Gatti V, Brambilla M, Muraca A, Ponziani MC, Aimaretti G, Nuzzo A, Nucci P, De Cilla' S. Early Detection of Microvascular Changes in Patients with Diabetes Mellitus without and with Diabetic Retinopathy: Comparison between Different Swept-Source OCT-A Instruments. J Diabetes Res. 2019;2019:2547216. [RCA] [PubMed] [DOI] [Full Text] [Full Text (PDF)] [Cited by in Crossref: 27] [Cited by in RCA: 46] [Article Influence: 7.7] [Reference Citation Analysis (0)] |
| 9. | Gildea D. The diagnostic value of optical coherence tomography angiography in diabetic retinopathy: a systematic review. Int Ophthalmol. 2019;39:2413-2433. [RCA] [PubMed] [DOI] [Full Text] [Cited by in Crossref: 26] [Cited by in RCA: 33] [Article Influence: 4.7] [Reference Citation Analysis (0)] |
| 10. | Vujosevic S, Muraca A, Alkabes M, Villani E, Cavarzeran F, Rossetti L, De Cillaʼ S. Early microvascular and neural changes in patients with type 1 and type 2 diabetes mellitus without clinical signs of diabetic retinopathy. Retina. 2019;39:435-445. [RCA] [PubMed] [DOI] [Full Text] [Cited by in Crossref: 68] [Cited by in RCA: 82] [Article Influence: 16.4] [Reference Citation Analysis (0)] |
| 11. | de Carlo TE, Chin AT, Bonini Filho MA, Adhi M, Branchini L, Salz DA, Baumal CR, Crawford C, Reichel E, Witkin AJ, Duker JS, Waheed NK. Detection of microvascular changes in eyes of patients with diabetes but not clinical diabetic retinopathy using optical coherence tomography angiography. Retina. 2015;35:2364-2370. [RCA] [PubMed] [DOI] [Full Text] [Cited by in Crossref: 235] [Cited by in RCA: 292] [Article Influence: 32.4] [Reference Citation Analysis (0)] |
| 12. | Dimitrova G, Chihara E, Takahashi H, Amano H, Okazaki K. Quantitative Retinal Optical Coherence Tomography Angiography in Patients With Diabetes Without Diabetic Retinopathy. Invest Ophthalmol Vis Sci. 2017;58:190-196. [RCA] [PubMed] [DOI] [Full Text] [Cited by in Crossref: 195] [Cited by in RCA: 233] [Article Influence: 29.1] [Reference Citation Analysis (0)] |
| 13. | Di G, Weihong Y, Xiao Z, Zhikun Y, Xuan Z, Yi Q, Fangtian D. A morphological study of the foveal avascular zone in patients with diabetes mellitus using optical coherence tomography angiography. Graefes Arch Clin Exp Ophthalmol. 2016;254:873-879. [RCA] [PubMed] [DOI] [Full Text] [Cited by in Crossref: 106] [Cited by in RCA: 131] [Article Influence: 13.1] [Reference Citation Analysis (0)] |
| 14. | Takase N, Nozaki M, Kato A, Ozeki H, Yoshida M, Ogura Y. Enlargement of foveal avascular zone in diabetic eyes evaluated by en face optical coherence tomography angiography. Retina. 2015;35:2377-2383. [RCA] [PubMed] [DOI] [Full Text] [Cited by in Crossref: 284] [Cited by in RCA: 332] [Article Influence: 36.9] [Reference Citation Analysis (0)] |
| 15. | Krawitz BD, Mo S, Geyman LS, Agemy SA, Scripsema NK, Garcia PM, Chui TYP, Rosen RB. Acircularity index and axis ratio of the foveal avascular zone in diabetic eyes and healthy controls measured by optical coherence tomography angiography. Vision Res. 2017;139:177-186. [RCA] [PubMed] [DOI] [Full Text] [Cited by in Crossref: 112] [Cited by in RCA: 141] [Article Influence: 17.6] [Reference Citation Analysis (0)] |
| 16. | Alam M, Zhang Y, Lim JI, Chan RVP, Yang M, Yao X. Quantitative optical coherence tomography angiography features for objective classification and staging of diabetic retinopathy. Retina. 2020;40:322-332. [RCA] [PubMed] [DOI] [Full Text] [Cited by in Crossref: 82] [Cited by in RCA: 85] [Article Influence: 17.0] [Reference Citation Analysis (0)] |
| 17. | Vujosevic S, Muraca A, Gatti V, Masoero L, Brambilla M, Cannillo B, Villani E, Nucci P, De Cillà S. Peripapillary Microvascular and Neural Changes in Diabetes Mellitus: An OCT-Angiography Study. Invest Ophthalmol Vis Sci. 2018;59:5074-5081. [RCA] [PubMed] [DOI] [Full Text] [Cited by in Crossref: 56] [Cited by in RCA: 87] [Article Influence: 14.5] [Reference Citation Analysis (1)] |
| 18. | Reif R, Qin J, An L, Zhi Z, Dziennis S, Wang R. Quantifying optical microangiography images obtained from a spectral domain optical coherence tomography system. Int J Biomed Imaging. 2012;2012:509783. [RCA] [PubMed] [DOI] [Full Text] [Full Text (PDF)] [Cited by in Crossref: 104] [Cited by in RCA: 146] [Article Influence: 11.2] [Reference Citation Analysis (0)] |


