Published online Jul 26, 2021. doi: 10.12998/wjcc.v9.i21.5889
Peer-review started: February 19, 2021
First decision: March 11, 2021
Revised: March 19, 2021
Accepted: June 1, 2021
Article in press: June 1, 2021
Published online: July 26, 2021
Processing time: 152 Days and 4.2 Hours
There is no research on quantitative pleural line movement. In this study, we assume that tissue Doppler and its quantitative technology can quantify the pleural line movement and can be used to diagnose pneumothorax.
To evaluate the quantitative assessment of pleural line movement measured by tissue Doppler imaging (TDI) for pneumothorax diagnosis.
Adult patients (n = 45) diagnosed with unilateral pneumothorax were included in this study. Each patient underwent TDI of both lungs. The pneumothorax side and contralateral normal lung side were compared using several indices obtained from TDI: peak pleural line velocity (PVmax), peak chest wall tissue velocity (CVmax), peak pleural line strain value (PSmax), peak chest wall tissue strain value (CSmax), PVmax/CVmax and PSmax/CSmax. The receiver operating characteristic analysis was used to evaluate the performance of these quantitative assessments for pneumothorax diagnosis.
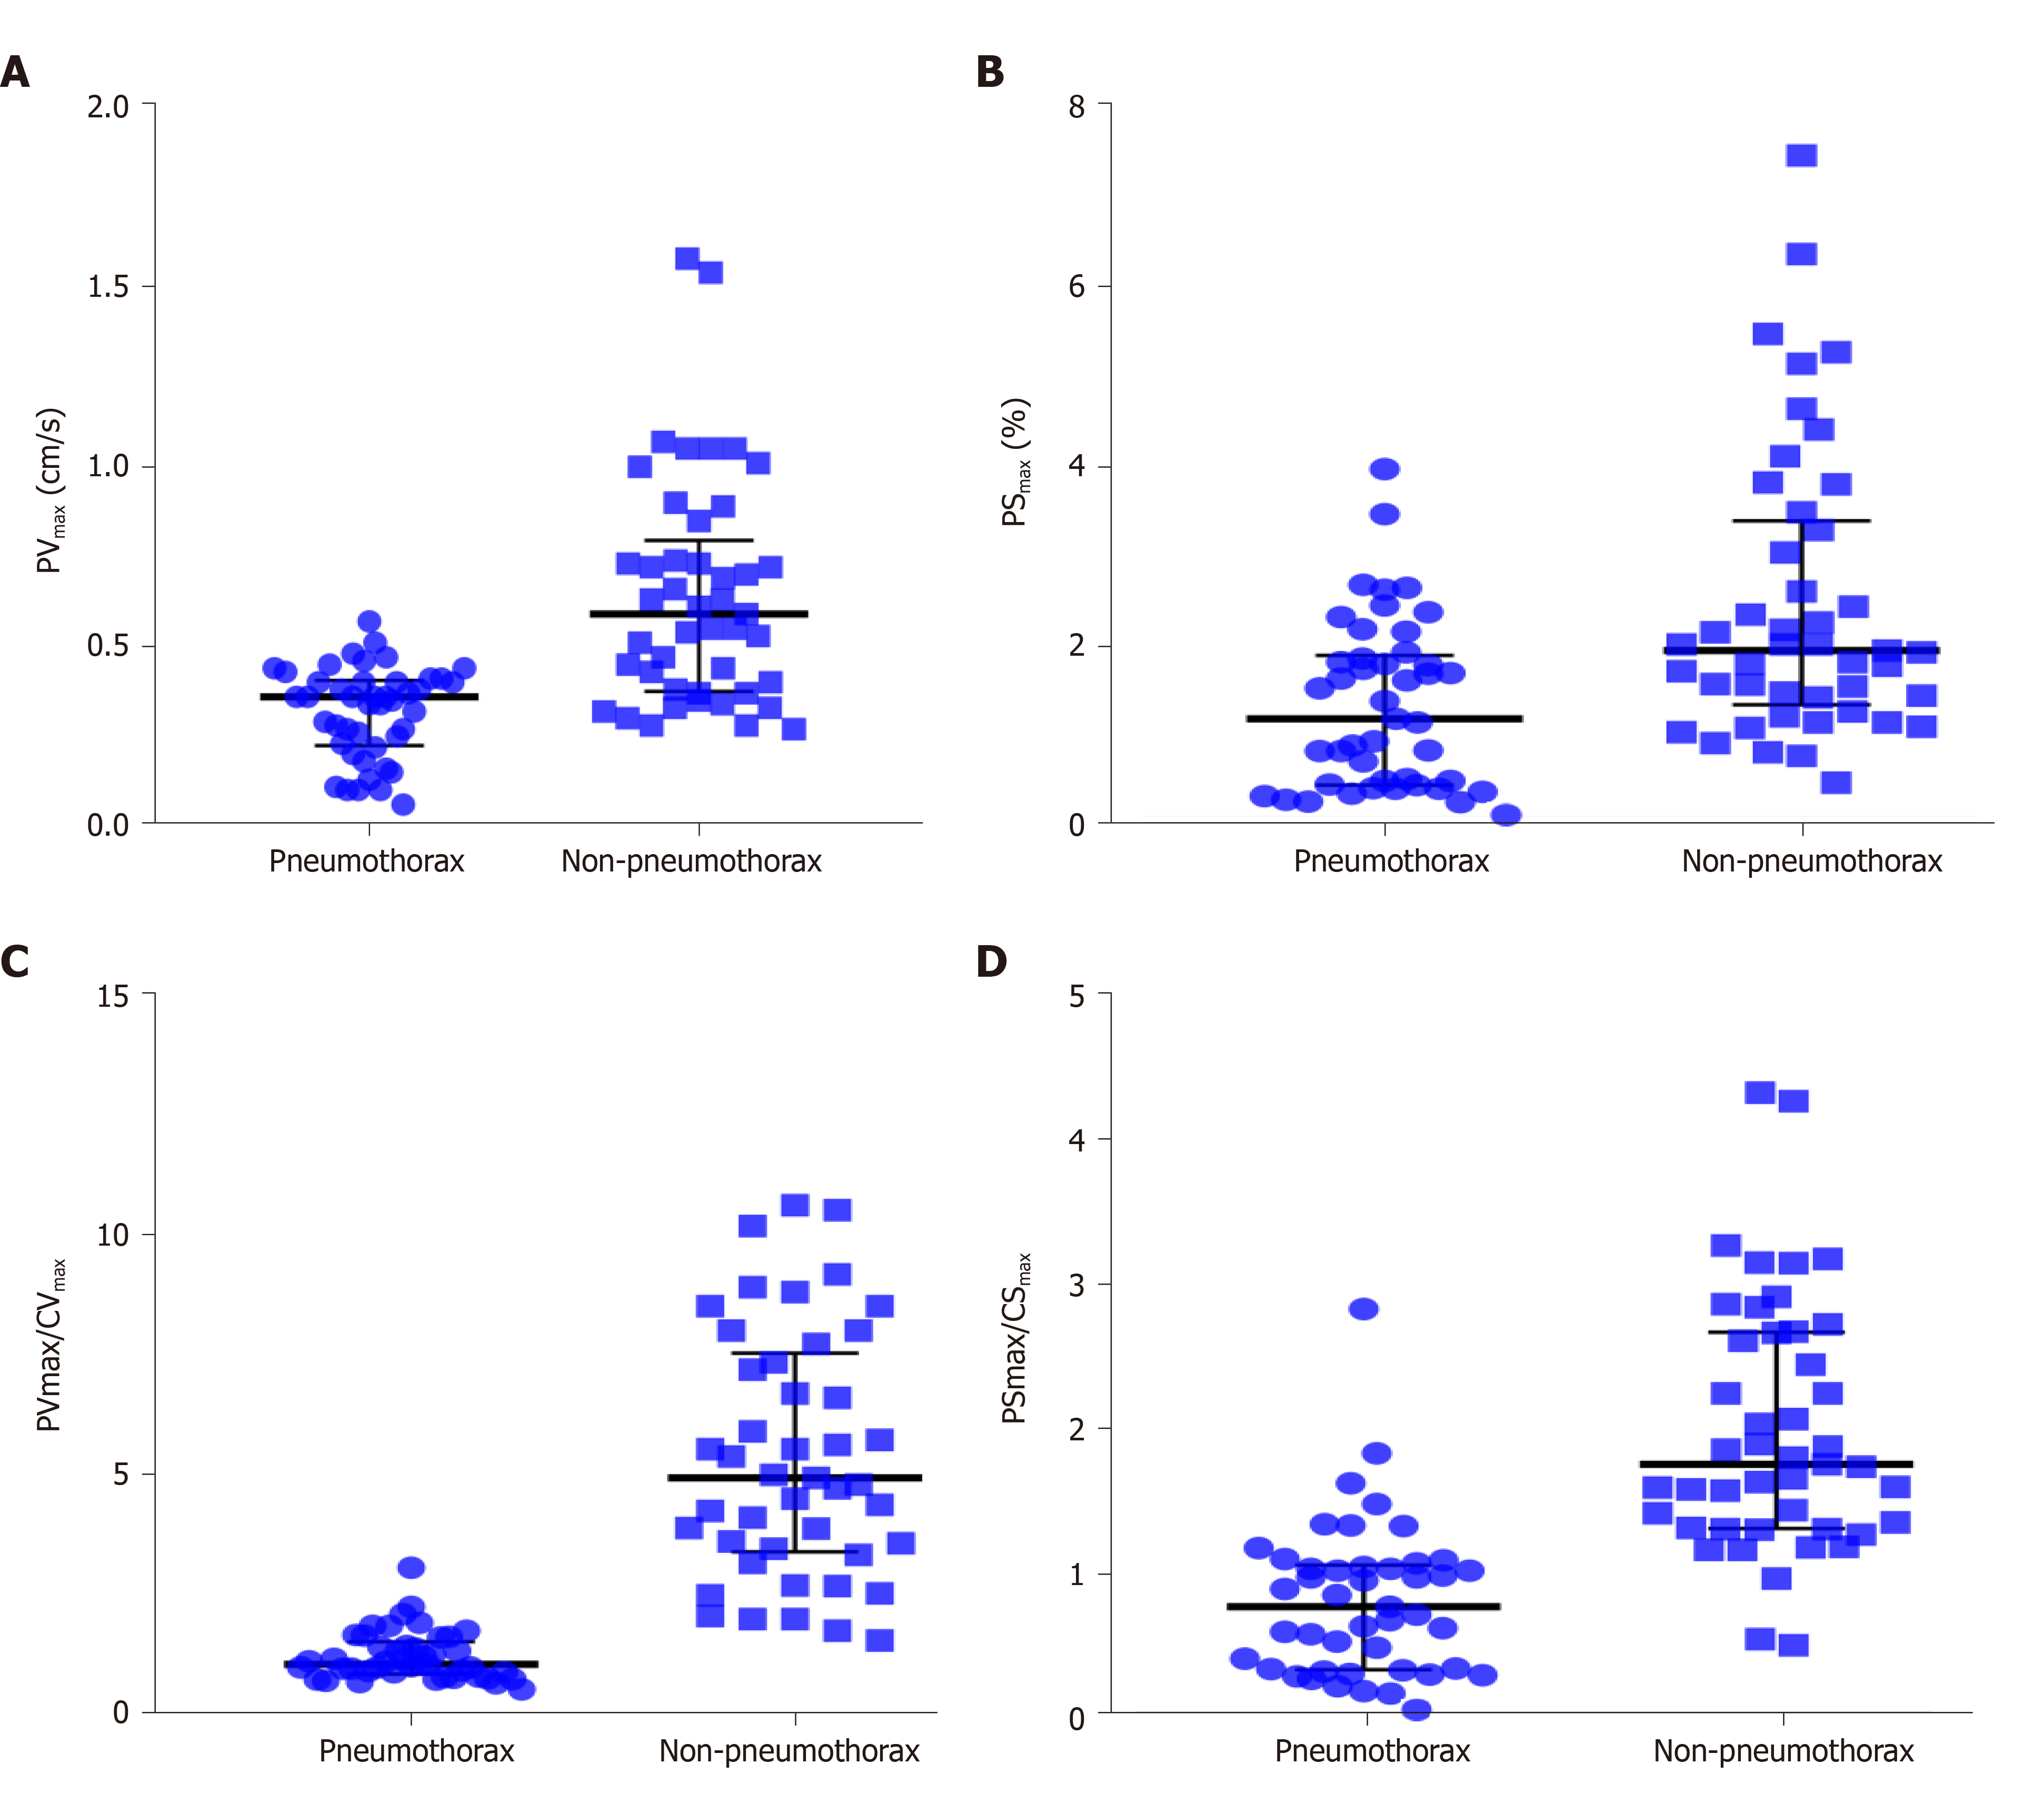
Various quantitative variables of the pneumothorax side were all lower than that of the non-pneumothorax side and included the PVmax (0.36 cm/s vs 0.59 cm/s, P < 0.001), PSmax (1.14% vs 1.90%, P = 0.001), PVmax/CVmax (1.06 vs 4.93, P < 0.001), and PSmax/CSmax (0.76 vs 1.74, P < 0.001). For the discrimination of pneumothorax, the cut-off values of the PVmax, PSmax, PVmax/CVmax, and PSmax/CSmax were calculated as 0.50 cm/s, 0.94%, 1.96, and 1.12, respectively. Similarly, the sensitivities and specificities of PVmax, PSmax, PVmax/CVmax, and PSmax/CSmax were 96% and 62%, 47% and 91%, 93% and 96%, and 82% and 93%, respectively. The area under the receiver operating characteristic curve were 0.84, 0.72, 0.99, and 0.91, respectively, for PVmax, PSmax, PVmax/CVmax, and PSmax/CSmax.
Quantification analysis of pleural line movement using TDI is a useful tool for the diagnosis of pneumothorax.
Core Tip: This study used tissue Doppler to quantify the movement of the pleural line for the diagnosis of pneumothorax in patients with unilateral pneumothorax. Various quantitative variables of the pneumothorax side were all lower than that of the non-pneumothorax side. Peak pleural line velocity/peak chest wall tissue velocity was the best variable to diagnose pneumothorax (area under receiver operating characteristic curve, 0.99). Tissue Doppler quantitative technique is an effective tool for the diagno
- Citation: Xiao R, Shao Q, Zhao N, Liu F, Qian KJ. Quantification analysis of pleural line movement for the diagnosis of pneumothorax. World J Clin Cases 2021; 9(21): 5889-5899
- URL: https://www.wjgnet.com/2307-8960/full/v9/i21/5889.htm
- DOI: https://dx.doi.org/10.12998/wjcc.v9.i21.5889
Pneumothorax is characterized by sudden dyspnea, respiratory distress, chest pain, cough, or decreased blood oxygen saturation and is a common and critical acute condition. A timely diagnosis can improve patient outcomes. However, in practice pneumothorax diagnosis requires further discrimination with other conditions. Pneumothorax is easily diagnosed using radiological tools, such as chest radiograph and computed tomography (CT)[1]. For pneumothorax diagnosis, CT has several disadvantages, such as radiation exposure, cost, and availability[2]. Although chest radiograph is more convenient than CT, its sensitivity in the diagnosis of pneumothorax is relatively low and is estimated to be only around 20.9%[3].
Due to its easy access, ultrasound has been widely used in emergency departments and intensive care units. Recently, lung ultrasound has been evaluated for the diagnosis of pneumothorax. For example, among intensive care unit patients, lung ultrasound was found to be a useful tool for pneumothorax diagnosis with a sensitivity of 75% and a specificity of 93%[4]. Currently, the criteria of ultrasound diagnosis for pneumothorax are as follows: absence of lung sliding[5], lung point[6,7], and barcode sign[6]. Of these, the absence of lung sliding is the most common sign for pneumothorax diagnosis and has been listed in the bedside lung ultrasound in emergency protocol[8]. Unfortunately, pneumothorax diagnosis using lung ultrasound still faces several challenges. First, the ultrasonic features of pneumothorax are similar to a wide range of other diseases that include severe asthma[9], pulmonary bullae[10], and chronic obstructive pulmonary disease[11]. Second, the ultrasonic method for pneumothorax diagnosis depends on the physician’s experience and training[12]. Third, the movement of the pleural line is based on the movement of the visceral and parietal pleura during respiration, and the evaluation of movement using ultrasound is subjective and may vary between observers. In addition, patient postures may also have a significant impact on the diagnosis[13].
Usually, tissue Doppler imaging (TDI) is performed to quantitatively evaluate cardiac function, including systolic and diastolic cycles[14,15]. Moreover, it is also advised to evaluate the synchronization of left ventricular myocardial contraction by tissue velocity imaging and strain quantitative technology[16]. Recently, we found that TDI can quantify the movement of the pleural line. Therefore, in this prospective study, we aimed to evaluate the performance of TDI for pneumothorax diagnosis by quantitative analysis of pleural line movement during respiration.
This study was approved by the Ethics Committee of the First Affiliated Hospital of Nanchang University, and written consent was obtained from all subjects. This study was performed in accordance with the Declaration of Helsinki (2013).
Between September 2019 and May 2020, adult patients (> 18 years) who were admitted to the emergency department and intensive care unit at our center with unilateral pneumothorax confirmed by CT were included for further analysis. Lung ultrasound was performed 2 h after CT examination. Patients were excluded if they presented with bilateral pneumothorax, if cardiac monitoring was absent from ultrasound images, or if invasive mechanical ventilation was performed. Patient characteristics such as age, sex, weight, height, etiology, and pneumothorax side were collected for further analysis.
Ultrasound examination was performed by a senior physician with > 5 years of experience in lung ultrasonography. The examination was performed with a Mindray Ultrasound Scanning machine (M8/M9, Mindray, Shenzhen, China) equipped with low frequency transducers (1-5 MHz and 2-4 MHz). Ultrasonic images were analyzed with the TDI-QA software (Mindray, Shenzhen, China). Lung ultrasound was performed for patients with pneumothorax by a specific investigator (RX). Briefly, the ultrasound was performed as follows. First, the patient laid in the supine position, and the probe was positioned perpendicularly to the chest wall. For the pneumothorax side, if the pleural line movement disappeared, tissue Doppler was switched, and ultrasonic images were collected for at least 20 s. For the non-pneumothorax side, ultrasound images were collected at the contralateral site.
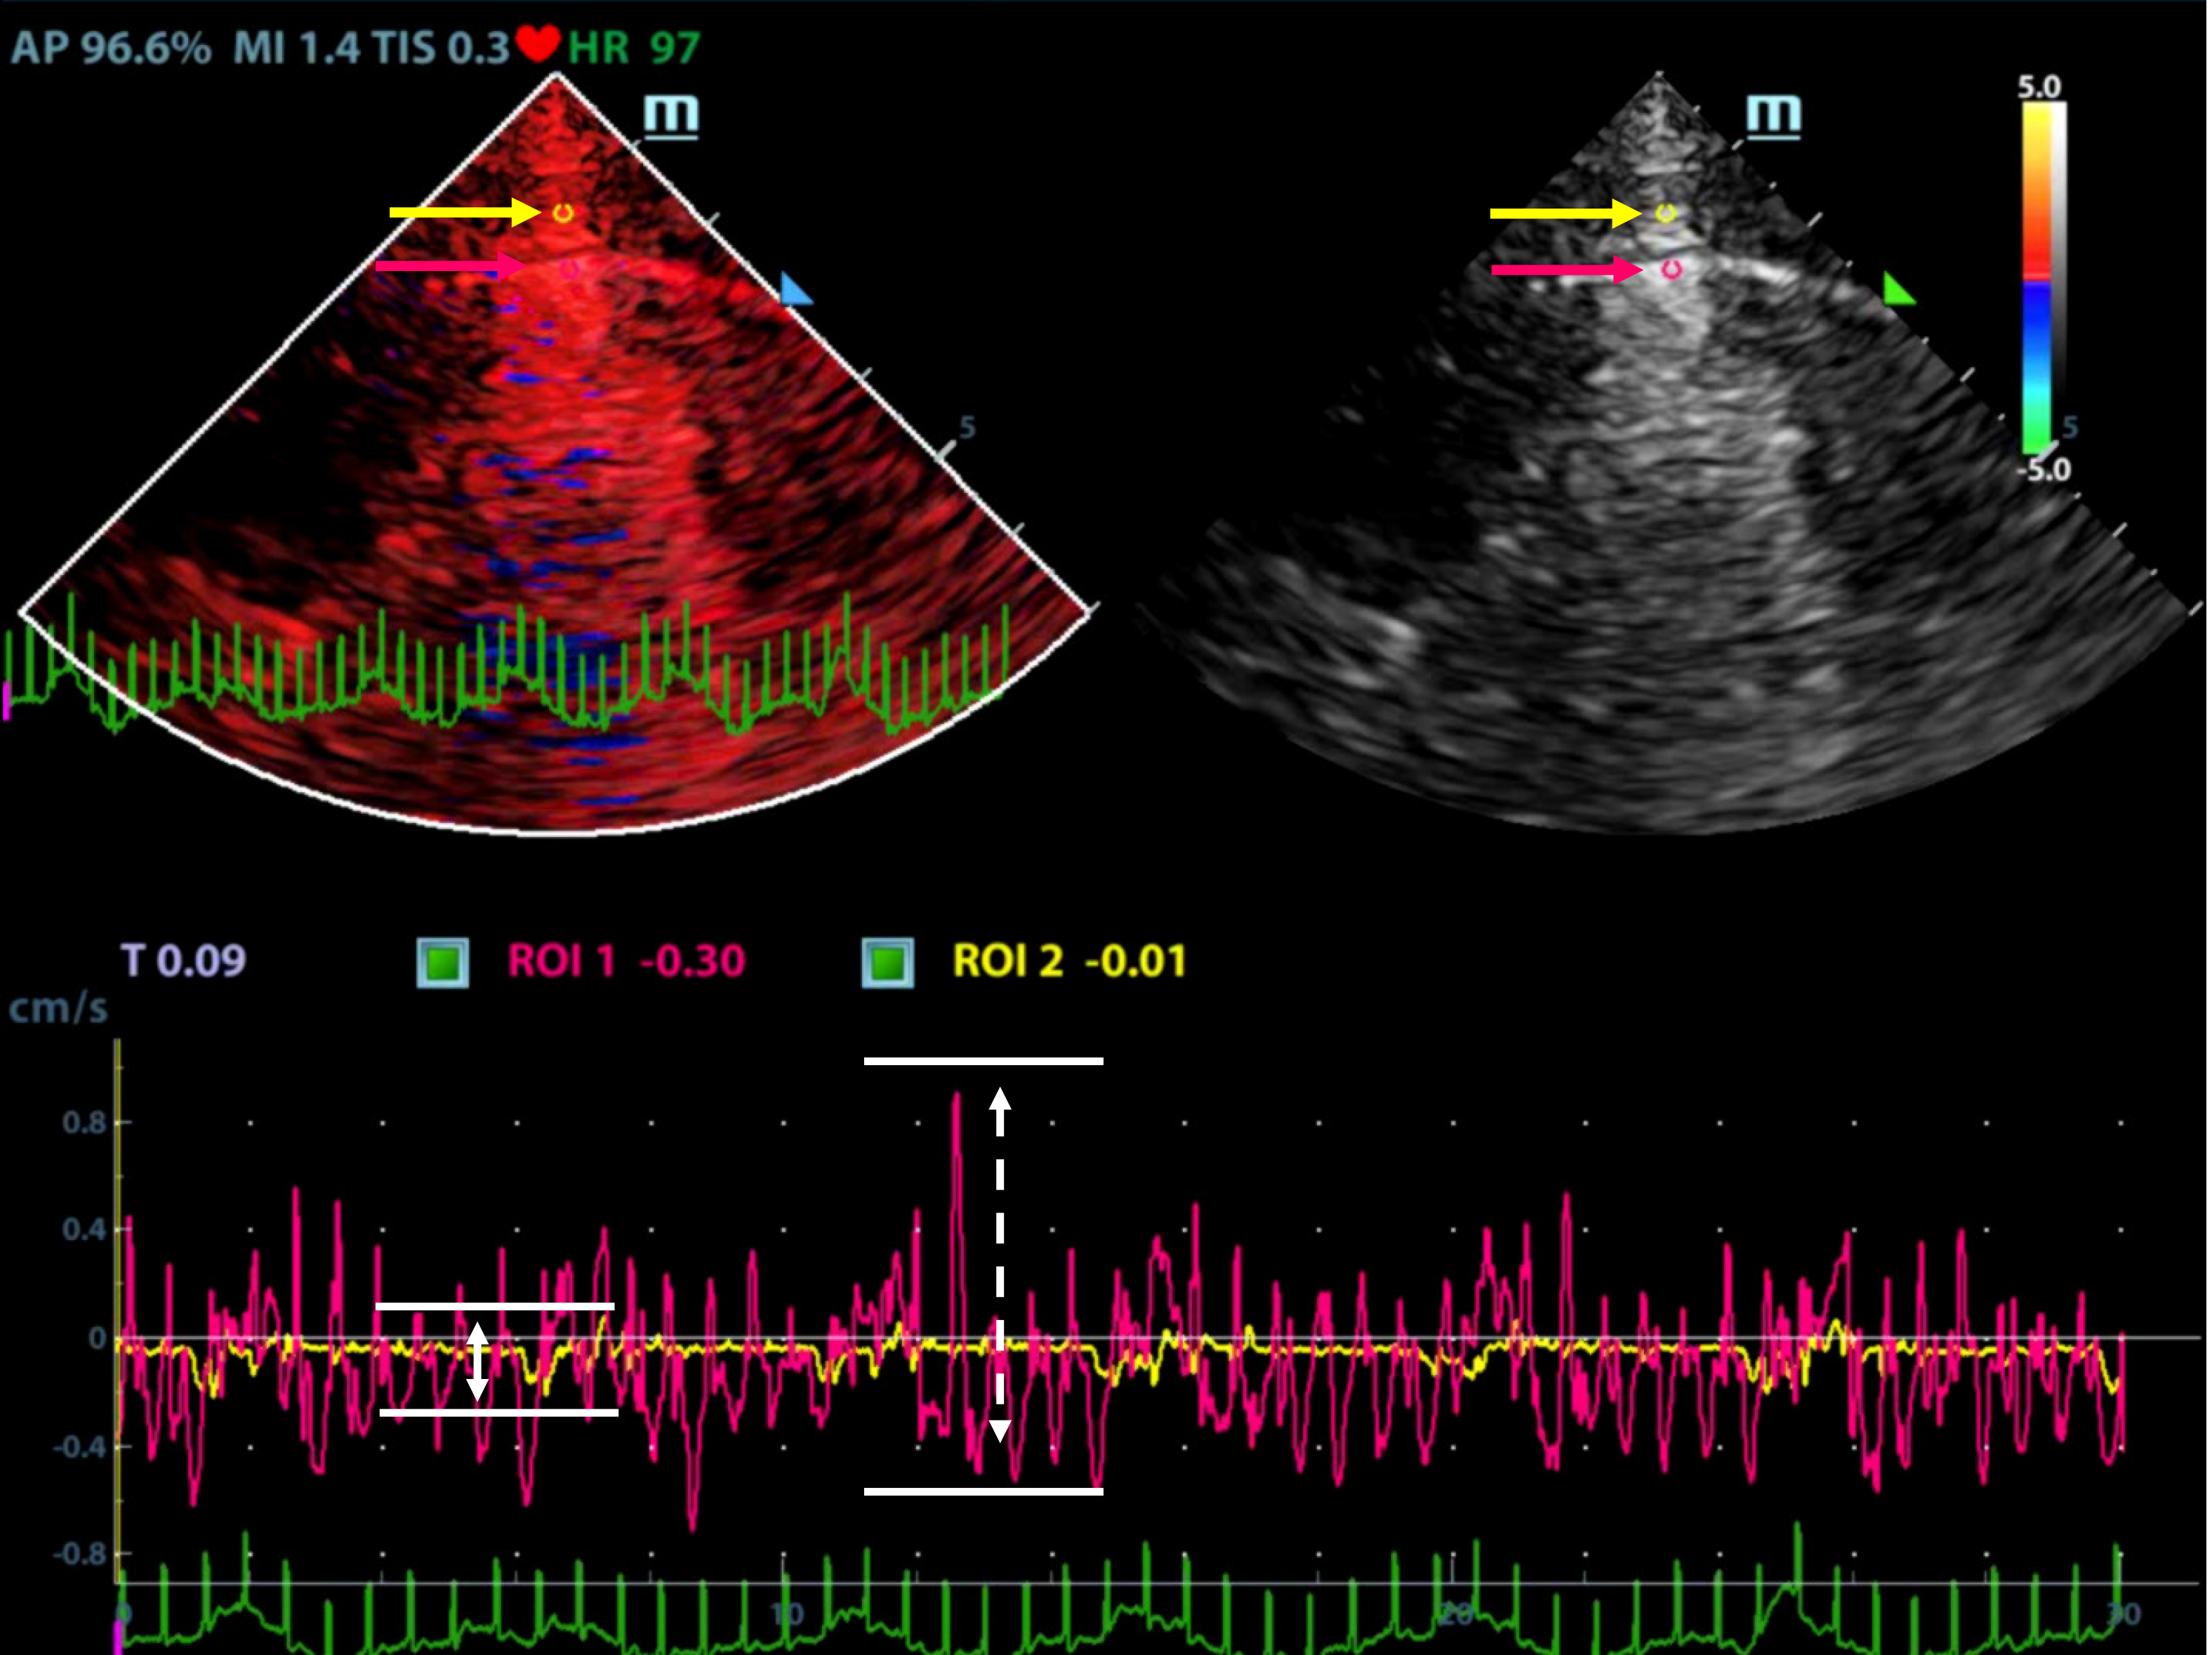
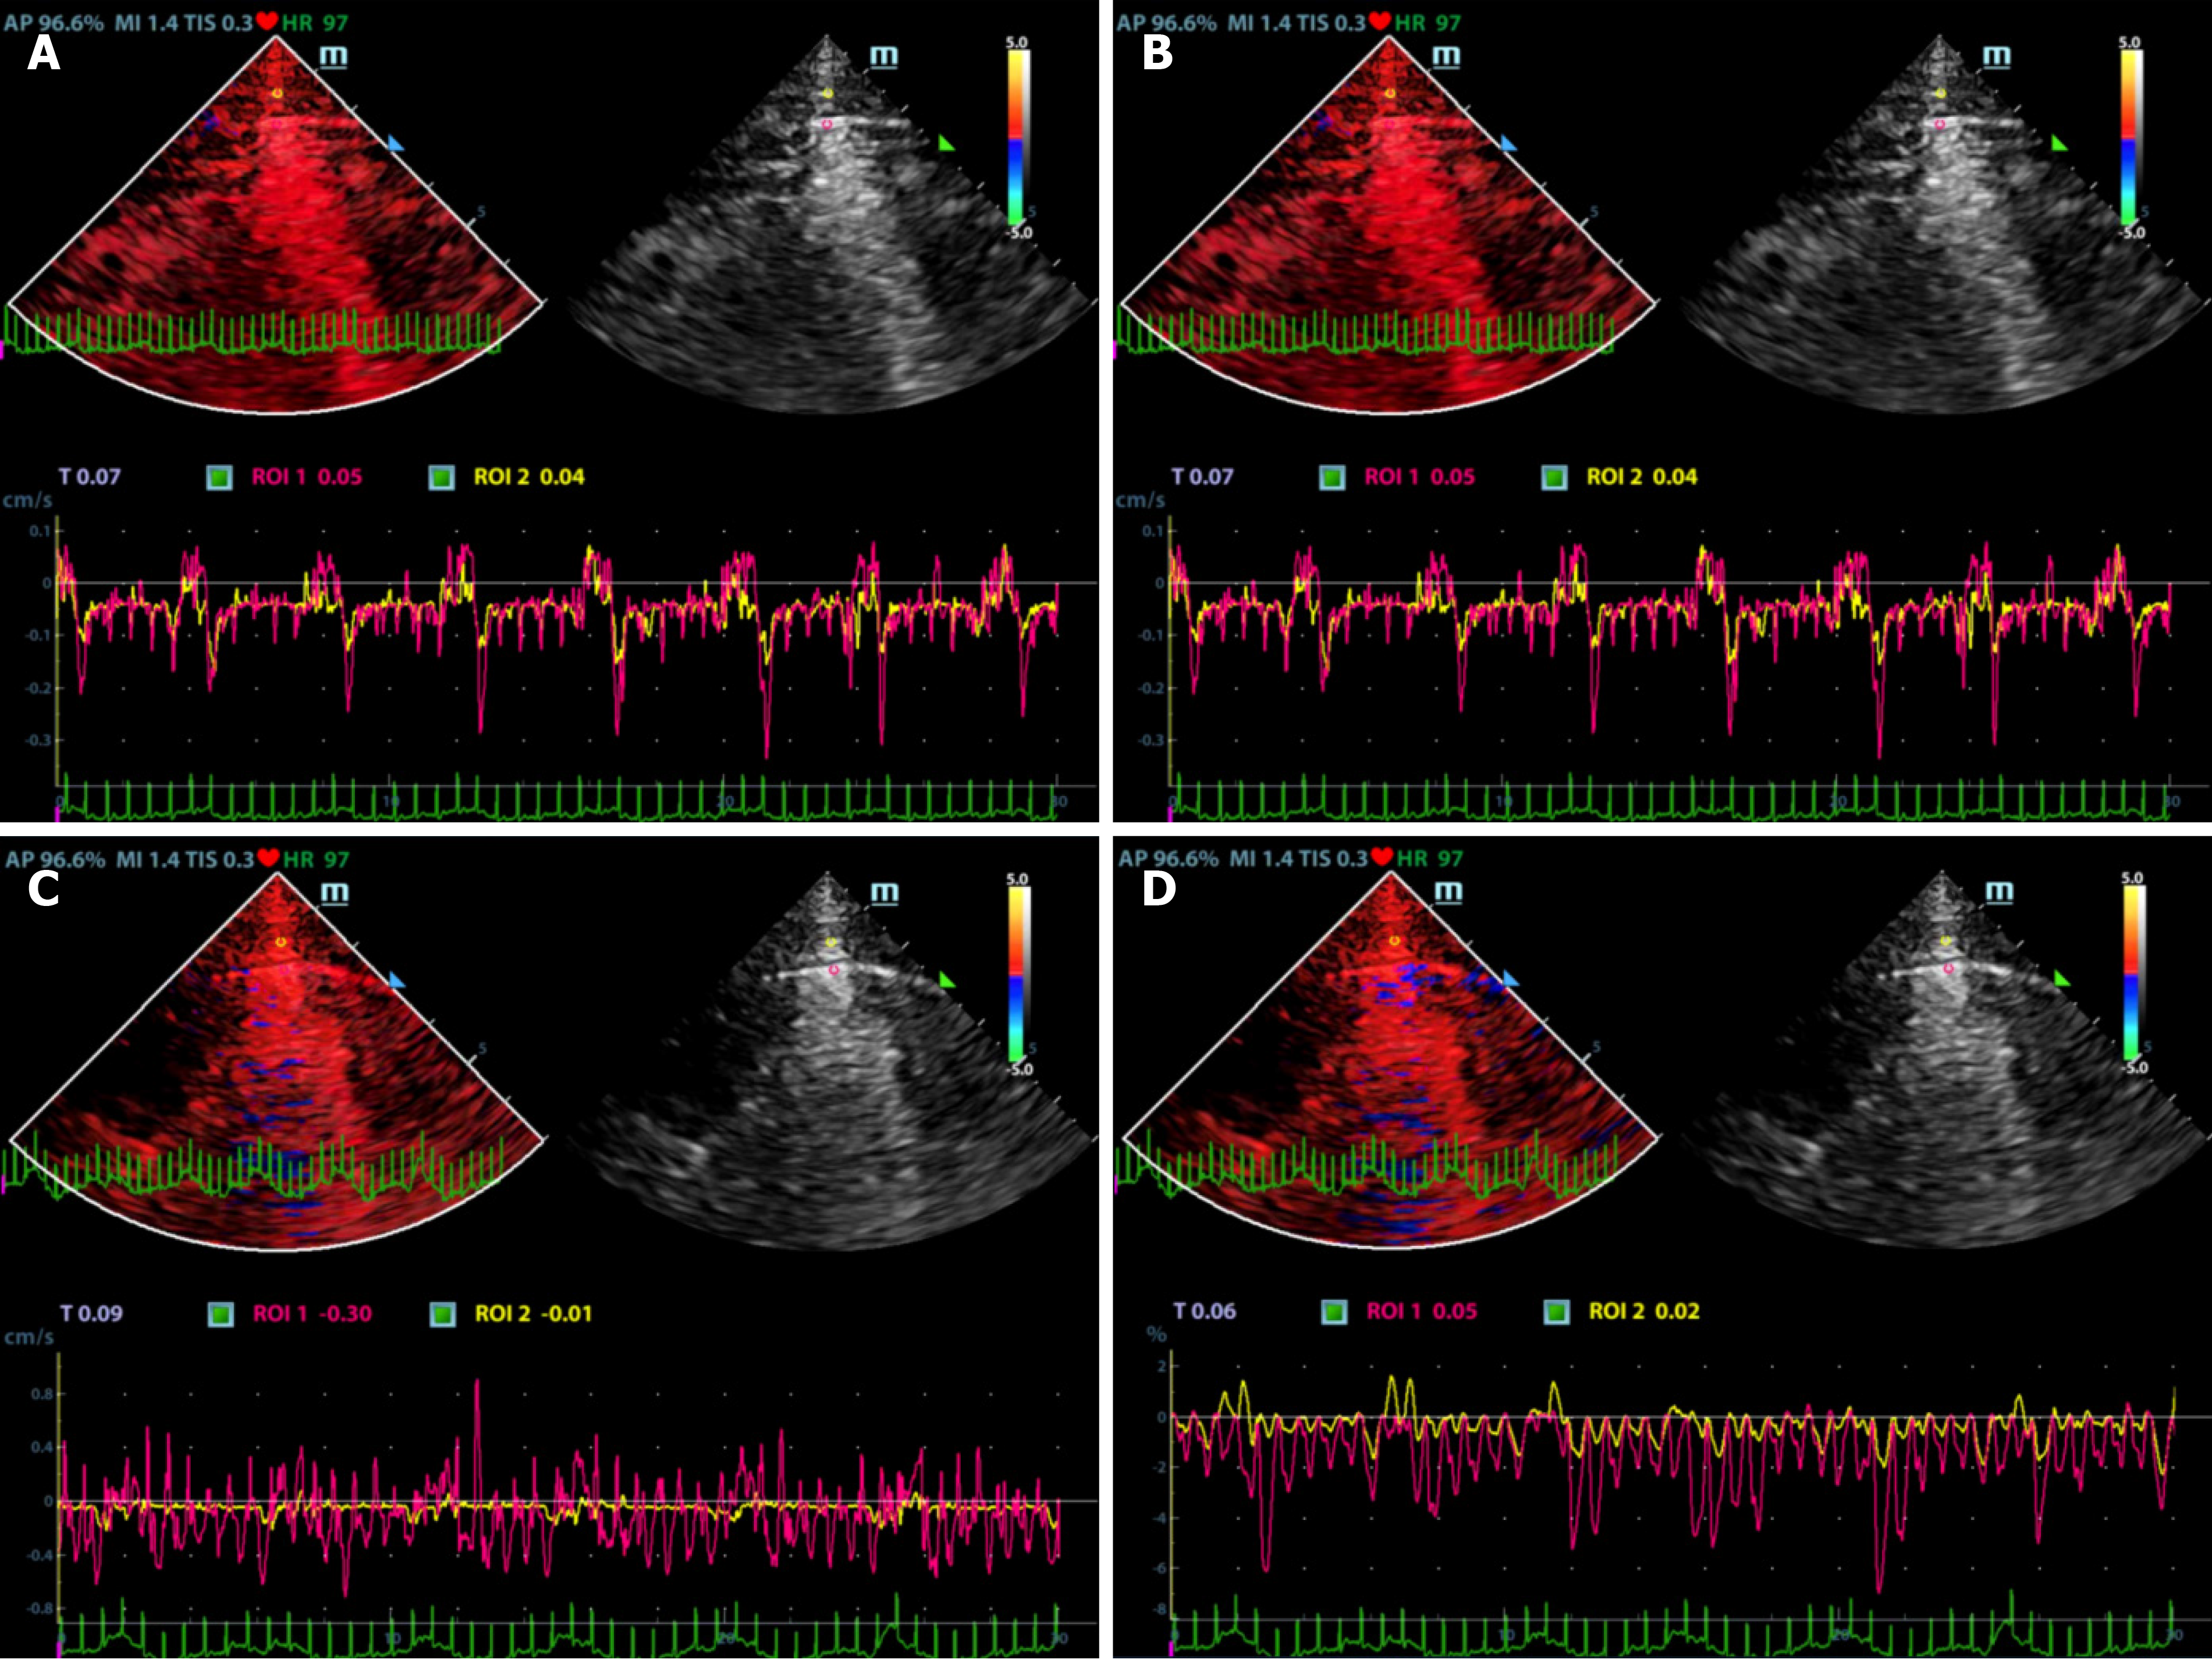
Ultrasonographic data were selected retrospectively. Quantitative analysis of ultrasonic images was performed as shown in Figures 1 and 2. Briefly, the diameter of the region of interest (ROI) was adjusted to the width of the pleural line, and then the first ROI (ROI1, red) was placed at the midpoint of the pleural line. Subsequently, a velocity-time curve and a strain-time curve were generated automatically. Meanwhile, the maximum velocity and strain were calculated based on the quantitative analysis and included the peak pleural line velocity (PVmax) and peak pleural line strain value (PSmax). The second ROI (ROI2, yellow) was placed in the chest wall tissue about 0.5 cm from ROI1. The software automatically generated a velocity-time curve and a strain-time curve, measuring the maximum chest wall tissue velocity and maximum strain. These parameters are called peak chest wall tissue velocity (CVmax) and peak chest wall tissue strain value (CSmax). All above-mentioned indexes, including the PVmax/CVmax and PSmax/CSmax ratios were calculated based on data collected from the pneumothorax and non-pneumothorax side separately.
SPSS 17.0 (IBM, Armonk, NY, United States) was used for statistical analysis. Normally distributed data were reported as the mean (± SD), and non-normally distributed data were expressed as the median (interquartile range). Comparisons between paired samples were performed using a Wilcoxon test. The receiver operating characteristic curve was constructed to evaluate the diagnostic performance of biomarkers to detect pneumothorax. The best cut-off values were defined using Youden’s index. Sensitivity, specificity, positive predictive value, negative predictive value, positive likelihood ratio, negative likelihood ratio, and the corresponding 95% confidence intervals (CIs) were estimated with these cut-off values. Interobserver and intraobserver agreements were evaluated using intraclass correlation coefficients by comparing measurements made by the senior physician (RX) and resident (NZ). A P value < 0.05 was considered statistically significant.
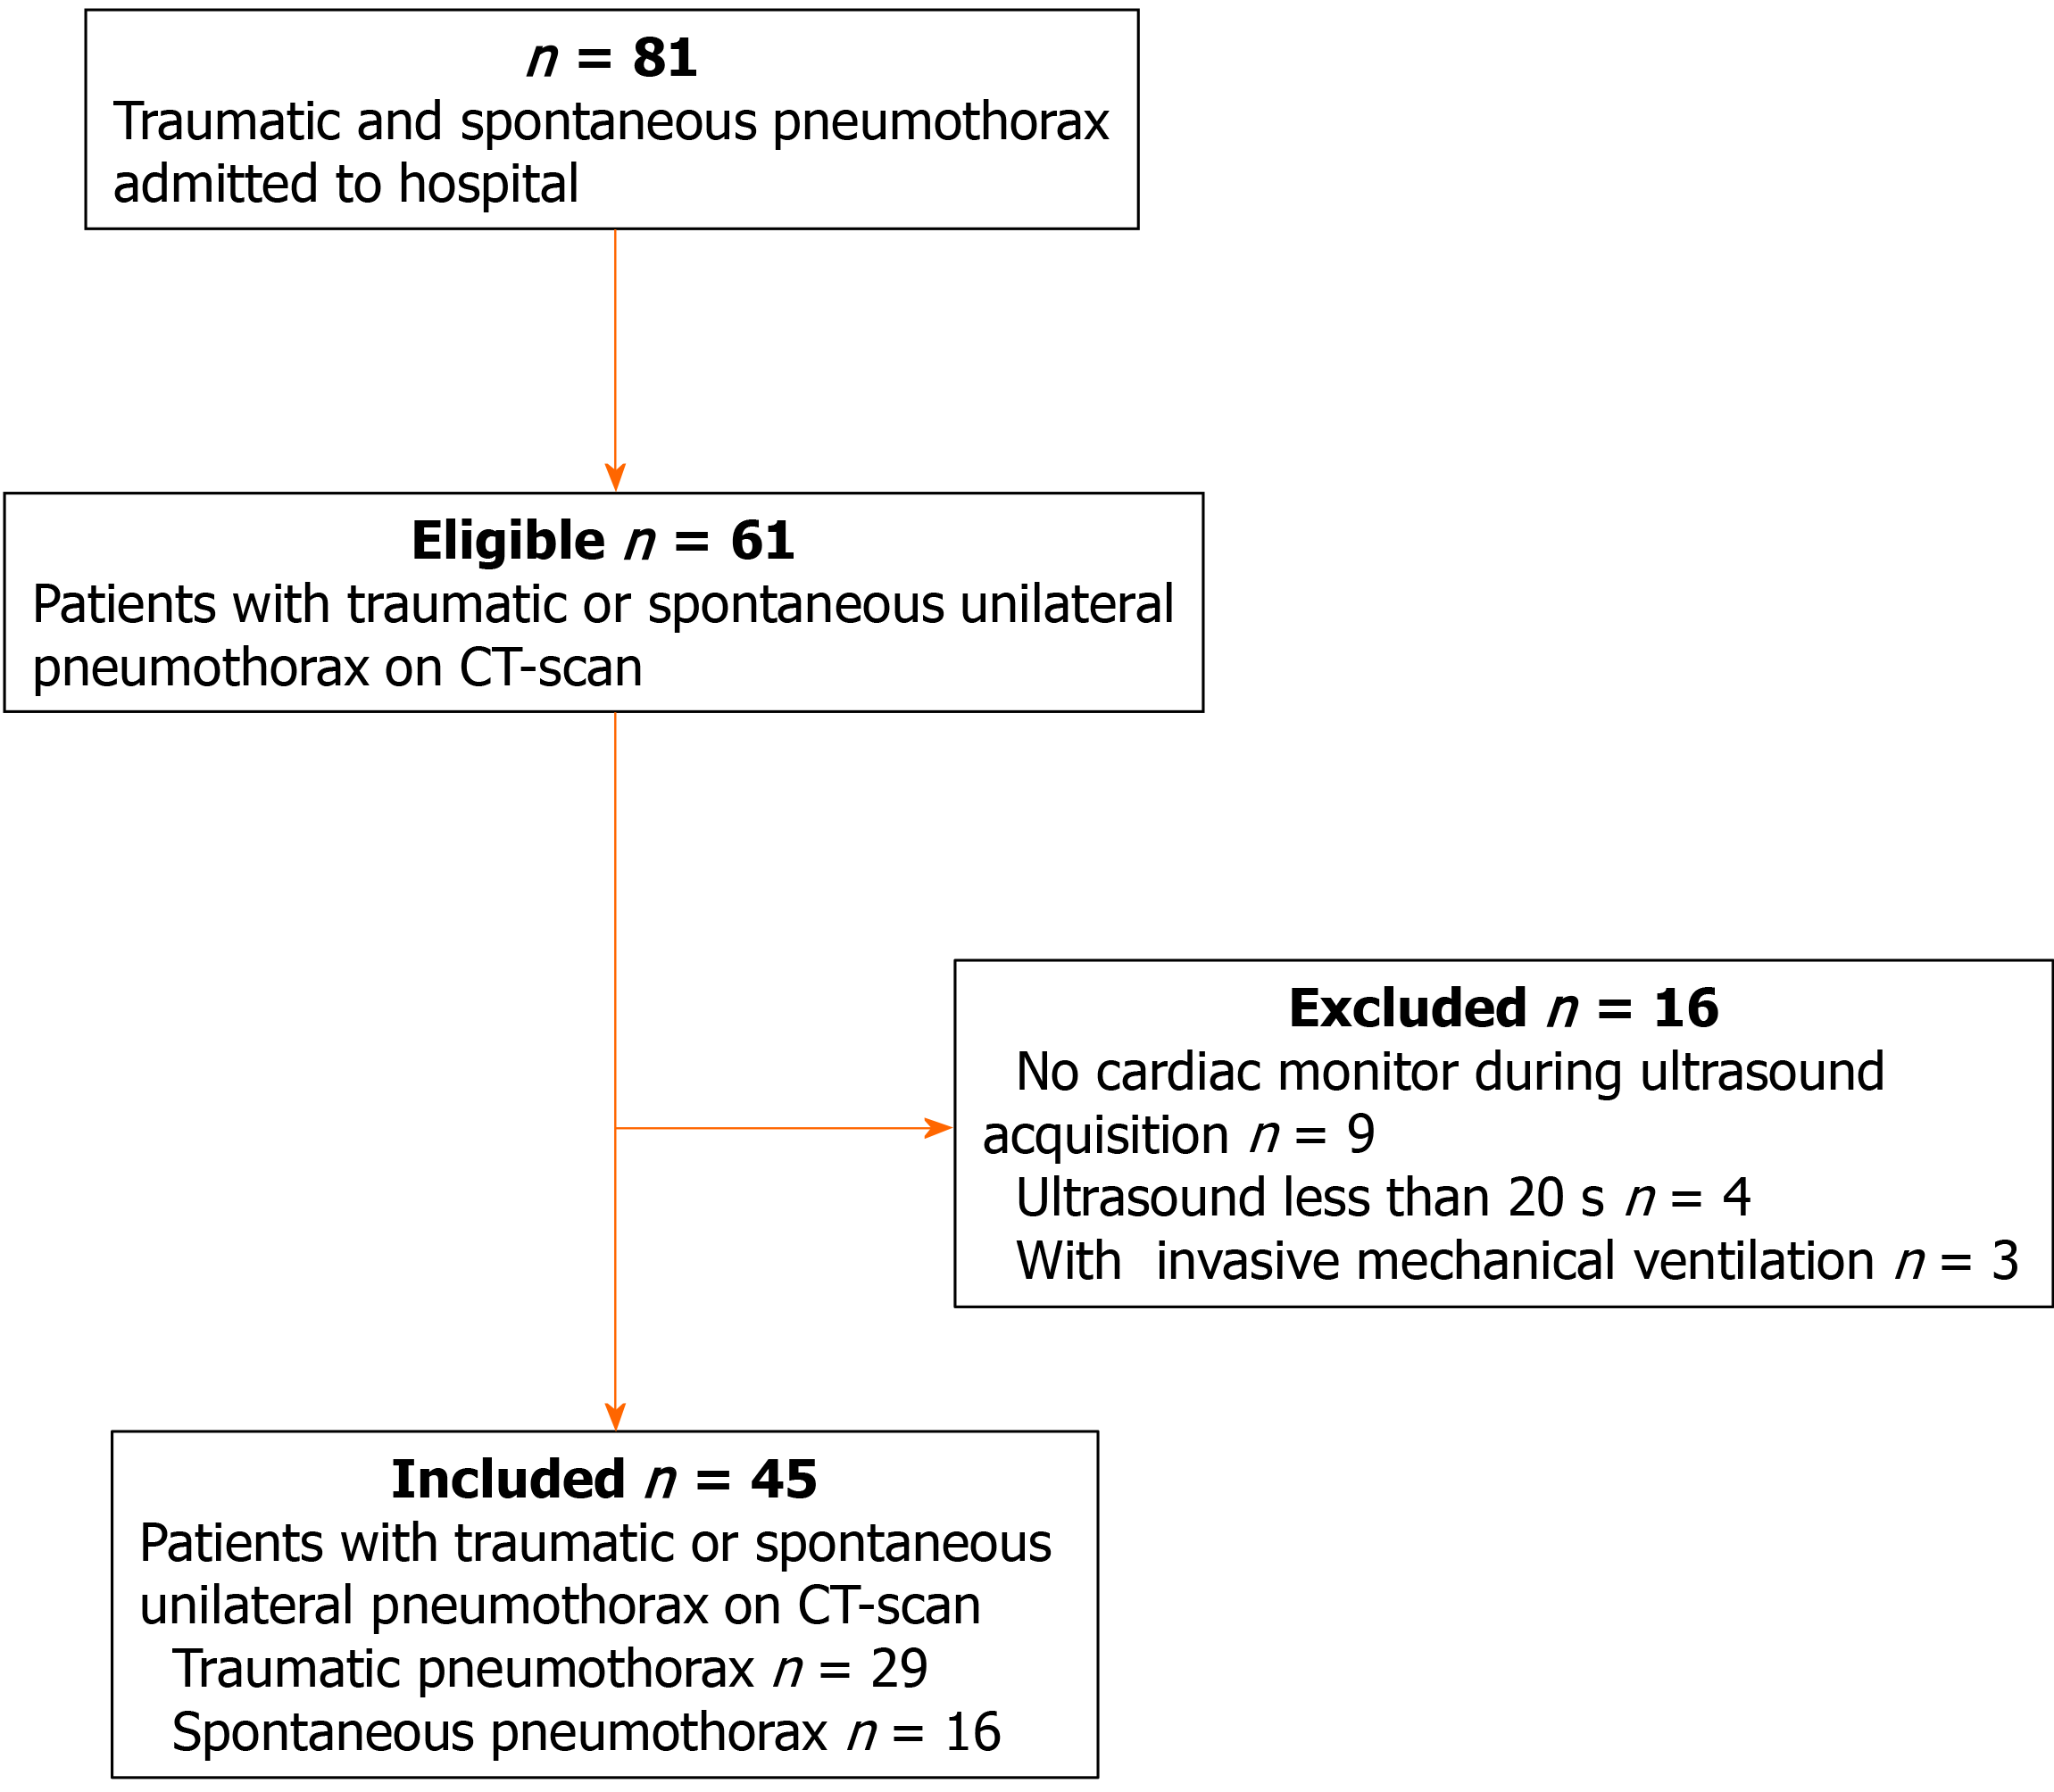
During the study period, 61 suspected patients were admitted to our center, and a total of 45 patients were included for further analysis. The flowchart of patient selection is given in Figure 3. Of these patients, 28 were male, and the median age was 38 years. The etiology of pneumothorax was as follows: spontaneous pneumothorax (n = 16) and traumatic pneumothorax (n = 29). Eighteen patients had pneumothorax on the left side and twenty-seven patients on the right side (Table 1).
| Characteristics | Value |
| n | 45 |
| Male | 28 (62) |
| Age (yr) | 38 (21, 59) |
| Weight (kg) | 63 (60, 70) |
| Height (cm) | 16 (163, 175) |
| Etiology for pneumothorax | |
| Spontaneous pneumothorax | 16 (36) |
| Trauma | 29 (64) |
| Pneumothorax features | |
| Left | 18 (40) |
| Right | 27 (60) |
A total of 90 images of the included patients were obtained. Tissue Doppler features (Figures 4 and 5 and Videos 1-4) are shown in Table 2. The CVmax was found to be 0.30 (0.15, 0.39) cm/s at the pneumothorax side and 0.13 (0.09, 0.19) cm/s at the non-pneumothorax side. The PSmax was found to be 1.62% (1.16%, 2.06%) at the pneumothorax side and 1.00% (0.71%, 1.98%) at the non-pneumothorax side. Statistical analysis showed that quantitative variables, such as the PVmax [0.36 (0.23, 0.41) vs 0.59 (0.38, 0.80) cm/s, P < 0.001], the PSmax [1.14 (0.41, 1.85) vs 1.90 (1.30, 3.34) %, P = 0.001)], the PVmax/CVmax ratio [1.06 (0.85, 1.53) vs 4.93 (3.40, 7.52), P < 0.001], and the PSmax/CSmax ratio [0.76 (0.32, 1.05) vs 1.74 (1.30, 2.66), P < 0.001] of the pneumothorax side were all lower than the non-pneumothorax counterparts.
| Pneumothorax side, n = 45 | Non-pneumothorax side, n = 45 | P value | |
| PVmax (cm/s) | 0.36 (0.23, 0.41) | 0.59 (0.38, 0.80) | < 0.001 |
| PSmax (%) | 1.14 (0.41, 1.85) | 1.90 (1.30, 3.34) | 0.001 |
| CVmax (cm/s) | 0.30 (0.15, 0.39) | 0.13 (0.09, 0.19) | < 0.001 |
| CSmax (%) | 1.62 (1.16, 2.06) | 1.00 (0.71, 1.98) | 0.075 |
| PVmax/CVmax | 1.06 (0.85, 1.53) | 4.93 (3.40, 7.52) | < 0.001 |
| PSmax/CSmax | 0.76 (0.32, 1.05) | 1.74 (1.30, 2.66) | < 0.001 |
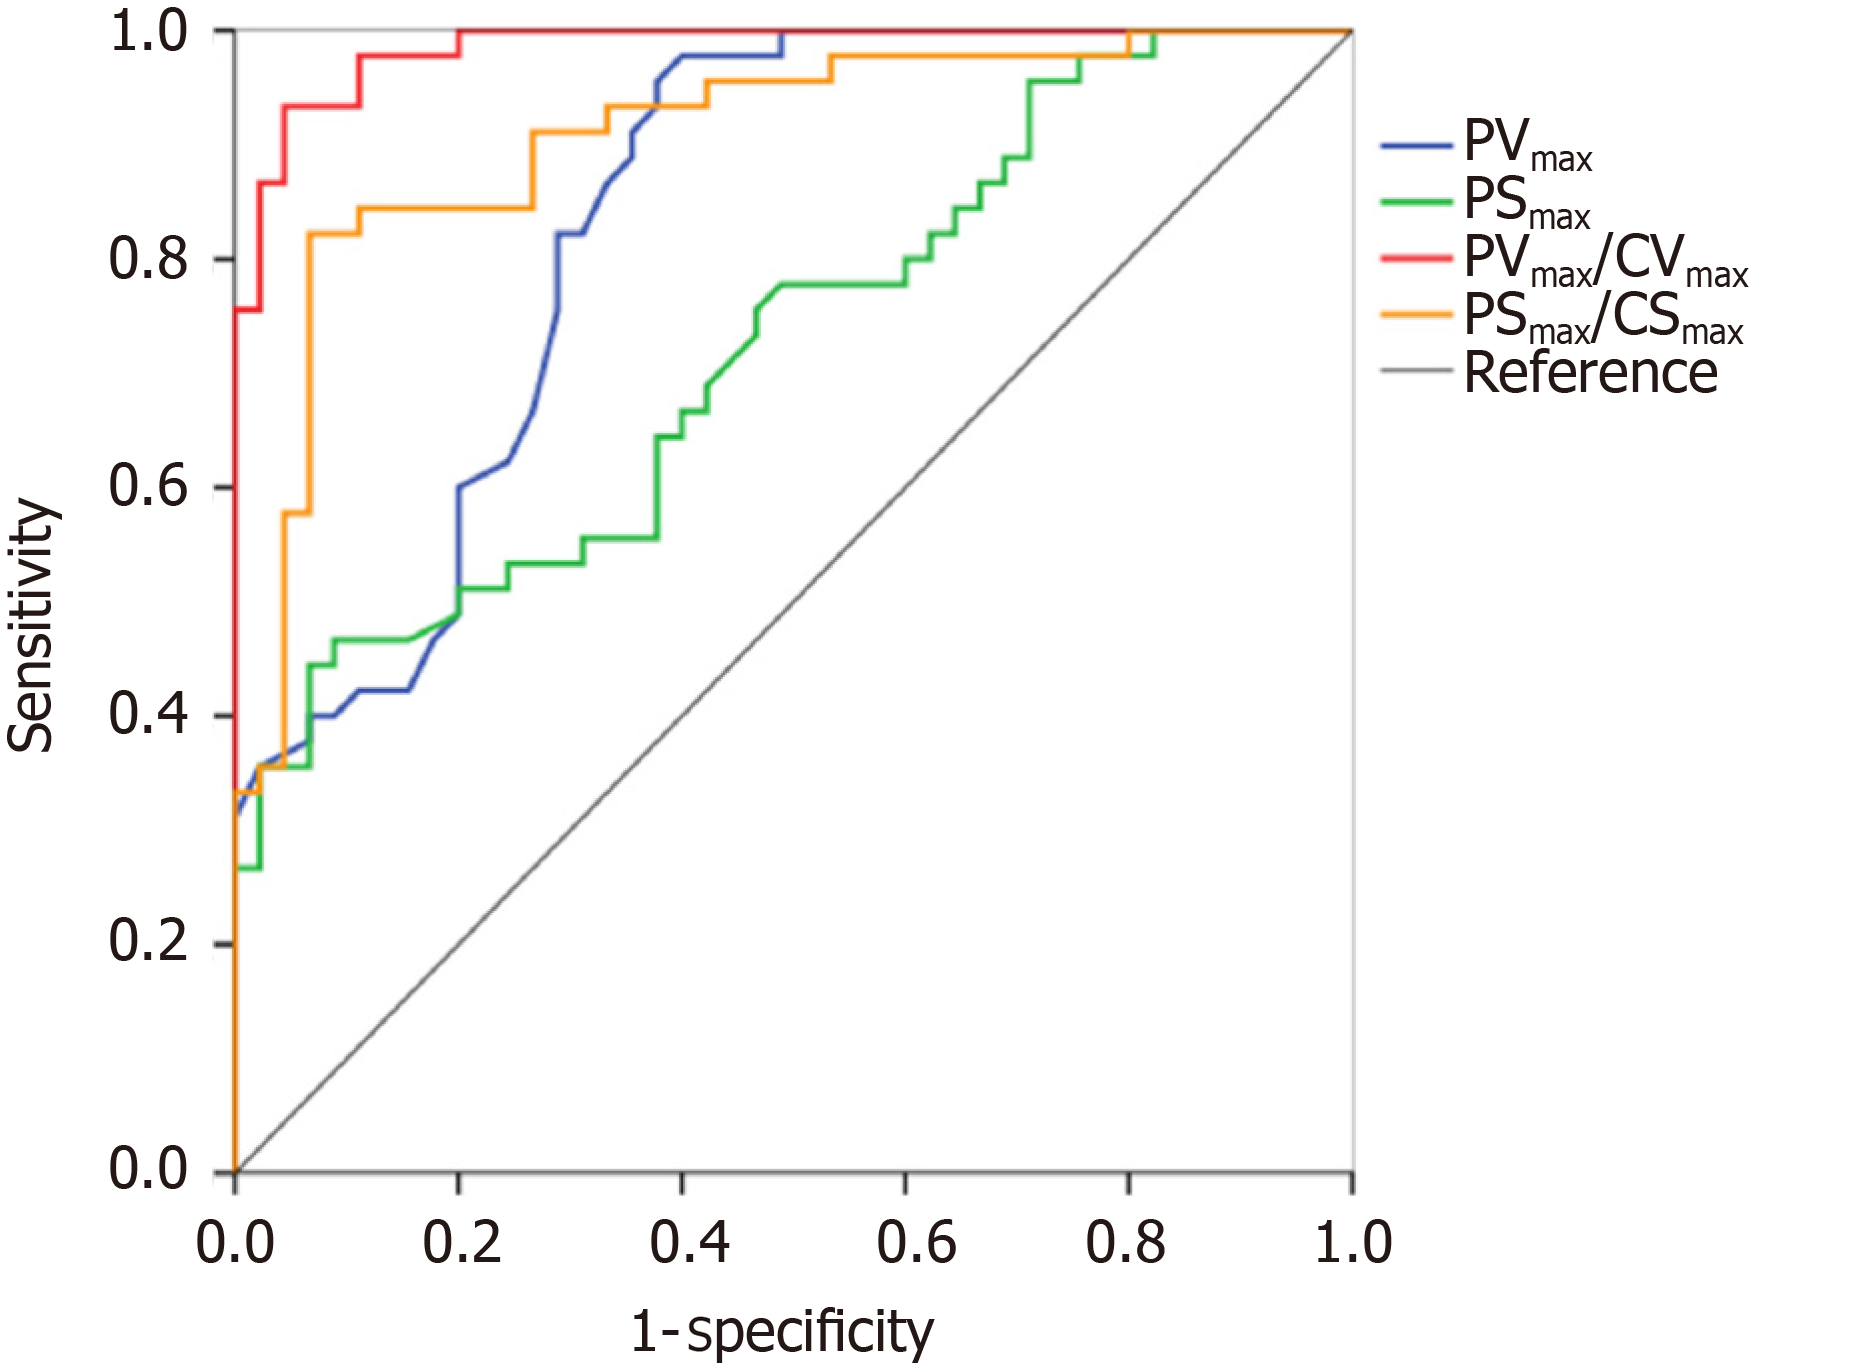
The performance of TDI measurements in the diagnosis of pneumothorax are presented in Table 3. The results of the receiver operating characteristic analysis are shown in Figure 6. The areas under the receiver operating characteristic curve of the PVmax, PSmax, PVmax/CVmax, and PSmax/CSmax were 0.84 (95%CI: 0.75, 0.92), 0.72 (95%CI: 0.62, 0.83), 0.99 (95%CI: 0.96, 1.00), and 0.91 (95%CI: 0.84, 0.97), respectively. For the discrimination of pneumothorax, the cut-off values of the PVmax, PSmax, PVmax/CVmax, and PSmax/CSmax were calculated as 0.50 cm/s, 0.94%, 1.96, and 1.12, respectively. The corresponding sensitivities and specificities of PVmax, PSmax, PVmax/CVmax, and PSmax/CSmax were 96% and 62%, 47% and 91%, 93% and 96%, and 82% and 93%, respectively.
| AUC | P value | Cut-off value | Sensitivity | Specificity | PLR | NLR | PPV | NPV | |
| PVmax (cm/s) | 0.84 (0.75, 0.92) | < 0.001 | 0.50 | 96% | 62% | 2.53 | 0.07 | 0.72 | 0.93 |
| PSmax (%) | 0.72 (0.62, 0.83) | < 0.001 | 0.94 | 47% | 91% | 5.25 | 0.84 | 0.84 | 0.63 |
| PVmax/CVmax | 0.99 (0.96, 1.00) | < 0.001 | 1.96 | 93% | 96% | 21.00 | 0.07 | 0.95 | 0.93 |
| PSmax/CSmax | 0.91 (0.84, 0.97) | < 0.001 | 1.12 | 82% | 93% | 12.33 | 0.19 | 0.93 | 0.84 |
Another two physicians (one senior physician and one resident) who were blinded to the clinical diagnosis were recruited to evaluate the 90 images in B-Mode (mainly using A-line, lung sliding, lung pulse). Eighty-five episodes were correctly diagnosed by the senior physician, with the sensitivity, specificity, positive predictive value, negative predictive value, and accuracy calculated as 93%, 96%, 95%, 93% and 94%, respectively. Meanwhile, eighty-four episodes were correctly diagnosed by the resident, with the sensitivity, specificity, positive predictive value, negative predictive value and accuracy calculated as 91%, 96%, 95%, 91% and 93%, respectively. Hence, it appears that the sensitivity and specificity of the TDI method are consistent with those of the senior physician and are better than those of the resident.
The intraobserver variabilities of the PVmax, CVmax, PSmax, and CSmax were 0.88 (95%CI: 0.79; 0.93), 0.82 (95%CI: 0.59; 0.92), 0.85 (95%CI: 0.75; 0.92), and 0.86 (95%CI: 0.77; 0.92), respectively (Table 4). The interobserver variabilities of the PVmax, CVmax, PSmax, and CSmax were 0.79 (95%CI: 0.64; 0.88), 0.75 (95%CI: 0.48; 0.87), 0.72 (95%CI: 0.54; 0.84), and 0.75 (95%CI: 0.59; 0.86), respectively. Further analysis showed that there was no clinically significant difference in the intraobserver variability between the two physi
| PVmax | CVmax | PSmax | CSmax | |
| Senior physician | ||||
| Pneumothorax | 0.87 (0.78, 0.93) | 0.85 (0.73, 0.91) | 0.84 (0.72, 0.91) | 0.88 (0.79, 0.93) |
| Non-pneumothorax | 0.88 (0.79, 0.93) | 0.82 (0.59, 0.92) | 0.85 (0.75, 0.92) | 0.86 (0.77, 0.92) |
| Resident | ||||
| Pneumothorax | 0.75 (0.59, 0.87) | 0.67 (0.47, 0.81) | 0.64 (0.43, 0.79) | 0.72 (0.48, 0.85) |
| Non-pneumothorax | 0.79 (0.64, 0.88) | 0.75 (0.48, 0.87) | 0.72 (0.54, 0.84) | 0.75 (0.59, 0.86) |
| Total | ||||
| Pneumothorax | 0.77 (0.65, 0.85) | 0.73 (0.60, 0.83) | 0.68 (0.54, 0.80) | 0.80 (0.69, 0.89) |
| Non-pneumothorax | 0.80 (0.69, 0.87) | 0.75 (0.62, 0.85) | 0.76 (0.64, 0.85) | 0.74 (0.62, 0.84) |
In this study, several measurements (e.g., PVmax, CVmax, PSmax, and CSmax) obtained using the TDI method were evaluated for the detection of pneumothorax. Our results showed that compared with other indices, the PVmax/CVmax ratio exhibited the best diagnostic performance in the diagnosis of pneumothorax. Our data demonstrated that quantification analysis of pleural line movement using TDI is useful for the diagnosis of pneumothorax. To the best of our knowledge, this is the first time that measurements obtained by TDI quantification analysis of pleural line movement have been used as a diagnostic tool for pneumothorax.
The performance of lung ultrasound has been previously evaluated. However, the performance has varied widely between studies. For example, Ziapour and Haji[17] found that if the pleural movement disappears and the B-line is used, lung ultrasound exhibited a sensitivity of 78% and a specificity of 92% for pneumothorax diagnosis[17]. Press et al[18] found a sensitivity of 91.95% and a specificity of 89.10% for the performance of pneumothorax detection via lung ultrasound[18]. In addition, lung ultrasound has also been reported to exhibit low sensitivity for pneumothorax diagnosis[19]. This may be explained by the criterion of lung sliding disappearance that is often used for pneumothorax diagnosis, in which particular expertise and training is required[20]. The Mindray ultrasound device has a very useful feature by which tissue Doppler can analyze the movements of several selected arbitrary ROIs without the need to generate a heart model. Therefore, the velocity and strain of visceral and partial pleura during respiration are easy to evaluate and can be measured with pleural line movement. Hence, tissue velocity and strain imaging in the current work were innovatively used to analyze the movement of pleural movement for the pneumothorax diagnosis. In addition, our data suggest that the interobserver variabilities of the measured indexes are moderate, and the intraobserver variabilities are low. The moderate interobserver variability is mainly due to the manual selection of ROIs. A good intraobserver agreement suggests that TDI can be well repeated by a clinical physician, indicating that this method is easy to access for the diagnosis of pneumothorax.
We found that the PVmax/CVmax calculated by data obtained from the non-pneumothorax side was greater than that from the pneumothorax side and that the PSmax/CSmax from the non-pneumothorax side was greater than that from the pneumothorax side. Compared with other indices, the PVmax/CVmax ratio exhibited the largest area under receiver operating characteristic curve for the diagnosis of pneumothorax. This suggests that the PVmax/CVmax ratio was the strongest biomarker in the diagnosis of pneumothorax in our study. In lungs under normal conditions, the velocity and strain of the pleural line seen via ultrasound represent the movement of the visceral pleura during respiration. By contrast, in the state of pneumothorax, the velocity and strain of the pleural line represent the movement of the parietal pleura during respiration. Therefore, when in the normal state, the velocity and strain describing the movements of the visceral and parietal pleura were higher than those in the state of pneumothorax. In addition, the pleural strain had a low sensitivity but a high specificity for pneumothorax diagnosis. This may be due to the perpendicular position of the imaging plane and that changes in the velocity of visceral pleura may be easier to find when compared with changes in the strain.
Our study also had several limitations. First, although some interesting points have been raised, the study had a small sample size. Second, most patients included in our study were thin, and our findings must be validated in obese patients as well. Third, Mindray’s TDI-QA ultrasound image analysis software was used, which allows cardiac probes of the pleural line, whereas other software packages are not useful without a ventricular shape. The widespread use of this method may be limited by this shortcoming. Fourth, due to poor resolution of high-frequency probes, a phased array probe would benefit quantitative assessment of pleural line movement. Fifth, a lung ultrasound loop based on the combination of respiratory cycle and ultrasound may be more useful for the quantitative analysis of lung ultrasound[21]. Unfortunately, conventional TDI software is only applicable in echocardiography where the respiratory circle is unavailable. Therefore, the respiratory cycle may need to be introduced into the software package. Finally, a larger sample size and a prospective diagnostic study is still needed to confirm our findings.
The current study utilized TDI and quantification analysis of pleural line movement to extract several indices such as the PVmax, PSmax, CVmax, and CSmax. Our findings showed that the PVmax, PSmax, PVmax/CVmax, and PSmax/CSmax are good diagnostic biomarkers for pneumothorax. Compared with the other three biomarkers, the PVmax/CVmax ratio exhibited a better diagnostic performance. Overall, quantification analysis of pleural line movement using TDI is a useful tool for the diagnosis of pneumothorax.
The criteria for pneumothorax using ultrasound is usually based on qualitative methodologies.
Tissue Doppler imaging (TDI) technology might discriminate pneumothorax by quantifying pleural line movement. Based on that, pneumothorax might be diagnosed in an objective way.
TDI can quantify pleural line movement while diagnosing pneumothorax.
Forty-five patients with unilateral pneumothorax were recruited. The pneumothorax side and contralateral normal lung side were then compared using several indices extracted from TDI, such as peak pleural line velocity (PVmax), peak chest wall tissue velocity (CVmax), peak pleural line strain value (PSmax), peak chest wall tissue strain value, PVmax/CVmax, and PSmax/peak chest wall tissue strain value. Receiver operating characteristic analysis was used to evaluate the performance of these quantitative assessments for pneumothorax diagnosis.
PVmax, PSmax, PVmax/CVmax, PSmax/peak chest wall tissue strain value obtained on the pneumothorax side were lower than those on the non-pneumothorax side. The PVmax/CVmax was the best index for the detection of pneumothorax with an area under receiver operating characteristic curve of 0.99.
Therefore, we concluded that TDI is an effective tool for the diagnosis of pneumothorax.
Further research is required to validate our findings in suspected cases.
Manuscript source: Unsolicited manuscript
Specialty type: Medicine, research and experimental
Country/Territory of origin: China
Peer-review report’s scientific quality classification
Grade A (Excellent): 0
Grade B (Very good): 0
Grade C (Good): C
Grade D (Fair): 0
Grade E (Poor): 0
P-Reviewer: Vetrugno L S-Editor: Fan JR L-Editor: Filipodia P-Editor: Xing YX
| 1. | Kelly AM, Weldon D, Tsang AY, Graham CA. Comparison between two methods for estimating pneumothorax size from chest X-rays. Respir Med. 2006;100:1356-1359. [RCA] [PubMed] [DOI] [Full Text] [Cited by in Crossref: 30] [Cited by in RCA: 34] [Article Influence: 1.8] [Reference Citation Analysis (0)] |
| 2. | Beckmann U, Gillies DM, Berenholtz SM, Wu AW, Pronovost P. Incidents relating to the intra-hospital transfer of critically ill patients. An analysis of the reports submitted to the Australian Incident Monitoring Study in Intensive Care. Intensive Care Med. 2004;30:1579-1585. [RCA] [PubMed] [DOI] [Full Text] [Cited by in Crossref: 359] [Cited by in RCA: 292] [Article Influence: 13.9] [Reference Citation Analysis (0)] |
| 3. | Kirkpatrick AW, Sirois M, Laupland KB, Liu D, Rowan K, Ball CG, Hameed SM, Brown R, Simons R, Dulchavsky SA, Hamiilton DR, Nicolaou S. Hand-held thoracic sonography for detecting post-traumatic pneumothoraces: the Extended Focused Assessment with Sonography for Trauma (EFAST). J Trauma. 2004;57:288-295. [RCA] [PubMed] [DOI] [Full Text] [Cited by in Crossref: 424] [Cited by in RCA: 397] [Article Influence: 18.9] [Reference Citation Analysis (0)] |
| 4. | Xirouchaki N, Magkanas E, Vaporidi K, Kondili E, Plataki M, Patrianakos A, Akoumianaki E, Georgopoulos D. Lung ultrasound in critically ill patients: comparison with bedside chest radiography. Intensive Care Med. 2011;37:1488-1493. [RCA] [PubMed] [DOI] [Full Text] [Cited by in Crossref: 355] [Cited by in RCA: 299] [Article Influence: 21.4] [Reference Citation Analysis (0)] |
| 5. | Lichtenstein DA, Menu Y. A bedside ultrasound sign ruling out pneumothorax in the critically ill. Lung sliding. Chest. 1995;108:1345-1348. [RCA] [PubMed] [DOI] [Full Text] [Cited by in Crossref: 538] [Cited by in RCA: 477] [Article Influence: 15.9] [Reference Citation Analysis (0)] |
| 6. | Lichtenstein D, Mezière G, Biderman P, Gepner A. The "lung point": an ultrasound sign specific to pneumothorax. Intensive Care Med. 2000;26:1434-1440. [RCA] [PubMed] [DOI] [Full Text] [Cited by in Crossref: 484] [Cited by in RCA: 425] [Article Influence: 17.0] [Reference Citation Analysis (0)] |
| 7. | Moreno-Aguilar G, Lichtenstein D. Lung ultrasound in the critically ill (LUCI) and the lung point: a sign specific to pneumothorax which cannot be mimicked. Crit Care. 2015;19:311. [RCA] [PubMed] [DOI] [Full Text] [Full Text (PDF)] [Cited by in Crossref: 15] [Cited by in RCA: 15] [Article Influence: 1.5] [Reference Citation Analysis (0)] |
| 8. | Lichtenstein DA, Mezière GA. Relevance of lung ultrasound in the diagnosis of acute respiratory failure: the BLUE protocol. Chest. 2008;134:117-125. [RCA] [PubMed] [DOI] [Full Text] [Cited by in Crossref: 1152] [Cited by in RCA: 1188] [Article Influence: 69.9] [Reference Citation Analysis (0)] |
| 9. | Del Colle A, Carpagnano GE, Feragalli B, Foschino Barbaro MP, Lacedonia D, Scioscia G, Quarato CMI, Buonamico E, Tinti MG, Rea G, Cipriani C, Frongillo E, De Cosmo S, Guglielmi G, Sperandeo M. Transthoracic ultrasound sign in severe asthmatic patients: a lack of "gliding sign" mimic pneumothorax. BJR Case Rep. 2019;5:20190030. [RCA] [PubMed] [DOI] [Full Text] [Full Text (PDF)] [Cited by in Crossref: 3] [Cited by in RCA: 10] [Article Influence: 1.7] [Reference Citation Analysis (0)] |
| 10. | Gelabert C, Nelson M. Bleb point: mimicker of pneumothorax in bullous lung disease. West J Emerg Med. 2015;16:447-449. [RCA] [PubMed] [DOI] [Full Text] [Full Text (PDF)] [Cited by in Crossref: 15] [Cited by in RCA: 15] [Article Influence: 1.5] [Reference Citation Analysis (0)] |
| 11. | Slater A, Goodwin M, Anderson KE, Gleeson FV. COPD can mimic the appearance of pneumothorax on thoracic ultrasound. Chest. 2006;129:545-550. [RCA] [PubMed] [DOI] [Full Text] [Cited by in Crossref: 60] [Cited by in RCA: 53] [Article Influence: 2.8] [Reference Citation Analysis (0)] |
| 12. | Ding W, Shen Y, Yang J, He X, Zhang M. Diagnosis of pneumothorax by radiography and ultrasonography: a meta-analysis. Chest. 2011;140:859-866. [RCA] [PubMed] [DOI] [Full Text] [Cited by in Crossref: 205] [Cited by in RCA: 225] [Article Influence: 16.1] [Reference Citation Analysis (0)] |
| 13. | Schrift D, Barron K, Wagner M, Arya R. A case report of lung ultrasound missing a pneumothorax due to patient positioning. Ultrasound. 2017;25:248-250. [RCA] [PubMed] [DOI] [Full Text] [Cited by in Crossref: 2] [Cited by in RCA: 5] [Article Influence: 0.6] [Reference Citation Analysis (0)] |
| 14. | Mullens W, Borowski AG, Curtin RJ, Thomas JD, Tang WH. Tissue Doppler imaging in the estimation of intracardiac filling pressure in decompensated patients with advanced systolic heart failure. Circulation. 2009;119:62-70. [RCA] [PubMed] [DOI] [Full Text] [Full Text (PDF)] [Cited by in Crossref: 367] [Cited by in RCA: 328] [Article Influence: 20.5] [Reference Citation Analysis (0)] |
| 15. | Hoffmann S, Mogelvang R, Sogaard P, Iversen AZ, Hvelplund A, Schaadt BK, Fritz-Hansen T, Galatius S, Risum N, Biering-Sørensen T, Jensen JS. Tissue Doppler echocardiography reveals impaired cardiac function in patients with reversible ischaemia. Eur J Echocardiogr. 2011;12:628-634. [RCA] [PubMed] [DOI] [Full Text] [Cited by in Crossref: 13] [Cited by in RCA: 15] [Article Influence: 1.1] [Reference Citation Analysis (0)] |
| 16. | Yu CM, Gorcsan J 3rd, Bleeker GB, Zhang Q, Schalij MJ, Suffoletto MS, Fung JW, Schwartzman D, Chan YS, Tanabe M, Bax JJ. Usefulness of tissue Doppler velocity and strain dyssynchrony for predicting left ventricular reverse remodeling response after cardiac resynchronization therapy. Am J Cardiol. 2007;100:1263-1270. [RCA] [PubMed] [DOI] [Full Text] [Cited by in Crossref: 131] [Cited by in RCA: 130] [Article Influence: 7.2] [Reference Citation Analysis (0)] |
| 17. | Ziapour B, Haji HS. "Anterior convergent" chest probing in rapid ultrasound transducer positioning vs formal chest ultrasonography to detect pneumothorax during the primary survey of hospital trauma patients: a diagnostic accuracy study. J Trauma Manag Outcomes. 2015;9:9. [RCA] [PubMed] [DOI] [Full Text] [Full Text (PDF)] [Cited by in Crossref: 7] [Cited by in RCA: 8] [Article Influence: 0.8] [Reference Citation Analysis (0)] |
| 18. | Press GM, Miller SK, Hassan IA, Alade KH, Camp E, Junco DD, Holcomb JB. Prospective evaluation of prehospital trauma ultrasound during aeromedical transport. J Emerg Med. 2014;47:638-645. [RCA] [PubMed] [DOI] [Full Text] [Cited by in Crossref: 54] [Cited by in RCA: 64] [Article Influence: 5.8] [Reference Citation Analysis (0)] |
| 19. | Trovato G, Sperandeo M. Lung Ultrasound in Pneumothorax: The Continuing Need for Radiology. J Emerg Med. 2016;51:189-191. [RCA] [PubMed] [DOI] [Full Text] [Cited by in Crossref: 11] [Cited by in RCA: 10] [Article Influence: 1.1] [Reference Citation Analysis (0)] |
| 20. | Alrajab S, Youssef AM, Akkus NI, Caldito G. Pleural ultrasonography vs chest radiography for the diagnosis of pneumothorax: review of the literature and meta-analysis. Crit Care. 2013;17:R208. [RCA] [PubMed] [DOI] [Full Text] [Full Text (PDF)] [Cited by in Crossref: 241] [Cited by in RCA: 262] [Article Influence: 21.8] [Reference Citation Analysis (0)] |
| 21. | Duclos G, Bobbia X, Markarian T, Muller L, Cheyssac C, Castillon S, Resseguier N, Boussuges A, Volpicelli G, Leone M, Zieleskiewicz L. Speckle tracking quantification of lung sliding for the diagnosis of pneumothorax: a multicentric observational study. Intensive Care Med. 2019;45:1212-1218. [RCA] [PubMed] [DOI] [Full Text] [Cited by in Crossref: 11] [Cited by in RCA: 8] [Article Influence: 1.3] [Reference Citation Analysis (0)] |


