


Published online Jun 26, 2021. doi: 10.12998/wjcc.v9.i18.4573
Peer-review started: July 22, 2020
First decision: December 21, 2020
Revised: December 25, 2020
Accepted: March 10, 2021
Article in press: March 10, 2021
Published online: June 26, 2021
Processing time: 312 Days and 8.2 Hours
Down syndrome (DS) is one of the most common chromosomal aneuploidy diseases. Prenatal screening and diagnostic tests can aid the early diagnosis, appropriate management of these fetuses, and give parents an informed choice about whether or not to terminate a pregnancy. In recent years, investigations have been conducted to achieve a high detection rate (DR) and reduce the false positive rate (FPR). Hospitals have accumulated large numbers of screened cases. However, artificial intelligence methods are rarely used in the risk assessment of prenatal screening for DS.
To use a support vector machine algorithm, classification and regression tree algorithm, and AdaBoost algorithm in machine learning for modeling and analysis of prenatal DS screening.
The dataset was from the Center for Prenatal Diagnosis at the First Hospital of Jilin University. We designed and developed intelligent algorithms based on the synthetic minority over-sampling technique (SMOTE)-Tomek and adaptive synthetic sampling over-sampling techniques to preprocess the dataset of prenatal screening information. The machine learning model was then established. Finally, the feasibility of artificial intelligence algorithms in DS screening evaluation is discussed.
The database contained 31 DS diagnosed cases, accounting for 0.03% of all patients. The dataset showed a large difference between the numbers of DS affected and non-affected cases. A combination of over-sampling and under-sampling techniques can greatly increase the performance of the algorithm at processing non-balanced datasets. As the number of iterations increases, the combination of the classification and regression tree algorithm and the SMOTE-Tomek over-sampling technique can obtain a high DR while keeping the FPR to a minimum.
The support vector machine algorithm and the classification and regression tree algorithm achieved good results on the DS screening dataset. When the T21 risk cutoff value was set to 270, machine learning methods had a higher DR and a lower FPR than statistical methods.
Core Tip: Down syndrome (DS) screening data tend to have a large overall data pool with a small proportion of positive cases. The use of data mining algorithms for these data can sufficiently mine the hidden correlation between natural information and patient outcomes and help doctors achieve the diagnosis of DS. This study used the support vector machine and classification and regression tree algorithms to construct a classification model for DS screening and achieved good results on the DS screening dataset.
- Citation: Zhang HG, Jiang YT, Dai SD, Li L, Hu XN, Liu RZ. Application of intelligent algorithms in Down syndrome screening during second trimester pregnancy. World J Clin Cases 2021; 9(18): 4573-4584
- URL: https://www.wjgnet.com/2307-8960/full/v9/i18/4573.htm
- DOI: https://dx.doi.org/10.12998/wjcc.v9.i18.4573
Down syndrome (DS) is one of the most common chromosomal aneuploidy diseases, and its overall incidence is 1/733 in live births[1]. Prenatal screening and diagnostic tests can aid the early diagnosis and appropriate management of these fetuses[2]. Second trimester maternal serum screening includes a double test [alpha-fetoprotein (AFP) + beta subunit of human chorionic gonadotropin (β-hCG)], a triple test [double test + unconjugated estriol (uE3)], and a quadruple test (triple test + inhibin A). The double test has been reported to have a detection rate (DR) of 56% for fetal trisomy 21 with a false positive rate (FPR) of 5%[3], and the quadruple test achieves a DR of up to 81% with a FPR of 5%[4]. Due to the limitations of DS screening technology, approximately 30% cases of DS were not found[5], which led to missed diagnoses of these cases. Therefore, the DR and FPR of these methods need to be improved.
With the popularization of prenatal screening in hospitals, prenatal screening laboratories have accumulated large numbers of screened cases. For these cases, hospitals recorded not only the test results for the aforementioned three markers but also natural information, lifestyle habits, family background, pregnancy outcomes, and other information regarding the patients and their families. These huge amounts of data contain the statistical characteristics of various indicators in DS screening for populations in corresponding regions. Issues in recent years have included how to fully utilize these cumulative data to provide consultation reference and rational basis for patients and construction of statistical models for DS screening that are suitable for specific regions.
DS screening data tend to have a large overall data pool with a small proportion of DS affected cases. The use of data mining algorithms for these data can sufficiently mine the hidden correlation between natural information and patient outcomes and help doctors achieve the diagnosis of DS. Current literature indicates that the application of machine learning to DS screening and evaluation focuses mainly on three aspects. The first is the use of machine learning and data mining methods to discover the correlation between different protein concentrations and chromosome 21 abnormalities in order to discover new serum markers suitable for DS screening[6]. The second is the use of convolutional neural networks to identify patients’ genetic maps and construct a DS screening model based on genetic maps[7]. The third is the use of principal component analysis and linear discriminant analysis for feature extraction from facial images of patients with DS, followed by Gabor wavelet transformation for image classification, which facilitates the diagnosis of DS based on facial features[8]. Machine learning algorithms to improve performance in first trimester DS screening have also been evaluated[9].
The aim of this study was to explore the application of artificial intelligence algorithms in data evaluation for DS screening in the second trimester of pregnancy. First, the data were processed, and then the machine learning model was established. Finally, the feasibility of artificial intelligence algorithms in DS screening evaluation is discussed.
This study was approved by the Ethics Committee of the First Hospital of Jilin University, No. 2018-387.
The dataset used in this study was obtained from the Center for Prenatal Diagnosis at the First Hospital of Jilin University. The DS screening database includes the patients’ basic information, the results of serum tests, and the results of postpartum visits. The database comprises 58 fields and 100138 records, and its main fields are shown in Table 1. Through screening of traditional laboratory markers, 4953 cases were screened as high-risk records. After further diagnosis and follow-up, 31 DS affected cases (23 true positive cases and 8 false negative cases) were confirmed. 4930 cases were considered as false positive. The dataset’s T21 risk value in this dataset records the risk of the fetus having chromosome abnormalities (represents the probability of delivering a newborn with abnormalities. The risk is the inverse of this probability). The cutoff value for risk is usually set to = 270. If < 270, the patient is at high risk of DS, in which case amniocentesis is usually recommended to confirm the karyotype of the fetus.
| S/N | Date of receipt | Pregnant mother number | Sample number |
| Date of birth | Blood sampling date | Expected age at delivery | T21 age riskvalue |
| T18 age risk | AFP MoM1 | hCGb MoM | uE3 MoM |
| AFP concentration2 | hCGb concentration | uE3 concentration | Gestational age |
| Body weight | Examination unit | Date of last menstruation | Ethnicity/race |
| Menstrual cycle | History of abnormal pregnancy | Smoking status | CRL3 |
| BPD4 | NT5 | Fetal chromosomal karyotype | Pregnancy outcomes |
At present, the problem of DS screening can be considered a binary classification problem in which the concentrations of three serum markers, natural information, lifestyle habits, family background, and other information are entered into the model. The model then produces a prediction result of affected or non-affected by DS. This type of problem can be resolved using machine learning. Existing data can be divided into training and test sets, and the training data can be used to train a binary classifier; while the test set is used for validation and evaluation of the DR and FPR of the model.
This study used the support vector machine (SVM) and classification and regression tree (CART) algorithms to construct a classification model for DS screening. Considering that the number of DS affected cases in the raw dataset was far lower than the number of non-affected cases, the synthetic minority over-sampling technique (SMOTE)-Tomek and adaptive synthetic sampling (ADASYN) algorithms were used for resampling so that the numbers of samples chosen from the two types of data tends toward equilibrium, thereby increasing the accuracy and recall rates of the aforementioned algorithms in classification problems. The downsampling method (Tomek) was used to reconstruct the original dataset. As there was noise in the data from both normal subjects and patients with DS, we performed data cleaning by removing the Tomek lines in the dataset. The definition of Tomek lines and the details of this approach are mentioned in the following parts of this study. Furthermore, as the dataset was still unbalanced after the aforementioned approach, making it difficult to perform the classification, we integrated the ADASYN or AdaBoost method to perform over-sampling. The combination of the CART and AdaBoost algorithms trains only weak classifiers with low performance during each iteration. Self-adaptive adjustment of the weights of these weak classifiers in the final decision was used to construct a more accurate classification model.
As mentioned in the preceding text, clinical detection facilities can carry out inference regarding the levels of the three screening markers in blood and the patients’ general information to provide a risk value (T21) of the fetus having DS. When that risk value exceeds a set cutoff value, that fetus is deemed to be at high risk of having DS, and suggestions for further examination are provided. We conducted an experiment wherein we selected the cutoff value using different T21 risk values and trained classification models on the raw dataset using the same algorithm, and then compared the model’s prediction results when different T21 values were used, thereby making rational suggestions for the T21 risk cutoff value.
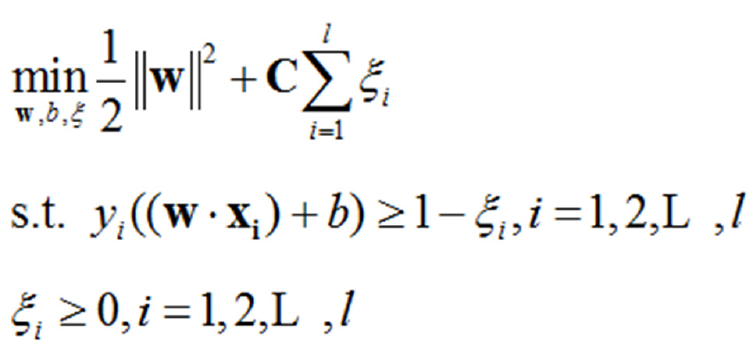
SVM classification methods are widely used in classification and regression problems[10]. However, in this type of skewed dataset, the small number of DS affected samples is buried within an extremely large number of DS non-affected samples. This causes SVM algorithms to tend towards learning a hyperplane that is closer to the DS affected samples, resulting in reduced classifier performance and a lower DR. For SVM on linearly indivisible data, the original optimization problem is as follows Formula 1:
 (1.1)
(1.1)
Where [(xi, yi)]is the training dataset, “l” is the number of samples in the dataset, “w” is the normal vector of the classification hyperplane, “b” is bias, “w” is a relaxation factor, and is a penalty factor. The latter two are used to increase the model’s generalization ability. Because the number of DS non-affected cases is far greater than the number of DS affected cases, the penalty value for DS non-affected samples is far higher than that for DS affected samples. This thereby results in a solution tending towards maximization of the interval between DS non-affected samples and the classification hyperplane, so that the classification hyperplane in SVM learning tends to be closer to that of DS affected samples. Through over-sampling combined with under-sampling techniques, we can obtain good results by increasing classification accuracy.
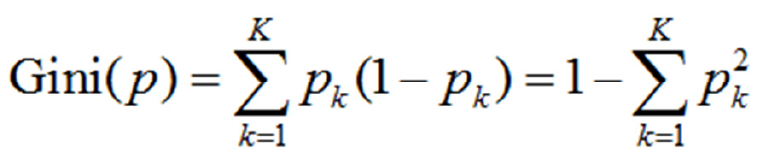
CART prediction models have a tree structure, wherein the branches represent the observed values and the leaf nodes represent the target values (category labels). During training, a marker is used for recursive segmentation of the training set into several subsets. Iterations are stopped when the categories of certain subsets become identical or reach a certain proportion[11]. CART algorithms are divided into generation of decision trees and pruning steps. This paper uses CART algorithms to solve classification problems. Thus, the probability that the sample point belongs to the kth type is assumed to be Pk and the Gini index of the probability distribution is defined as follows Formula 2:
 (1.2)
(1.2)
With regard to the binary classification problem in this study, if the probability that the sample point is a DS affected case is p, then the Gini index of the probability distribution is as follows: Gini(p)=2p(1-p)
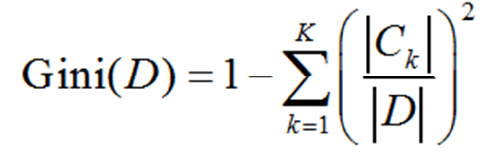
For a given set of samples “D”, the Gini exponent is Formula 3:
 (1.3)
(1.3)
Here, CK is the sample subset of “D” that belongs to the Kth class and “K” is the number of classes.
The CART synthesis algorithm is as follows: Algorithm 1: CART synthesis algorithm; input: Training dataset, stopping condition: Output: CART decision tree.
According to the training dataset, the following operations are carried out recursively on each node starting from the root nodes to construct a binary decision tree: (1) calculation of the Gini indices for existing features in the dataset D. For each feature A and each possible value a, and according to the A = a test result of “Yes” or “No” for each sample point, D is segmented into D1andD2, and equation (1.3) is used to calculate the Gini index at A = a; (2) out of all possible features A and the impossible cutoff points a, the feature with the smallest Gini index and its corresponding cutoff point were selected as the optimized feature and optimized cutoff point, respectively. From this, the current node is used to generate two child nodes, and one feature of the training dataset is allocated to two child nodes; (3) recursive calls of (1) and (2) are carried out on the two child nodes until the stopping conditions are satisfied; and (4) generation of the CART decision tree.
Generally, L (the stopping condition for the algorithm) is that the number of samples at a node must be below a preset cutoff value or that the Gini index of the sample must be smaller than the preset cutoff value.
Resampling methods for datasets include over-sampling and under-sampling. The SMOTE generates some samples in categories with fewer samples to adjust the proportion of samples in two types of datasets, so that the proportion tends towards equilibriumin order to improve the performance of the algorithm[12].
The concept of Tomek is to clean up new samples after SMOTE over-sampling. In classification problems, “x” is set as a sample for category “A”, “y” is a sample for category “B”, “d (x, y)”is the distance between “x” and “y”, and then “(x, y)”is a Tomek-link pair. If only“z”, then “d (x, y)<d (x, z)” and “d (x, y) <d (y, z)”. Using the new sample points “xk” generated by SMOTE as the center, the length “l” of the Tomek-link is the radius, and then the number of minority samples in that space is
Cminority/ Cmajority<ε, ε∈[0,1] (1.4)
In which the newly synthesized points “xk” are considered invalid and will be removed before the next round of SMOTE training. Conversely, when “Cminority/ Cmajority>ε”, these points are retained as newly added minority samples.
Samples that were misclassified by previous classifiers were here used to train the next classifiers. The final model is obtained through multiple weak classifiers[13]. The algorithm’s procedure is as follows:
Algorithm 2: Method.
Input: (x1, y1), (x2, y2), …,(xm, ym), where xi∈ X, yi∈Y = {-1, 1}.
Initial value: D1 (i) = 1/m.
For t = 1, …, T:
The distribution “Dt”is used to train weak classifiers.
To obtain the assumption hi X→{-1, 1}, with an error probability of Formula 4 .
.
So that Formula 5:
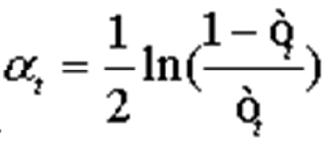 .
.
This was updated to Formula 6:
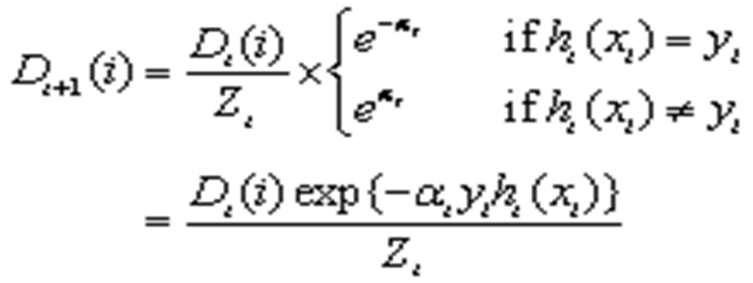 .
.
Where “Zt” is a normalization factor, so that “Dt+1”becomes a probability distribution.
Output: Final hypothesis Formula 7:
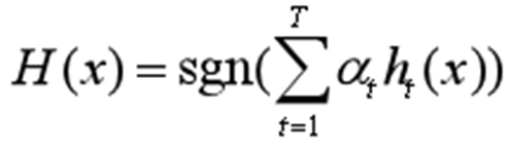 (1.5)
(1.5)
The procedure for ADASYN is as follows[14]: Input: The entire training set includes “m” samples (xi, yi) i = 1, 2, …, m, msis used to represent the number of minority samples and “mi” the number of majority samples.
Algorithm:
Calculation of class imbalance “d = ms/ mi”.
Calculation of the total number of minority samples that require synthesis: “G= (mi-ms) × β”. In the equation, β ∈ [0,1] represents the expected imbalance after synthesis of samples.
For every sample “xi” in the minority class, its K nearest neighbors in the nth dimensional space are identified and their ratio ri = Δi/K, i = 1, 2, …, mwas calculated, where Δi is the number of majority samples in the K nearest neighbors of “xi”.
Formula 8 is used to regularize “ri” Therefore,“ȓi” is the probability distribution.
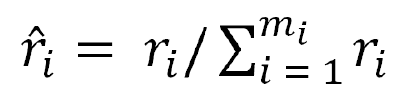
Calculation of the number of samples that require synthesis for every minority sample xi,gi = ȓi× G, where “G” is the total number of synthetic samples.
Synthesize “gi” samples for every minority sample “xi”. During each iteration, a minority sample “xzi” is randomly selected from the K nearest neighbors of “xi”. Sample “si” is synthesized according to si=xi+ (xzi- xi) × λ. In the equation, “λ” is a random variable and λ ∈[0,1].
Data preprocessing: This study selected expected age of delivery, AFP concentration, hCG concentration, uE3 concentration, body weight, gestational age, and other data as features to train machine learning models. Various records in the raw data were used to comprehensively analyze the pregnancy outcomes of patients (whether babies with DS were delivered), and this result was recorded in the results field. Table 2 shows some data after feature selection.
| ID | Expected age at delivery | AFP concentration | hCGb concentration | uE3 concentration | Body weight | Gestational age | Result |
| 783 | 19.633 | 23.22 | 30.71 | 5.35 | 60.7 | 17.6 | 1 |
| 1504 | 39.403 | 44.1 | 30.41 | 3.87 | 62 | 16.4 | 1 |
| 4338 | 30.527 | 23.73 | 26.29 | 5.86 | 65 | 18.5 | 1 |
| 6050 | 34.489 | 11.53 | 52.42 | 9.8 | 52.5 | 20.6 | 1 |
| 6412 | 41.966 | 24.51 | 49.67 | 3.91 | 58 | 19 | 1 |
Resampling and normalization: The SMOTE-Tomek or ADASYN algorithms were used for resampling of the raw data so that the number of DS affected and non-affected samples tended towards equilibrium. Following that, a 9:1 ratio was used to divide the data into training and test sets, and the training and test samples were normalized. For normalization, the Z-score standardization method was used, with a normalization formula of
z = (x-μ)/σ (1.6)
In the equation, “μ”and “σ” are the mean and standard deviation of the dataset, respectively. After normalization, the mean and variance of every field were 0 and 1, respectively.
In this study, machine learning methods were used to construct a mathematical model for assessment of second trimester DS screening results to provide a basis for self-evaluation by pregnant women before diagnosis and aid physicians in diagnosis. This provides a new method for second trimester DS screening and avoids the need for manual delineation of marker cutoff values. This method increases efficiency and accuracy while decreasing strain on staff resources.
The preprocessed training set data were used for modeling using the SVM or CART algorithm in combination with the AdaBoost algorithm. After the statistical model was established, the model was used on the test set samples to obtain prediction results and for evaluation of the model’s prediction performance. With regard to the severe imbalance in the number of samples in the dataset, this study proposed the application of the SMOTE-Tomek and ADASYN algorithms for resampling of the raw data to improve the DR and FPR of the original algorithm.
In SVM model training, suitable parameters “w” and “b” were identified from the multidimensional space to construct an-dimensional (n = 6) hyperplane wTx + b = 0so that the distance between that plane and the support vector is maximized (i.e., the training of the SVM algorithm is completed). Specifically, the preprocessed dataset was recorded as T = [(x1, y1), (x2, y2), …,(xN, yN)], where xi(i = 1, 2, …,N)is the feature vector of the sample, and “yi” is the corresponding training label for “xi”. By constructing and solving a constrained optimization problem (1.1), we can obtain optimal solutions “w*” and “b*”. From this, we can obtain the classification hyperplane w*x + b* = 0. The classification decision function is
f(x) = sign(w*x +b*) (1.7)
In the raw data, the T21 risk value, which is an integer with a value of (0,100000), is the diagnosis result. In practice, a T21 risk value of 270 was taken as the cutoff value for high vs low risk of DS. We evaluated the rationality of this value by testing the performance of prediction algorithms when different cutoff values were used and a comparison with statistical methods. This was used to solve the problem of selecting T21 risk cutoff values that are more suitable for specific regional populations.
The CART model was used for modeling of the dataset. The Gini index of each attribute was calculated using equation (1.3). A smaller Gini index is associated with cleaner data. If the attribute values are discrete, all possible subsets of the known dataset are examined, and the Gini indices of these subsets are calculated. From these calculated values, the subset with the lowest Gini index was selected for attribute splitting. In situations in which the attribute values are continuous, the attribute values are arranged in ascending or descending order and the intermediate value between neighboring values was taken as a possible split point to divide the dataset into two subsets.
The attribute with the lowest Gini index was used to divide the samples into two subsets before recursive construction of various child nodes of the CART. Cycles were conducted until the sample classes at all leaf nodes were generally identical. This algorithm is implemented as follows: (1) various features were traversed, and all possible values of each feature (b1, b2, …, bk, …, bns) were arranged in ascending order. The value of bk in every sample was recorded as (bk)i, tk was defined as all possible values after (bk)i was arranged. Data that satisfied (bk)i <t,k were taken as the left subtree, while data that satisfied (bk)i ≥t, k were taken as the right subtree. For all possible k values, the corresponding tk values were calculated to separate the Gini indices obtained in the training set. The tk value with the smallest Gini index was taken as the split point tkz; (2) for ns feature bk, the value of the corresponding split point tkz was found and compared to find the smallest Gini index, Gini(min). The normalized feature value of Gini(min) and the split point kz were taken as the reference feature values and reference split point, respectively. Then, the training set(bkj)i <tkzj was taken as the left subtree, and (bkj)i ≥tkzj as the right subtree. The training set was taken as the root node and the two subtrees were taken as two branch nodes; and (3) the two branch nodes obtained from the aforementioned steps were further separated into left and right subtrees according to steps (1) and (2) to form two child nodes. This process was repeated as necessary, so the child nodes were further separated, and new child nodes were generated at every point of separation until the dataset of each new child node belonged to the same category or the number of samples in all new child nodes were below the preset cutoff value. Then, the new child nodes were taken as leaf nodes, and the entire CART decision tree prediction model was synthesized.
In the aforementioned constructed decision tree model, the training of a deeper decision tree requires a large training cost. For this reason, the AdaBoost method was used to weight the superficial decision trees with fewer layers and make them easier to train. The common result of several weak classifiers was used to provide a fixed output, i.e., equation (1.5), which was used to output the final result.
Experimental platform: The previously mentioned database covering prenatal DS screening and postnatal follow-up was used in this study. The experimental platforms were Windows 7 Professional 64-bit, Python 3.6.3, Pandas 0.20.3, and scikit-learn 0.19.1.
Evaluation markers: We used DR and FPR to evaluate model performance. The minority class was defined as “P” and the majority class as “N”, “FP” is the total number of samples from the majority class that were misclassified into the minority class, “FN” is the total number of samples from the minority class that were misclassified into the majority class, “TN” represents majority class samples that were correctly classified, and “TP” represents minority class samples that were correctly classified. Therefore, “DP” and “FPR” can be expressed as follows:
DR = TP/(TP+FN) (1.8)
FPR = FP/(TP+FP) (1.9)
The database contained 31 diagnosed DS cases, accounting for 0.03% of all patients. This dataset showed a large difference between the numbers of DS affected samples and non-affected cases. Two main methods are currently used to resolve skewed datasets: The first is to resample the dataset to adjust the proportion of DS affected and non-affected samples so that the quantity of the DS affected and non-affected groups will tend towards equilibrium. The second method is to modify the algorithm so that it is more suitable for classification of a small number of samples. The present study uses both of these methods combined with different classification algorithms for data processing to increase the accuracy of classification and decrease the FPR.
This study’s method was the use of identical training and test sets, and we used different machine learning algorithms to conduct model training and performance evaluation employing the dataset. The results are shown in Table 3. The experimental results show that a combination of over-sampling and under-sampling techniques can greatly increase the performance of the algorithm at processing non-balanced datasets. As the number of iterations increases, the combination of the CART algorithm and the SMOTE-Tomek over-sampling technique can obtain a high DR while keeping the FPR to a minimum.
| Algorithm | DR | FPR | Time |
| CART+AdaBoost | 0.2941 | 0.2857 | 0:09:54 |
| SVM+SMOTE-Tomek | 1 | 0.0183 | 0:09:01 |
| CART+AdaBoost+SMOTE-Tomek,maxdepth=2,iter=100 | 0.9777 | 0.2337 | 0:02:14 |
| CART+AdaBoost+SMOTE-Tomek,maxdepth=2,iter=500 | 0.9909 | 0.1382 | 07:18.0 |
| CART+AdaBoost+SMOTE-Tomek,maxdepth=5,iter=100 | 0.9987 | 0.0102 | 0:03:15 |
| CART+AdaBoost+SMOTE-Tomek,maxdepth=5,iter=500 | 0.9993 | 0.0028 | 0:11:37 |
| SVM+EasyEnsemble | 1 | 0.9973 | 0.00348 |
| SVM+ADASYN | 0.9863 | 0.0932 | 0:11:05 |
Although numerous methods of medical decision making using machine learning algorithms exist, research in machine learning for DS screening has rarely been reported to date. Neocleous et al[15] presented an approach for first trimester noninvasive prenatal diagnosis using algorithms such as artificial neural networks, SVM, and k-nearest neighbors to build diagnosis models. Their experiments showed that the artificial neural networks method performs as well as existing diagnosis systems. Kang et al[16] were the first to implement multivariate statistical analysis methods such as principal component analysis, partial least squares-discriminant analysis, and SVM to model pregnancy serum levels in normal pregnant women and DS subjects.
These studies utilized data preprocessing methods along with machine learning approaches to solve medical problems. While they rarely mentioned the problem of imbalanced learning, it is commonly acknowledged that imbalanced datasets greatly affect the performance of classification algorithms. Therefore, this paper primarily discusses the problem of imbalanced datasets in DS screening. To this end, the SMOTE-Tomek and ADASYN methods were performed in this study. By reconstructing the original datasets or improving the sampling process, improved performance is achieved. The problem of overfitting is also taken into consideration.
In clinical practice, the DR of triple tests (involving AFP, uE3, total hCG, and free β-hCG) in the second trimester of pregnancy is 60%-70%, with a 5% FPR[17]. In recent years, many scholars have explored improving the DR using methods such as the sequential combined test[18,19], combined with NT, early pregnancy screening integrated screening[20], and increased marker screening (inhibin A, ductus venosus pulsatility index, nasal bone examination, serum placental growth factor, fetal nasal bone, prenasal thickness to nasal bone E length ratio)[21-24]. The DR of DS in these test strategies is about 80%-90%, with a 5% FPR[25]. Neocleous et al[26] reported an artificial intelligence method that ensures that most T21 cases are classified as high risk at any stage. The new method is highly effective at T21 identification and performs better than other existing statistical methods. Koivu et al[9] explored applying a machine learning algorithm to assess the risk of DS, and their best performing deep neural network model gave an area under the curve of 0.96. The results of this study showed that a machine learning algorithm can improve the DR of trisomy 21 and reduce the FPR, consistent with the reported artificial intelligence analysis.
Clinically, the risk cutoff value of serum DS screening is 1/270. However, it has been discussed that 1/270 may not always be the best choice[20]. The appropriate cutoff value of risk can increase the DR and reduce the FPR[27]. The second result of this study is a comparison of the DR and FPR from machine learning methods and statistical methods under different risk cutoff values of T21, as shown in Table 4. The results show that machine learning methods can obtain far lower FPRs than statistical methods at various T21 cutoff values. When the T21 cutoff values were set between 50 and 270, higher DRs were obtained using machine learning than statistical methods. As the selected T21 risk cutoff value increases, the DRs of the two protocols both tended to stabilize.
| Risk-cutoff value | Age | SVM | Statistical methods | ||
| FPR | DR | FPR | DR | ||
| 270 | Overall | 0.009369 | 0.9295 | 0.032 | 0.913 |
| 50 | Overall | 0.003081 | 0.913 | 0.007 | 0.82 |
| 150 | Overall | 0.007039 | 0.9268 | 0.019 | 0.885 |
| 250 | Overall | 0.008197 | 0.9178 | 0.03 | 0.91 |
| 500 | Overall | 0.01775 | 0.9266 | 0.053 | 0.937 |
| 750 | Overall | 0.02299 | 0.9319 | 0.072 | 0.95 |
| 1000 | Overall | 0.03321 | 0.9305 | 0.088 | 0.958 |
Considering that the number of DS affected cases in the original dataset of DS screening was much smaller than that of the DS non-affected cases, the SVM and CART algorithms achieved good results on the DS screening dataset. When the T21 risk cutoff value was set to 270, machine learning methods had a higher DR and a lower FPR than statistical methods. Future research will focus on increasing the classification performance of algorithms in this dataset without changing the original dataset distribution to obtain acceptable DR and FPR.
Down syndrome (DS) is one of the most common chromosomal aneuploidy diseases. Due to the limitations of DS screening technology, approximately 30% of DS cases could not be found. Therefore, the detection rate and false positive rate of these methods need to be improved.
Issues in recent years have included how to fully utilize clinical cumulative data to provide consultation reference and rational basis for patients and construction of statistical models for DS screening that are suitable for specific regions.
This study aimed to use intelligent algorithms in machine learning for modeling and analysis of prenatal DS screening.
This was a retrospective study of a clinical prenatal screening dataset. We designed and developed intelligent algorithms based on the synthetic minority over-sampling technique(SMOTE)-Tomek and adaptive synthetic sampling over-sampling techniques. The machine learning model was established and used for DS screening evaluation.
The dataset showed a large difference between the numbers of DS affected and non-affected cases. A combination of over-sampling and under-sampling techniques can greatly increase the performance of the algorithm at processing non-balanced datasets. As the number of iterations increases, the combination of the classification and regression tree algorithm and the SMOTE-Tomek over-sampling technique can obtain a high detection rate (DR) while keeping the false positive rate(FPR) to a minimum.
Intelligent algorithms achieved good results on the DS screening dataset. When the T21 risk cutoff value was set to 270, machine learning methods had a higher DR and a lower FPR than statistical methods.
The findings of this study suggest that the establishment and application of machine learning models will help to improve the detection rate of DS.
Manuscript source: Unsolicited manuscript
Specialty type: Medicine, research and experimental
Country/Territory of origin: China
Peer-review report’s scientific quality classification
Grade A (Excellent): 0
Grade B (Very good): B
Grade C (Good): 0
Grade D (Fair): 0
Grade E (Poor): 0
P-Reviewer: Lepage N S-Editor: Fan JR L-Editor: Webster JR P-Editor: Liu JH
| 1. | Pavlovic M, Berenji K, Bukurov M. Screening of celiac disease in Down syndrome - Old and new dilemmas. World J Clin Cases. 2017;5:264-269. [RCA] [PubMed] [DOI] [Full Text] [Full Text (PDF)] [Cited by in CrossRef: 26] [Cited by in RCA: 17] [Article Influence: 2.1] [Reference Citation Analysis (2)] |
| 2. | Arumugam A, Raja K, Venugopalan M, Chandrasekaran B, Kovanur Sampath K, Muthusamy H, Shanmugam N. Down syndrome-A narrative review with a focus on anatomical features. Clin Anat. 2016;29:568-577. [RCA] [PubMed] [DOI] [Full Text] [Cited by in Crossref: 35] [Cited by in RCA: 39] [Article Influence: 4.3] [Reference Citation Analysis (0)] |
| 3. | Lan RY, Chou CT, Wang PH, Chen RC, Hsiao CH. Trisomy 21 screening based on first and second trimester in a Taiwanese population. Taiwan J Obstet Gynecol. 2018;57:551-554. [RCA] [PubMed] [DOI] [Full Text] [Cited by in Crossref: 9] [Cited by in RCA: 11] [Article Influence: 1.6] [Reference Citation Analysis (0)] |
| 4. | Wilson G, Liitti P, Pölönen T, Sairanen M, Spencer K. A technical and clinical evaluation of a new assay for inhibin A and its use in second trimester Down syndrome screening. Clin Chem Lab Med. 2016;54:1473-1479. [RCA] [PubMed] [DOI] [Full Text] [Cited by in Crossref: 3] [Cited by in RCA: 3] [Article Influence: 0.4] [Reference Citation Analysis (0)] |
| 5. | Jiang T, Ding J, Zhang XQ, Zhang XJ, Zhang B, Wang T, Yu B. Analysis of Down syndrome failed to be diagnosed after prenatal screening: A multicenter study. Medicine (Baltimore). 2017;96:e7166. [RCA] [PubMed] [DOI] [Full Text] [Full Text (PDF)] [Cited by in Crossref: 4] [Cited by in RCA: 6] [Article Influence: 0.8] [Reference Citation Analysis (0)] |
| 6. | Pennings JL, Koster MP, Rodenburg W, Schielen PC, de Vries A. Discovery of novel serum biomarkers for prenatal Down syndrome screening by integrative data mining. PLoS One. 2009;4:e8010. [RCA] [PubMed] [DOI] [Full Text] [Full Text (PDF)] [Cited by in Crossref: 18] [Cited by in RCA: 19] [Article Influence: 1.2] [Reference Citation Analysis (0)] |
| 7. | Feng B, Samuels DC, Hoskins W, Guo Y, Meng Z. Down syndrome prediction/screening model based on deep learning and illumina genotyping array. IEEE International Conference on Bioinformatics and Biomedicine. IEEE. 2017;347-352. |
| 8. | Saraydemir S, Taşpınar N, Eroğul O, Kayserili H, Dinçkan N. Down syndrome diagnosis based on Gabor Wavelet Transform. J Med Syst. 2012;36:3205-3213. [RCA] [PubMed] [DOI] [Full Text] [Cited by in Crossref: 29] [Cited by in RCA: 21] [Article Influence: 1.5] [Reference Citation Analysis (0)] |
| 9. | Koivu A, Korpimäki T, Kivelä P, Pahikkala T, Sairanen M. Evaluation of machine learning algorithms for improved risk assessment for Down's syndrome. Comput Biol Med. 2018;98:1-7. [RCA] [PubMed] [DOI] [Full Text] [Cited by in Crossref: 14] [Cited by in RCA: 17] [Article Influence: 2.4] [Reference Citation Analysis (0)] |
| 10. | Furey TS, Cristianini N, Duffy N, Bednarski DW, Schummer M, Haussler D. Support vector machine classification and validation of cancer tissue samples using microarray expression data. Bioinformatics. 2000;16:906-914. [RCA] [PubMed] [DOI] [Full Text] [Cited by in Crossref: 1654] [Cited by in RCA: 1009] [Article Influence: 40.4] [Reference Citation Analysis (0)] |
| 11. | Loh WY. Classification and regression trees. Wiley Interdiscip Rev Data Min Knowl Discov. 2011;1:14-23. [RCA] [DOI] [Full Text] [Cited by in Crossref: 1001] [Cited by in RCA: 463] [Article Influence: 33.1] [Reference Citation Analysis (0)] |
| 12. | Batista GE, Prati RC, Monard MC. A study of the behavior of several methods for balancing machine learning training data. Acm SigkddExplorat Newslett. 2004;6:20-29. [RCA] [DOI] [Full Text] [Cited by in Crossref: 1876] [Cited by in RCA: 957] [Article Influence: 45.6] [Reference Citation Analysis (0)] |
| 13. | Cheng WC, Jhan DM. Triaxial accelerometer-based fall detection method using a self-constructing cascade-AdaBoost-SVM classifier. IEEE J Biomed Health Inform. 2013;17:411-419. [RCA] [PubMed] [DOI] [Full Text] [Cited by in Crossref: 81] [Cited by in RCA: 30] [Article Influence: 2.7] [Reference Citation Analysis (0)] |
| 14. | He H, Bai Y, Garcia EA, Li S. ADASYN: Adaptive synthetic sampling approach for imbalanced learning. IEEE. 2008;1322-1328. [DOI] [Full Text] |
| 15. | Neocleous AC, Nicolaides KH, Schizas CN. First Trimester Noninvasive Prenatal Diagnosis: A Computational Intelligence Approach. IEEE J Biomed Health Inform. 2016;20:1427-1438. [RCA] [PubMed] [DOI] [Full Text] [Cited by in Crossref: 16] [Cited by in RCA: 14] [Article Influence: 1.4] [Reference Citation Analysis (0)] |
| 16. | Kang Y, Dong X, Zhou Q, Zhang Y, Cheng Y, Hu R, Su C, Jin H, Liu X, Ma D, Tian W, Li X. Identification of novel candidate maternal serum protein markers for Down syndrome by integrated proteomic and bioinformatic analysis. Prenat Diagn. 2012;32:284-292. [RCA] [PubMed] [DOI] [Full Text] [Cited by in Crossref: 17] [Cited by in RCA: 19] [Article Influence: 1.5] [Reference Citation Analysis (0)] |
| 17. | Alldred SK, Deeks JJ, Guo B, Neilson JP, Alfirevic Z. Second trimester serum tests for Down's Syndrome screening. Cochrane Database Syst Rev. 2012;CD009925. [RCA] [PubMed] [DOI] [Full Text] [Full Text (PDF)] [Cited by in Crossref: 27] [Cited by in RCA: 34] [Article Influence: 2.6] [Reference Citation Analysis (0)] |
| 18. | Seyyed Kavoosi E, Younessi S, Farhud DD. Screening of Fetal Chromosome Aneuploidies in the First and Second Trimester of 125,170 Iranian Pregnant Women. Iran J Public Health. 2015;44:791-796. [PubMed] |
| 19. | Guanciali Franchi P, Palka C, Morizio E, Sabbatinelli G, Alfonsi M, Fantasia D, Sitar G, Benn P, Calabrese G. Sequential combined test, second trimester maternal serum markers, and circulating fetal cells to select women for invasive prenatal diagnosis. PLoS One. 2017;12:e0189235. [RCA] [PubMed] [DOI] [Full Text] [Full Text (PDF)] [Cited by in Crossref: 9] [Cited by in RCA: 9] [Article Influence: 1.1] [Reference Citation Analysis (0)] |
| 20. | Yan J, Ayer T, Keskinocak P, Caughey AB. Preference-sensitive risk-cutoff values for prenatal-integrated screening test for Down syndrome. Prenat Diagn. 2015;35:645-651. [RCA] [PubMed] [DOI] [Full Text] [Cited by in Crossref: 5] [Cited by in RCA: 5] [Article Influence: 0.5] [Reference Citation Analysis (0)] |
| 21. | Wald NJ, Bestwick JP, Huttly WJ. Improvements in antenatal screening for Down's syndrome. J Med Screen. 2013;20:7-14. [RCA] [PubMed] [DOI] [Full Text] [Full Text (PDF)] [Cited by in Crossref: 17] [Cited by in RCA: 19] [Article Influence: 1.6] [Reference Citation Analysis (0)] |
| 22. | Fries N, Salomon LJ, Muller F, Dreux S, Houfflin-Debarge V, Coquel P, Kleinfinger P, Dommergues M; BioNuQual User Club; Paris. Impact of a shift in nuchal translucency measurements on the detection rate of first-trimester Down syndrome screening: A population-based study. Prenat Diagn. 2018;38:106-109. [RCA] [PubMed] [DOI] [Full Text] [Cited by in Crossref: 7] [Cited by in RCA: 7] [Article Influence: 1.0] [Reference Citation Analysis (0)] |
| 23. | Papasozomenou P, Athanasiadis AP, Zafrakas M, Panteris E, Mikos T, Daniilidis A, Loufopoulos A, Assimakopoulos E, Tarlatzis BC. Screening performance of different methods defining fetal nasal bone hypoplasia as a single and combined marker for the detection of trisomy 21 in the second trimester. J Matern Fetal Neonatal Med. 2016;29:3368-3373. [RCA] [PubMed] [DOI] [Full Text] [Cited by in Crossref: 2] [Cited by in RCA: 2] [Article Influence: 0.2] [Reference Citation Analysis (0)] |
| 24. | Tournemire A, Groussolles M, Ehlinger V, Lusque A, Morin M, Benevent JB, Arnaud C, Vayssière C. Prenasal thickness to nasal bone length ratio: effectiveness as a second or third trimester marker for Down syndrome. Eur J Obstet Gynecol Reprod Biol. 2015;191:28-32. [RCA] [PubMed] [DOI] [Full Text] [Cited by in Crossref: 10] [Cited by in RCA: 6] [Article Influence: 0.6] [Reference Citation Analysis (0)] |
| 25. | Alldred SK, Takwoingi Y, Guo B, Pennant M, Deeks JJ, Neilson JP, Alfirevic Z. First and second trimester serum tests with and without first trimester ultrasound tests for Down's syndrome screening. Cochrane Database Syst Rev. 2017;3:CD012599. [RCA] [PubMed] [DOI] [Full Text] [Cited by in Crossref: 10] [Cited by in RCA: 23] [Article Influence: 2.9] [Reference Citation Analysis (0)] |
| 26. | Neocleous AC, Syngelaki A, Nicolaides KH, Schizas CN. Two-stage approach for risk estimation of fetal trisomy 21 and other aneuploidies using computational intelligence systems. Ultrasound Obstet Gynecol. 2018;51:503-508. [PubMed] [DOI] [Full Text] |
| 27. | Zhou Y, Du Y, Zhang B, Wang L. Integrating multiple of the median values of serological markers with the risk cut-off value in Down syndrome screening. Biosci Trends. 2018;12:613-619. [RCA] [PubMed] [DOI] [Full Text] [Cited by in Crossref: 4] [Cited by in RCA: 6] [Article Influence: 1.0] [Reference Citation Analysis (0)] |