Copyright
©The Author(s) 2020.
World J Clin Cases. Nov 6, 2020; 8(21): 5439-5445
Published online Nov 6, 2020. doi: 10.12998/wjcc.v8.i21.5439
Published online Nov 6, 2020. doi: 10.12998/wjcc.v8.i21.5439
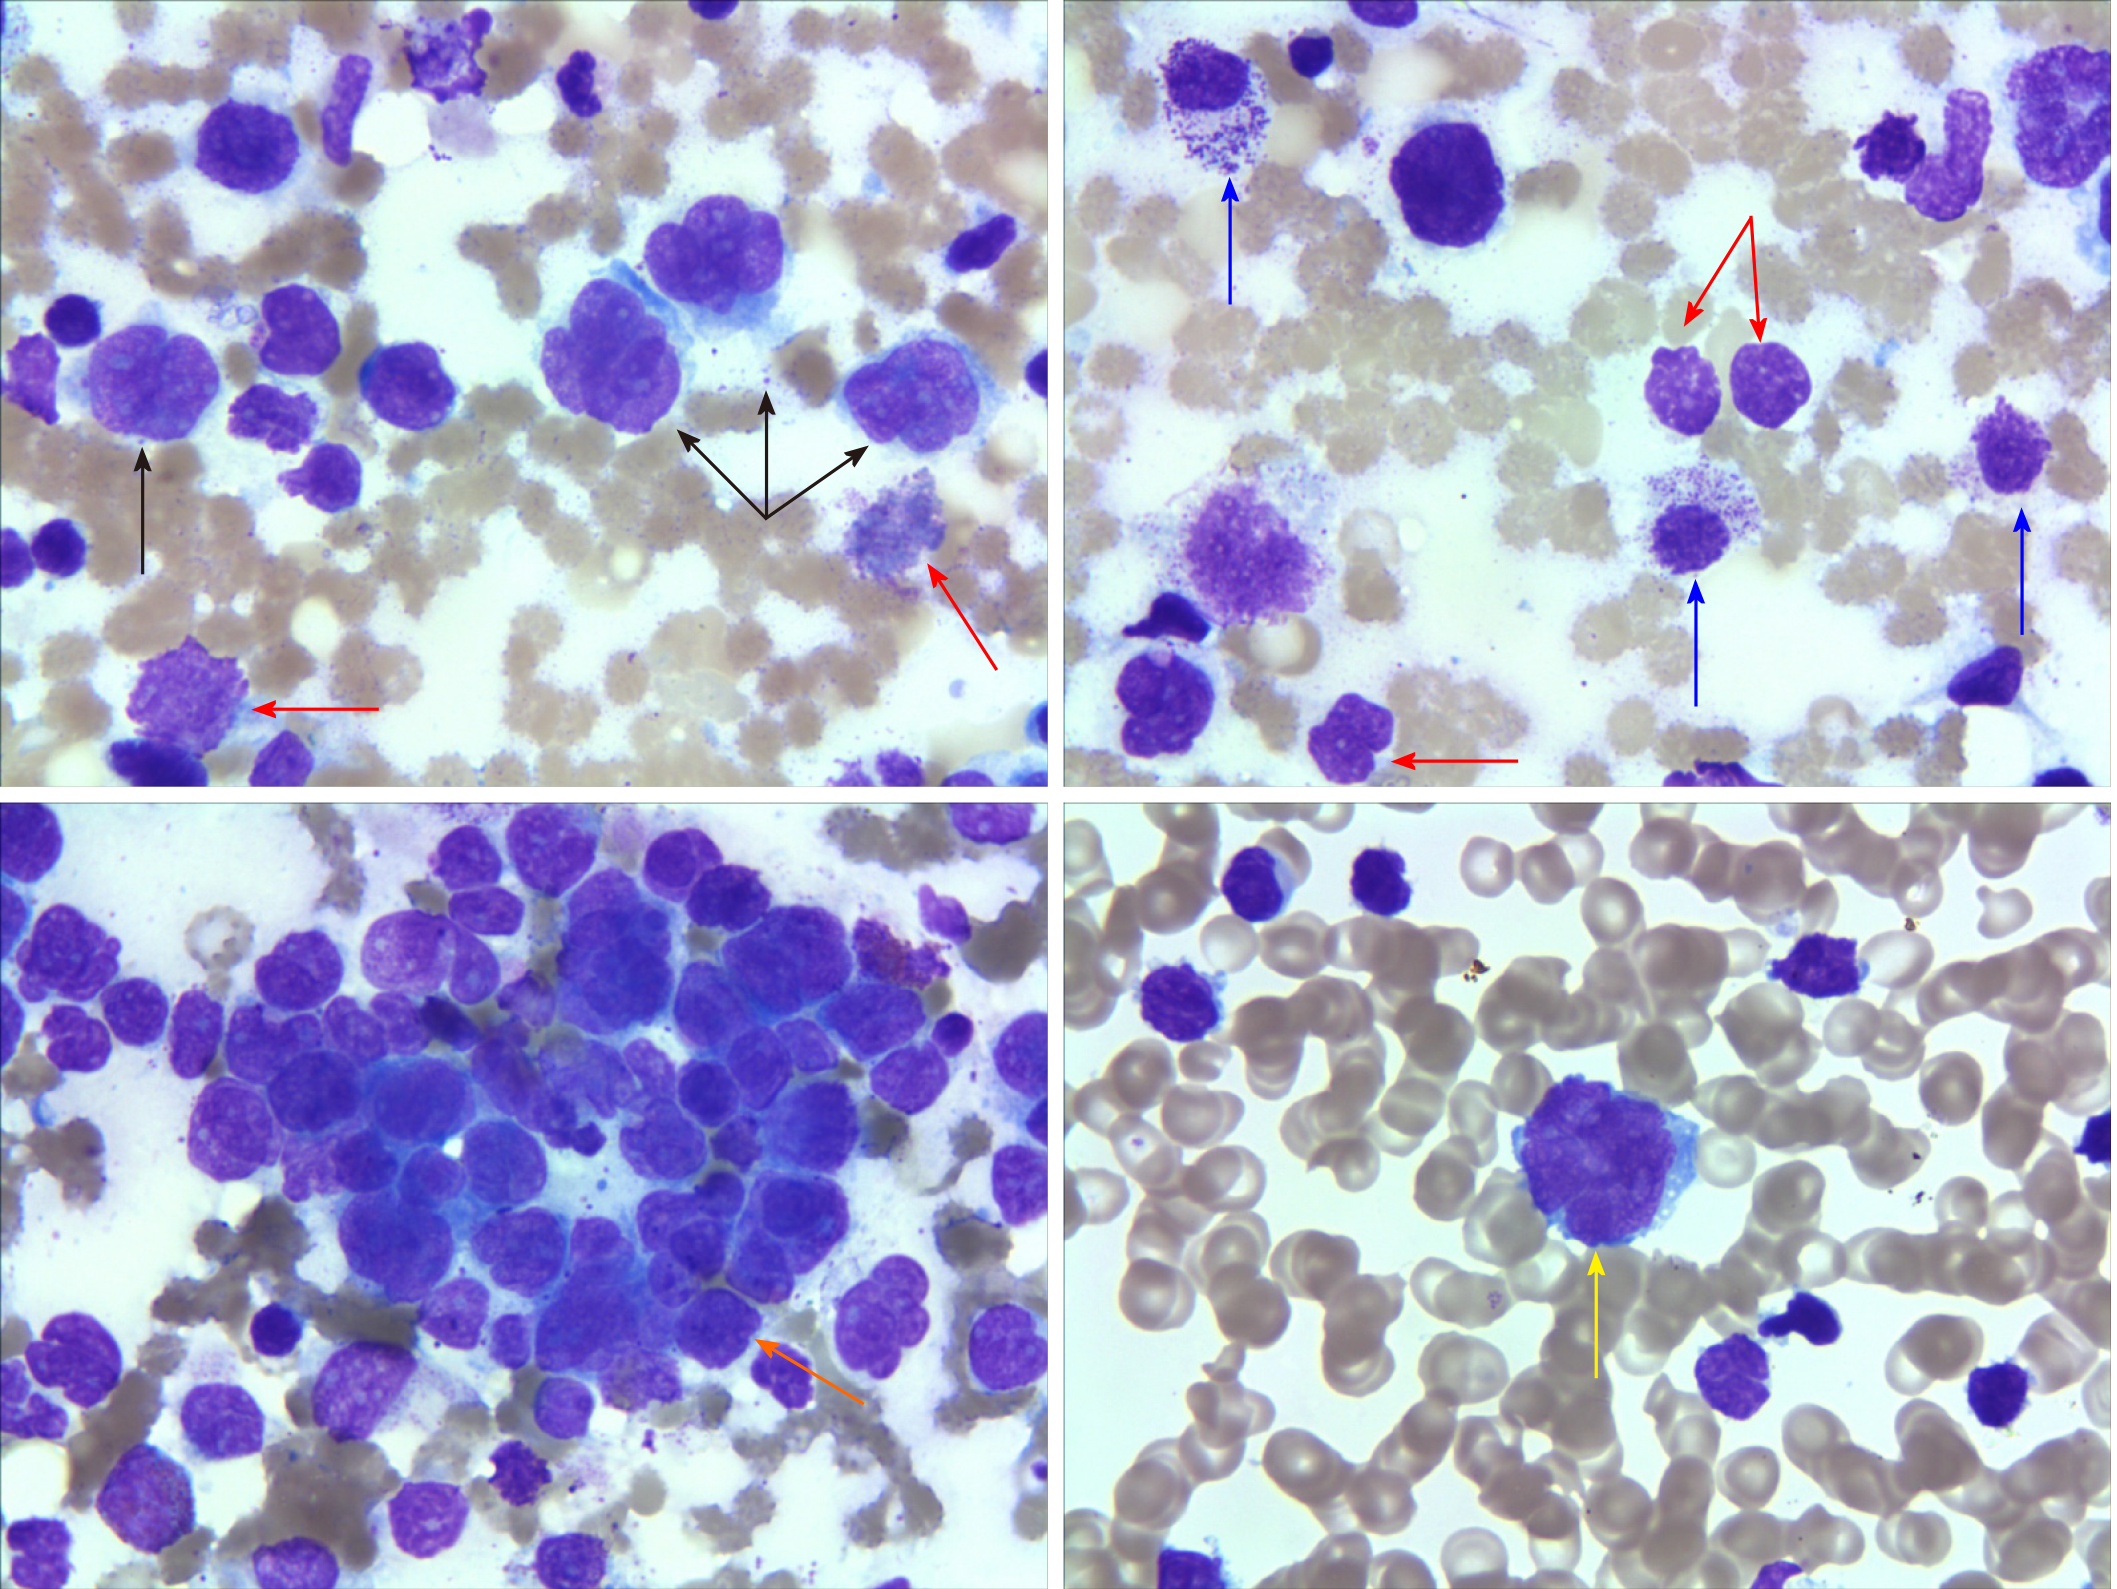
Figure 2 Bone marrow and peripheral blood smear results.
In a bone marrow smear, the size of the lymphoma cells varied (black arrows). The cells aggregated and inlaid with each other (orange arrow). Damaged cells with varied size were observed (red arrows). The structures of some granulocytes were unclear (blue arrows). In peripheral blood smears, lymphoma cells accounted for 84% (yellow arrow) (Wright-Giemsa, × 1000).
- Citation: Zhang HF, Guo Y. Acute leukemic phase of anaplastic lymphoma kinase-anaplastic large cell lymphoma: A case report and review of the literature. World J Clin Cases 2020; 8(21): 5439-5445
- URL: https://www.wjgnet.com/2307-8960/full/v8/i21/5439.htm
- DOI: https://dx.doi.org/10.12998/wjcc.v8.i21.5439


