Published online Oct 26, 2024. doi: 10.12998/wjcc.v12.i30.6391
Revised: July 3, 2024
Accepted: August 22, 2024
Published online: October 26, 2024
Processing time: 119 Days and 13 Hours
The identification of specific gene expression patterns is crucial for understanding the mechanisms underlying primary biliary cholangitis (PBC) and finding rele
To determine PBC-associated hub genes and assess their clinical utility for disease prediction.
PBC expression data were obtained from the Gene Expression Omnibus database. Overlapping genes from differential expression analysis and weighted gene co-expression network analysis (WGCNA) were identified as key genes for PBC. Kyoto Encyclopedia of Genes and Genomes and Gene Ontology analyses were performed to explore the potential roles of key genes. Hub genes were identified in protein-protein interaction (PPI) networks using the Degree algorithm in Cytoscape software. The relationship between hub genes and immune cells was investigated. Finally, a Mendelian randomization study was conducted to deter
We identified 71 overlapping key genes using differential expression analysis and WGCNA. These genes were primarily enriched in pathways related to cytokine-cytokine receptor interaction, and Th1, Th2, and Th17 cell differentiation. We utilized Cytoscape software and identified five hub genes (CD247, IL10, CCL5, CCL3, and STAT3) in PPI networks. These hub genes showed a strong correlation with immune cell infiltration in PBC. However, inverse variance weighting analysis did not indicate the causal effects of hub genes on PBC risk.
Hub genes can potentially serve as valuable biomarkers for PBC prediction and treatment, thereby offering significant clinical utility.
Core Tip: This study identified five hub genes (CD247, IL10, CCL5, CCL3, and STAT3) associated with primary biliary cholangitis (PBC) through comprehensive bioinformatics analysis. These hub genes were enriched in immune-related pathways and strongly correlated with immune cell infiltration in PBC. Although hub genes did not have a causal effect on PBC risk, they provided valuable insights into the molecular mechanisms of PBC and showed potential as biomarkers for PBC prediction and treatment.
- Citation: Yang YC, Ma X, Zhou C, Xu N, Ding D, Ma ZZ, Zhou L, Cui PY. Functional investigation and two-sample Mendelian randomization study of primary biliary cholangitis hub genes. World J Clin Cases 2024; 12(30): 6391-6406
- URL: https://www.wjgnet.com/2307-8960/full/v12/i30/6391.htm
- DOI: https://dx.doi.org/10.12998/wjcc.v12.i30.6391
Primary biliary cholangitis (PBC) is a chronic autoimmune liver disease distinguished by the gradual destruction of small bile ducts within the liver, leading to impaired bile flow, toxic bile acid accumulation, and liver damage[1,2]. Several challenges are associated with the medical management of PBC. Diagnosing PBC can be challenging, as early-stage disease may be asymptomatic or occur with nonspecific symptoms, resulting in delayed diagnosis and treatment ini
A crucial aspect in unraveling the intricate microscopic mechanisms underlying a wide range of disorders, particularly PBC, lies in the precise characterization of specific gene expression patterns. This process is vital for identifying crucial biomarkers that facilitate diagnostic accuracy and therapeutic evaluation[5]. Sophisticated bioinformatics techniques, including weighted gene co-expression network analysis (WGCNA), Gene Ontology (GO) annotations, Kyoto Encyclopedia of Genes and Genomes (KEGG) pathway enrichment, and gene set enrichment analysis have been tailored to decipher complex disease pathways. WGCNA serves as a valuable tool for precisely identifying therapeutic targets and potential biomarkers[6,7]. Hence, the core purpose of this investigation is to elucidate novel genetic entities, biomarkers, and the fundamental mechanisms underlying PBC.
In recent years, Mendelian randomization (MR) has been firmly established as a potent tool for investigating potential causal relationships. MR uses single nucleotide polymorphisms (SNPs) as instrumental variables (IVs) to leverage the natural randomization of genetic variants and evaluate the causal effects of exposure factors on outcomes[8]. This methodology boasts numerous advantages, including the ability to produce robust causal inferences, effectively con
In this study, we analyzed liver tissue samples from patients diagnosed with PBC and compared them to samples from healthy controls (HCs). Our primary objective was to identify genes exhibiting differential expression patterns and examine their relationship with PBC. Using WGCNA, we identified the most relevant PBC-associated gene modules, enabling us to select genes for further investigation. Next, we identified five key genes-CD247, IL10, CCL5, CCL3, and STAT3-as promising diagnostic biomarkers for PBC from the protein-protein interaction (PPI) network. These genes could significantly improve diagnostic capabilities and elucidate the mechanisms underlying PBC. Additionally, we conducted MR analyses to investigate potential causal relationships between these five hub genes and PBC.
The GSE79850 dataset was accessed and downloaded from the Gene Expression Omnibus (GEO) database. These datasets consisted of clinical features and gene expression data obtained from liver tissue samples of individuals diagnosed with PBC and HC. GSE79850 was comprised of 8 HC samples and 16 PBC patient samples. This dataset was generated through transcriptome microarray analysis of liver tissues obtained from individuals with PBC and HCs.
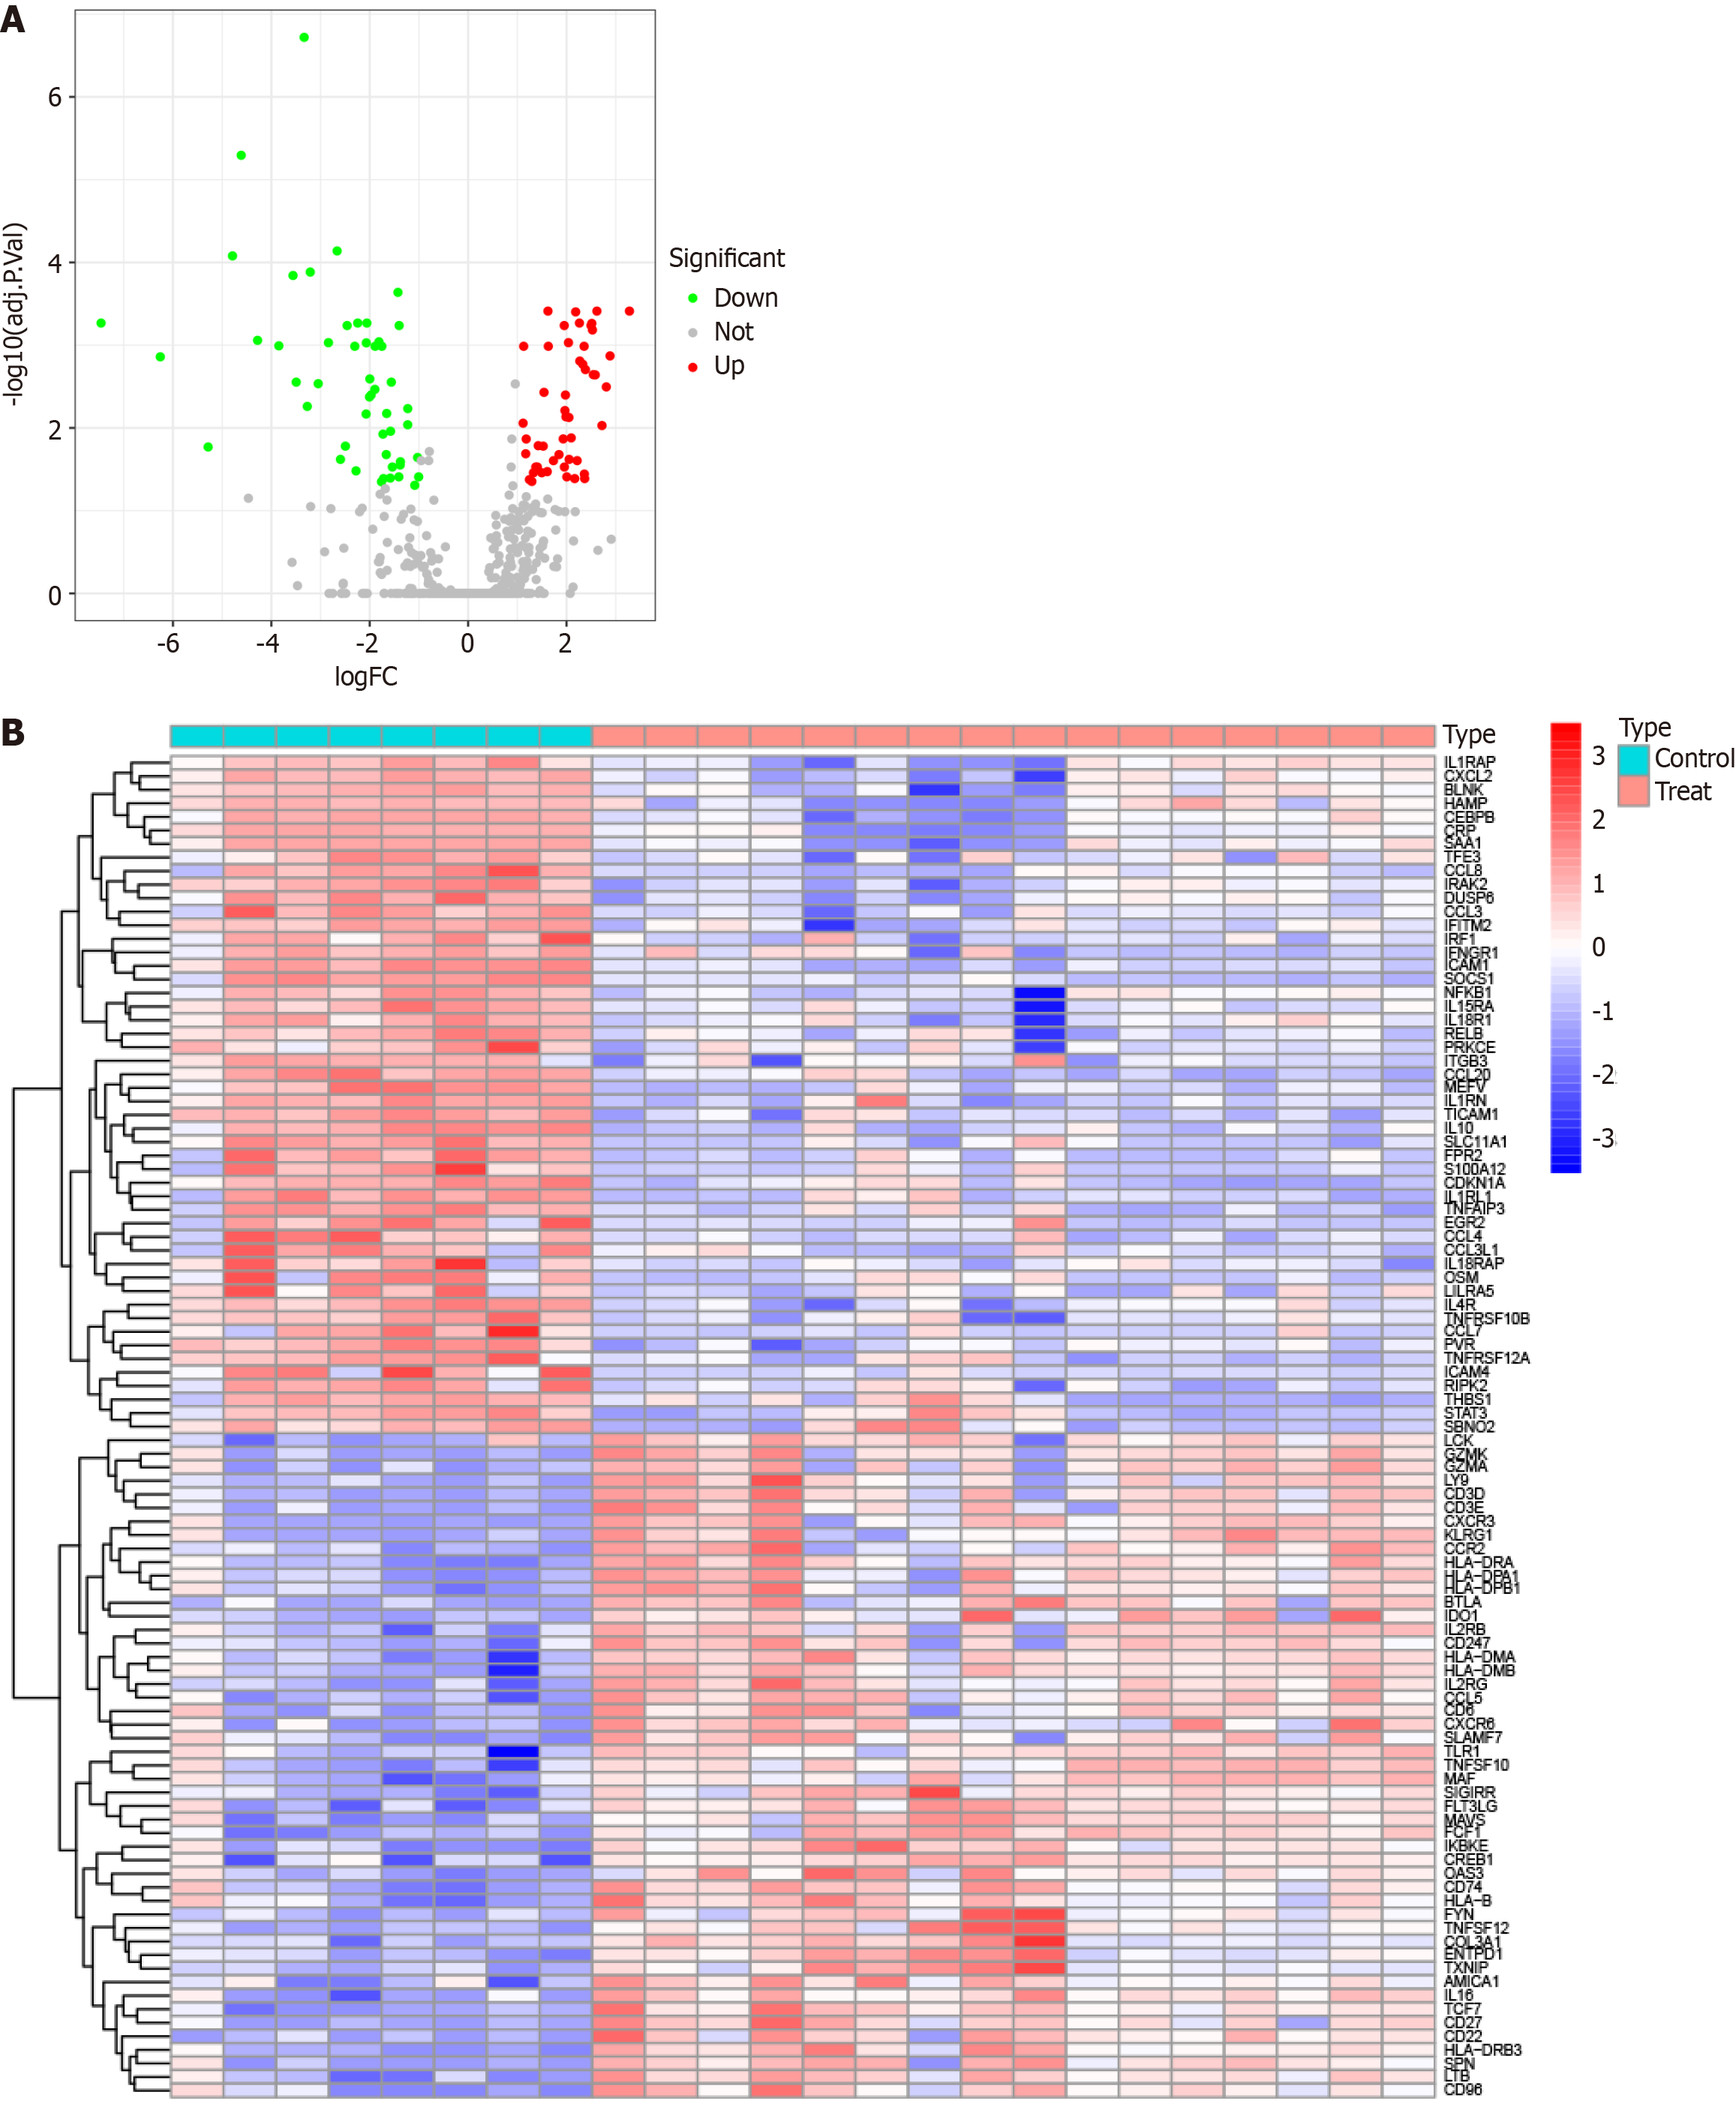
Initially, we utilized R software (version 4.3.0) to read data from the GSE79850 dataset and performed preprocessing steps, including normalization. Subsequently, we conducted differentially expressed gene (DEG) analyses using the “limma” package, to identify genes with significant differences between the PBC and HC groups. For testing multiple corrections, we adopted the Benjamini-Hochberg method, a widely accepted approach for controlling the false discovery rate. The Benjamini-Hochberg method adjusts the raw P values to account for the increased likelihood of false positives while simultaneously performing many statistical tests. Specifically, we defined a gene as being differentially expressed if it exhibited a |logFC| ≥ 1 and an adjusted P value ≤ 0.05. After assessing the significance of expression levels, volcano plots, and DEG expression heatmaps were generated using the R packages “ggplot2” and "pheatmap", respectively.
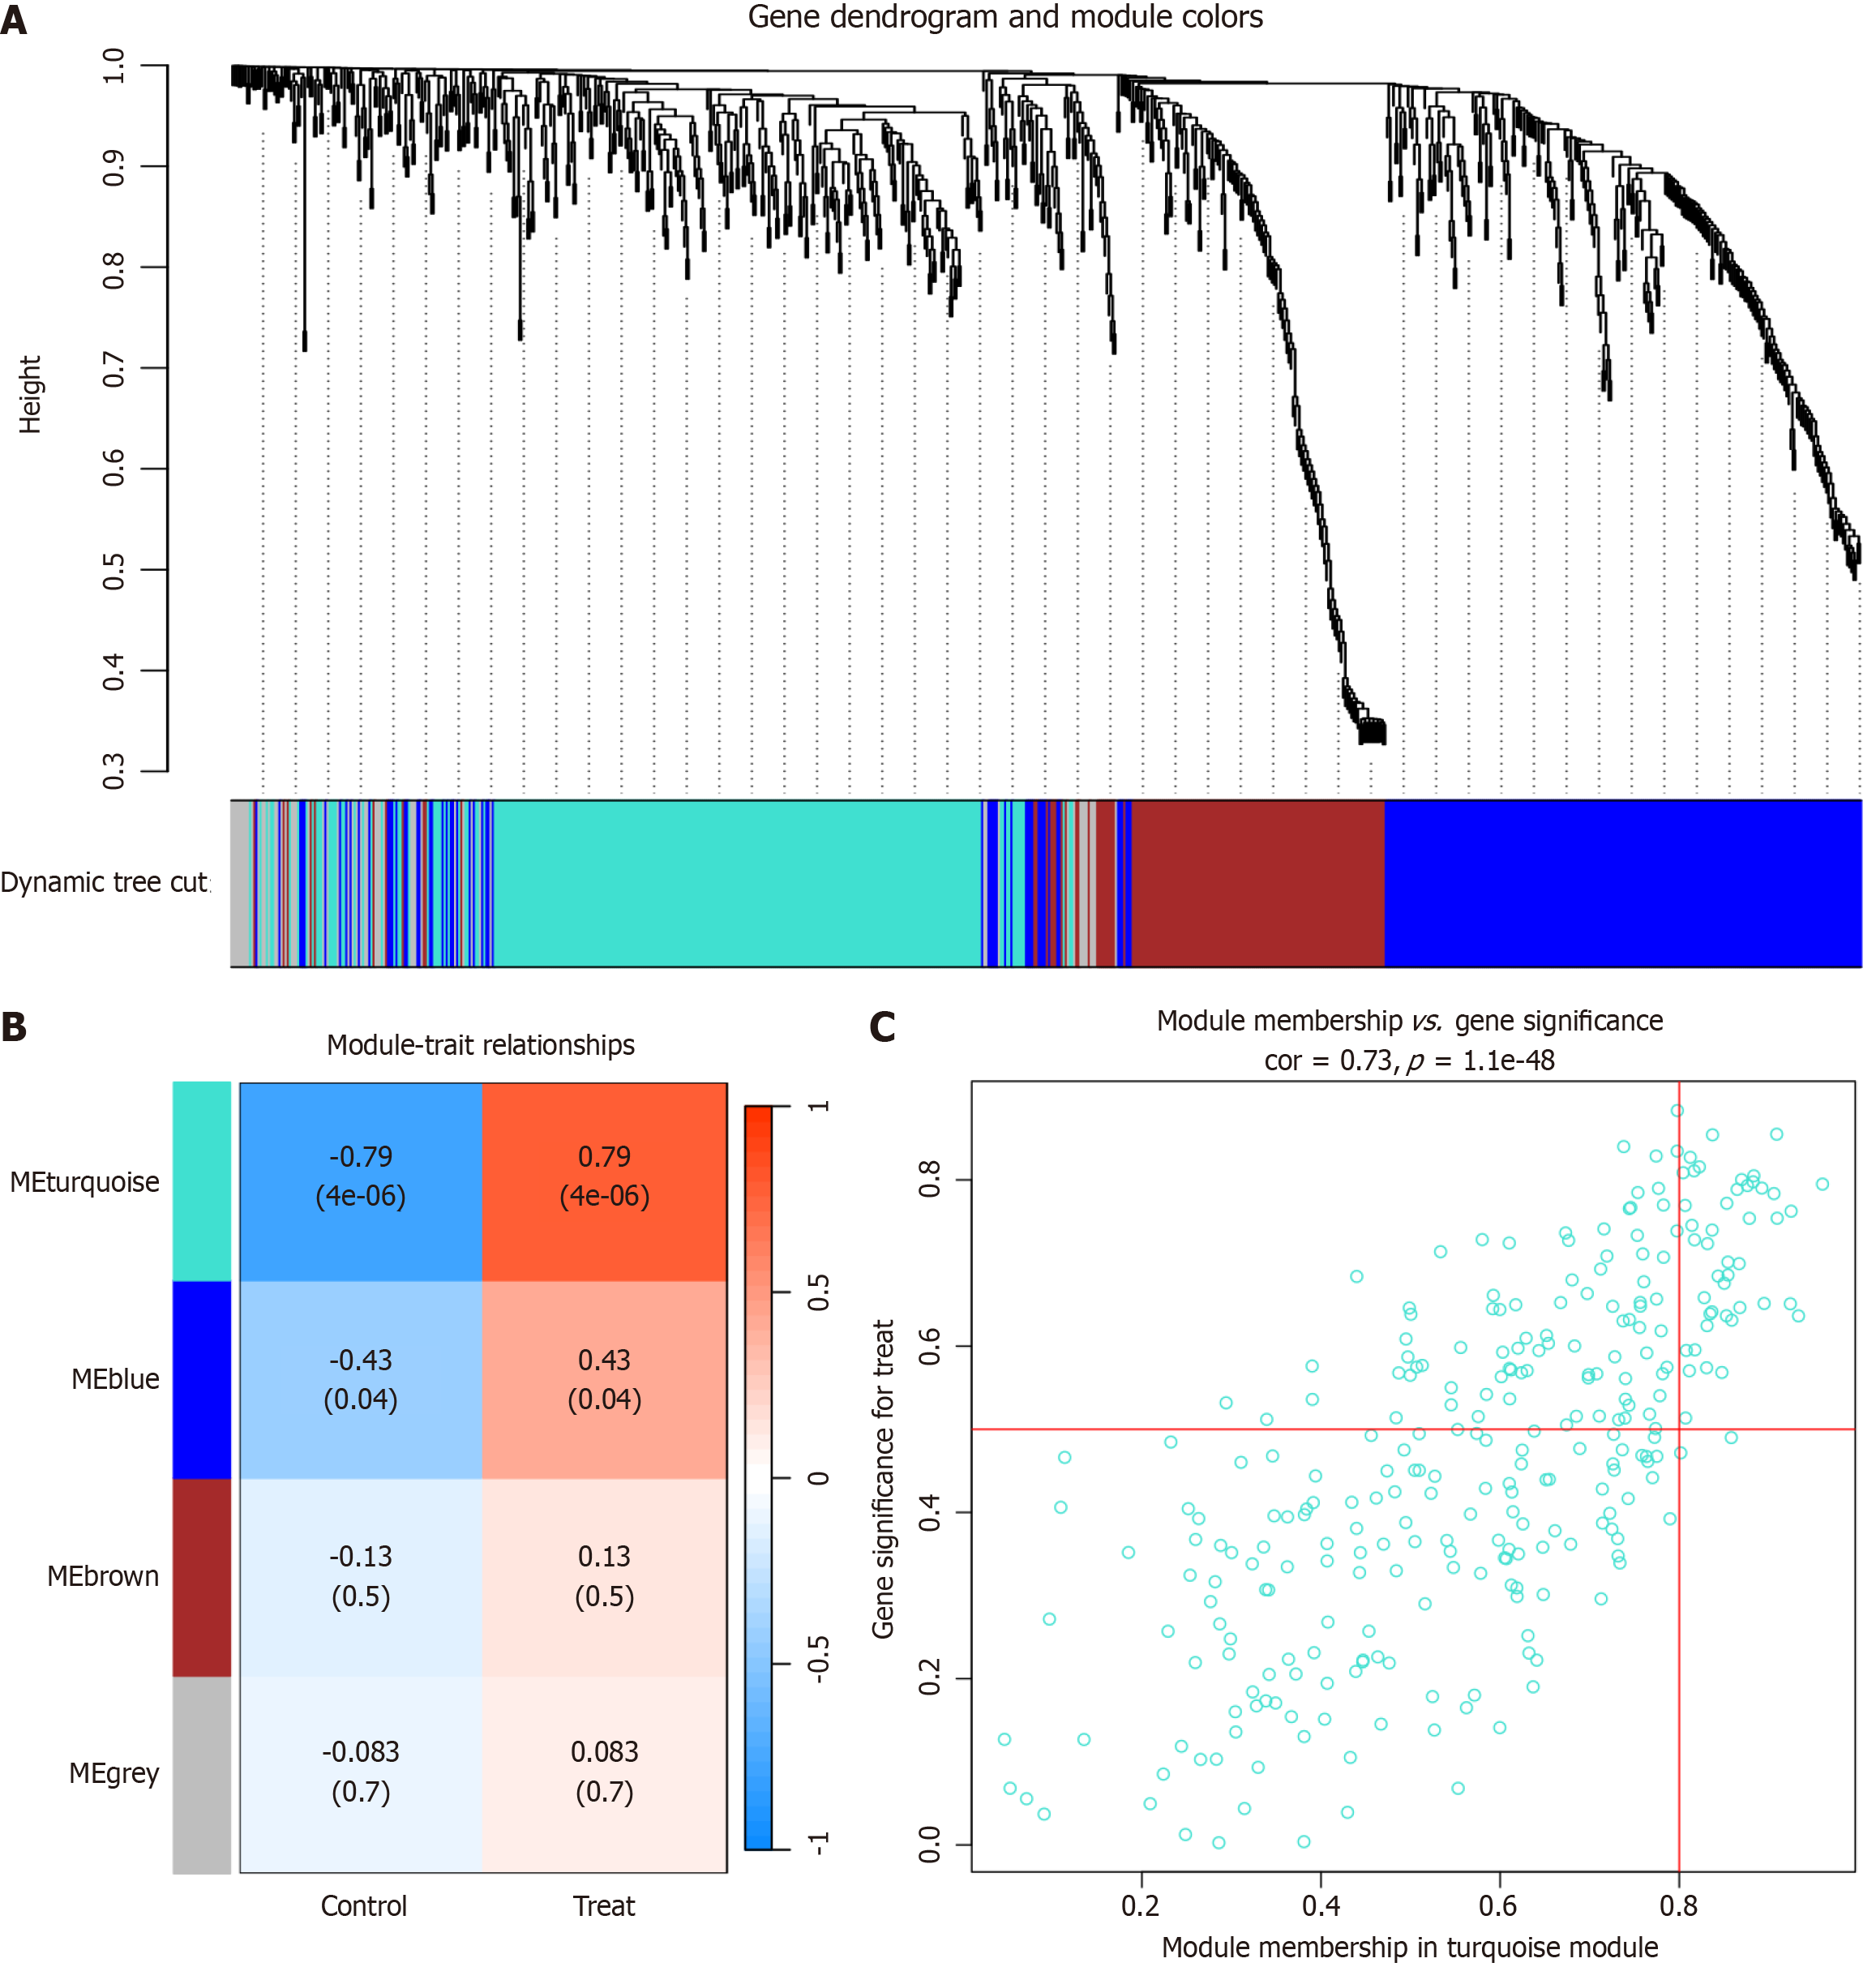
WGCNA is a systematic biological approach commonly used to characterize genetic association patterns across samples, aiming to identify highly interconnected gene modules and their relationship with phenotypes. It has been successfully used to identify candidate markers. In our study, we utilized the “WGCNA” R package to construct a gene co-expression network specific to PBC[6]. Subsequently, we assessed the correlation between different modules and the pathogenic mechanism of PBC, ultimately selecting the most relevant module as central genes derived from WGCNA.
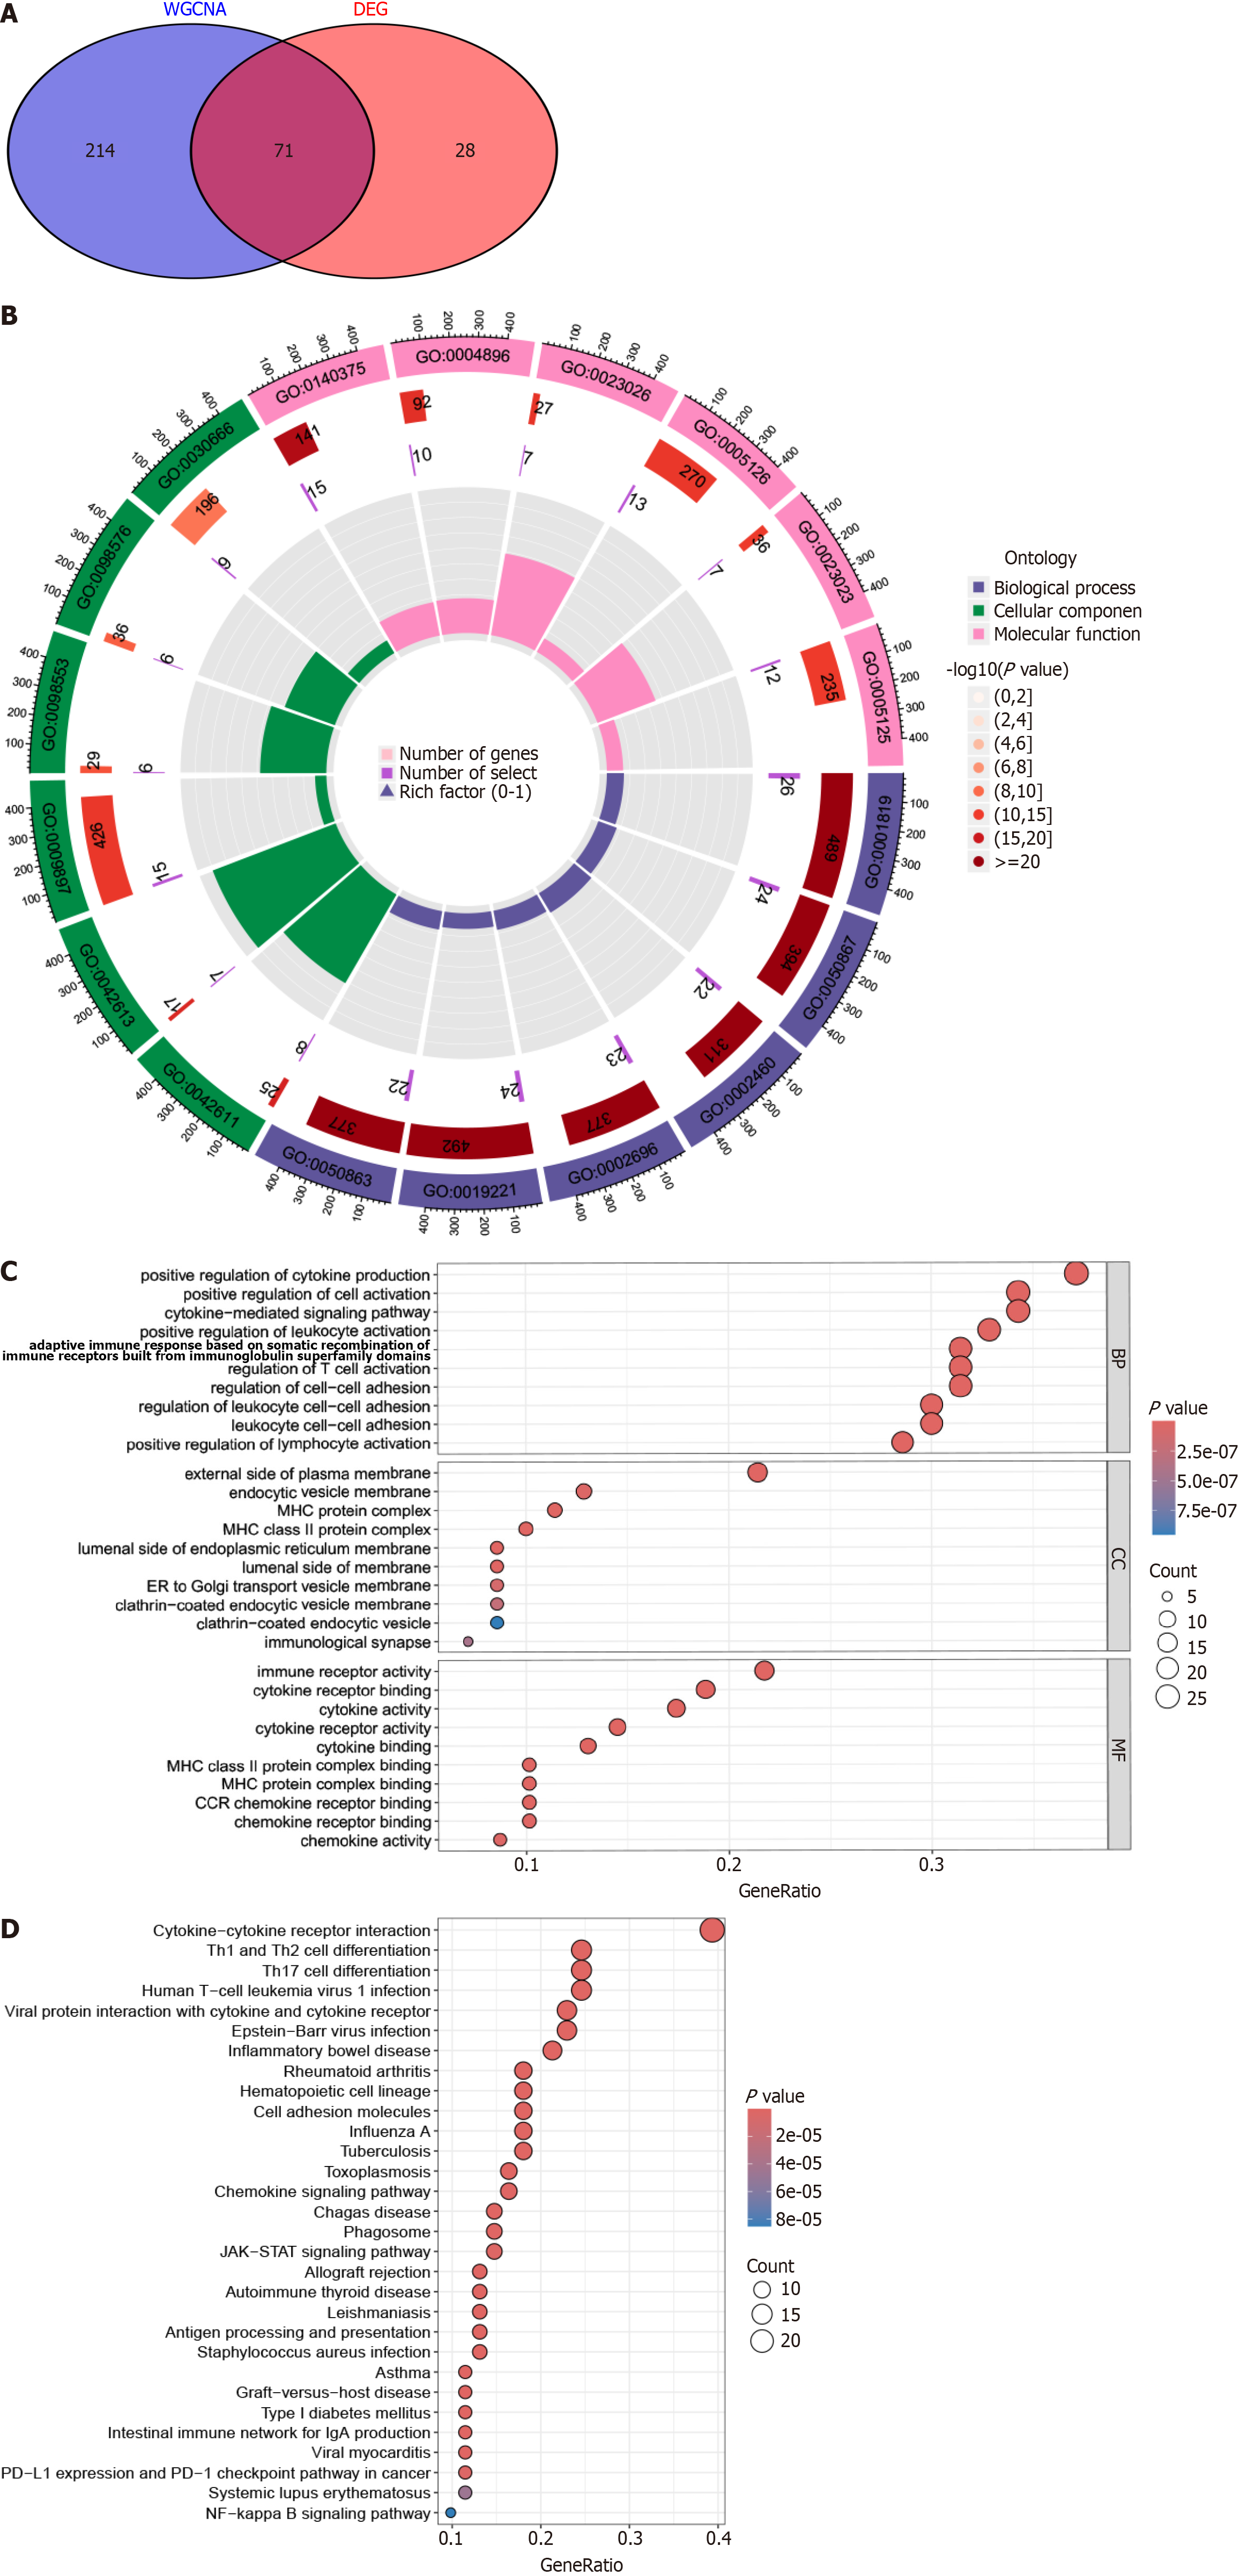
The overlapping genes from DEG analysis and WGCNA were identified as key genes in PBC pathogenesis. Subsequently, we conducted GO and KEGG enrichment analysis using the “clusterProfiler” R package to elucidate the mechanisms underlying disease progression and pathogenesis in PBC[10].
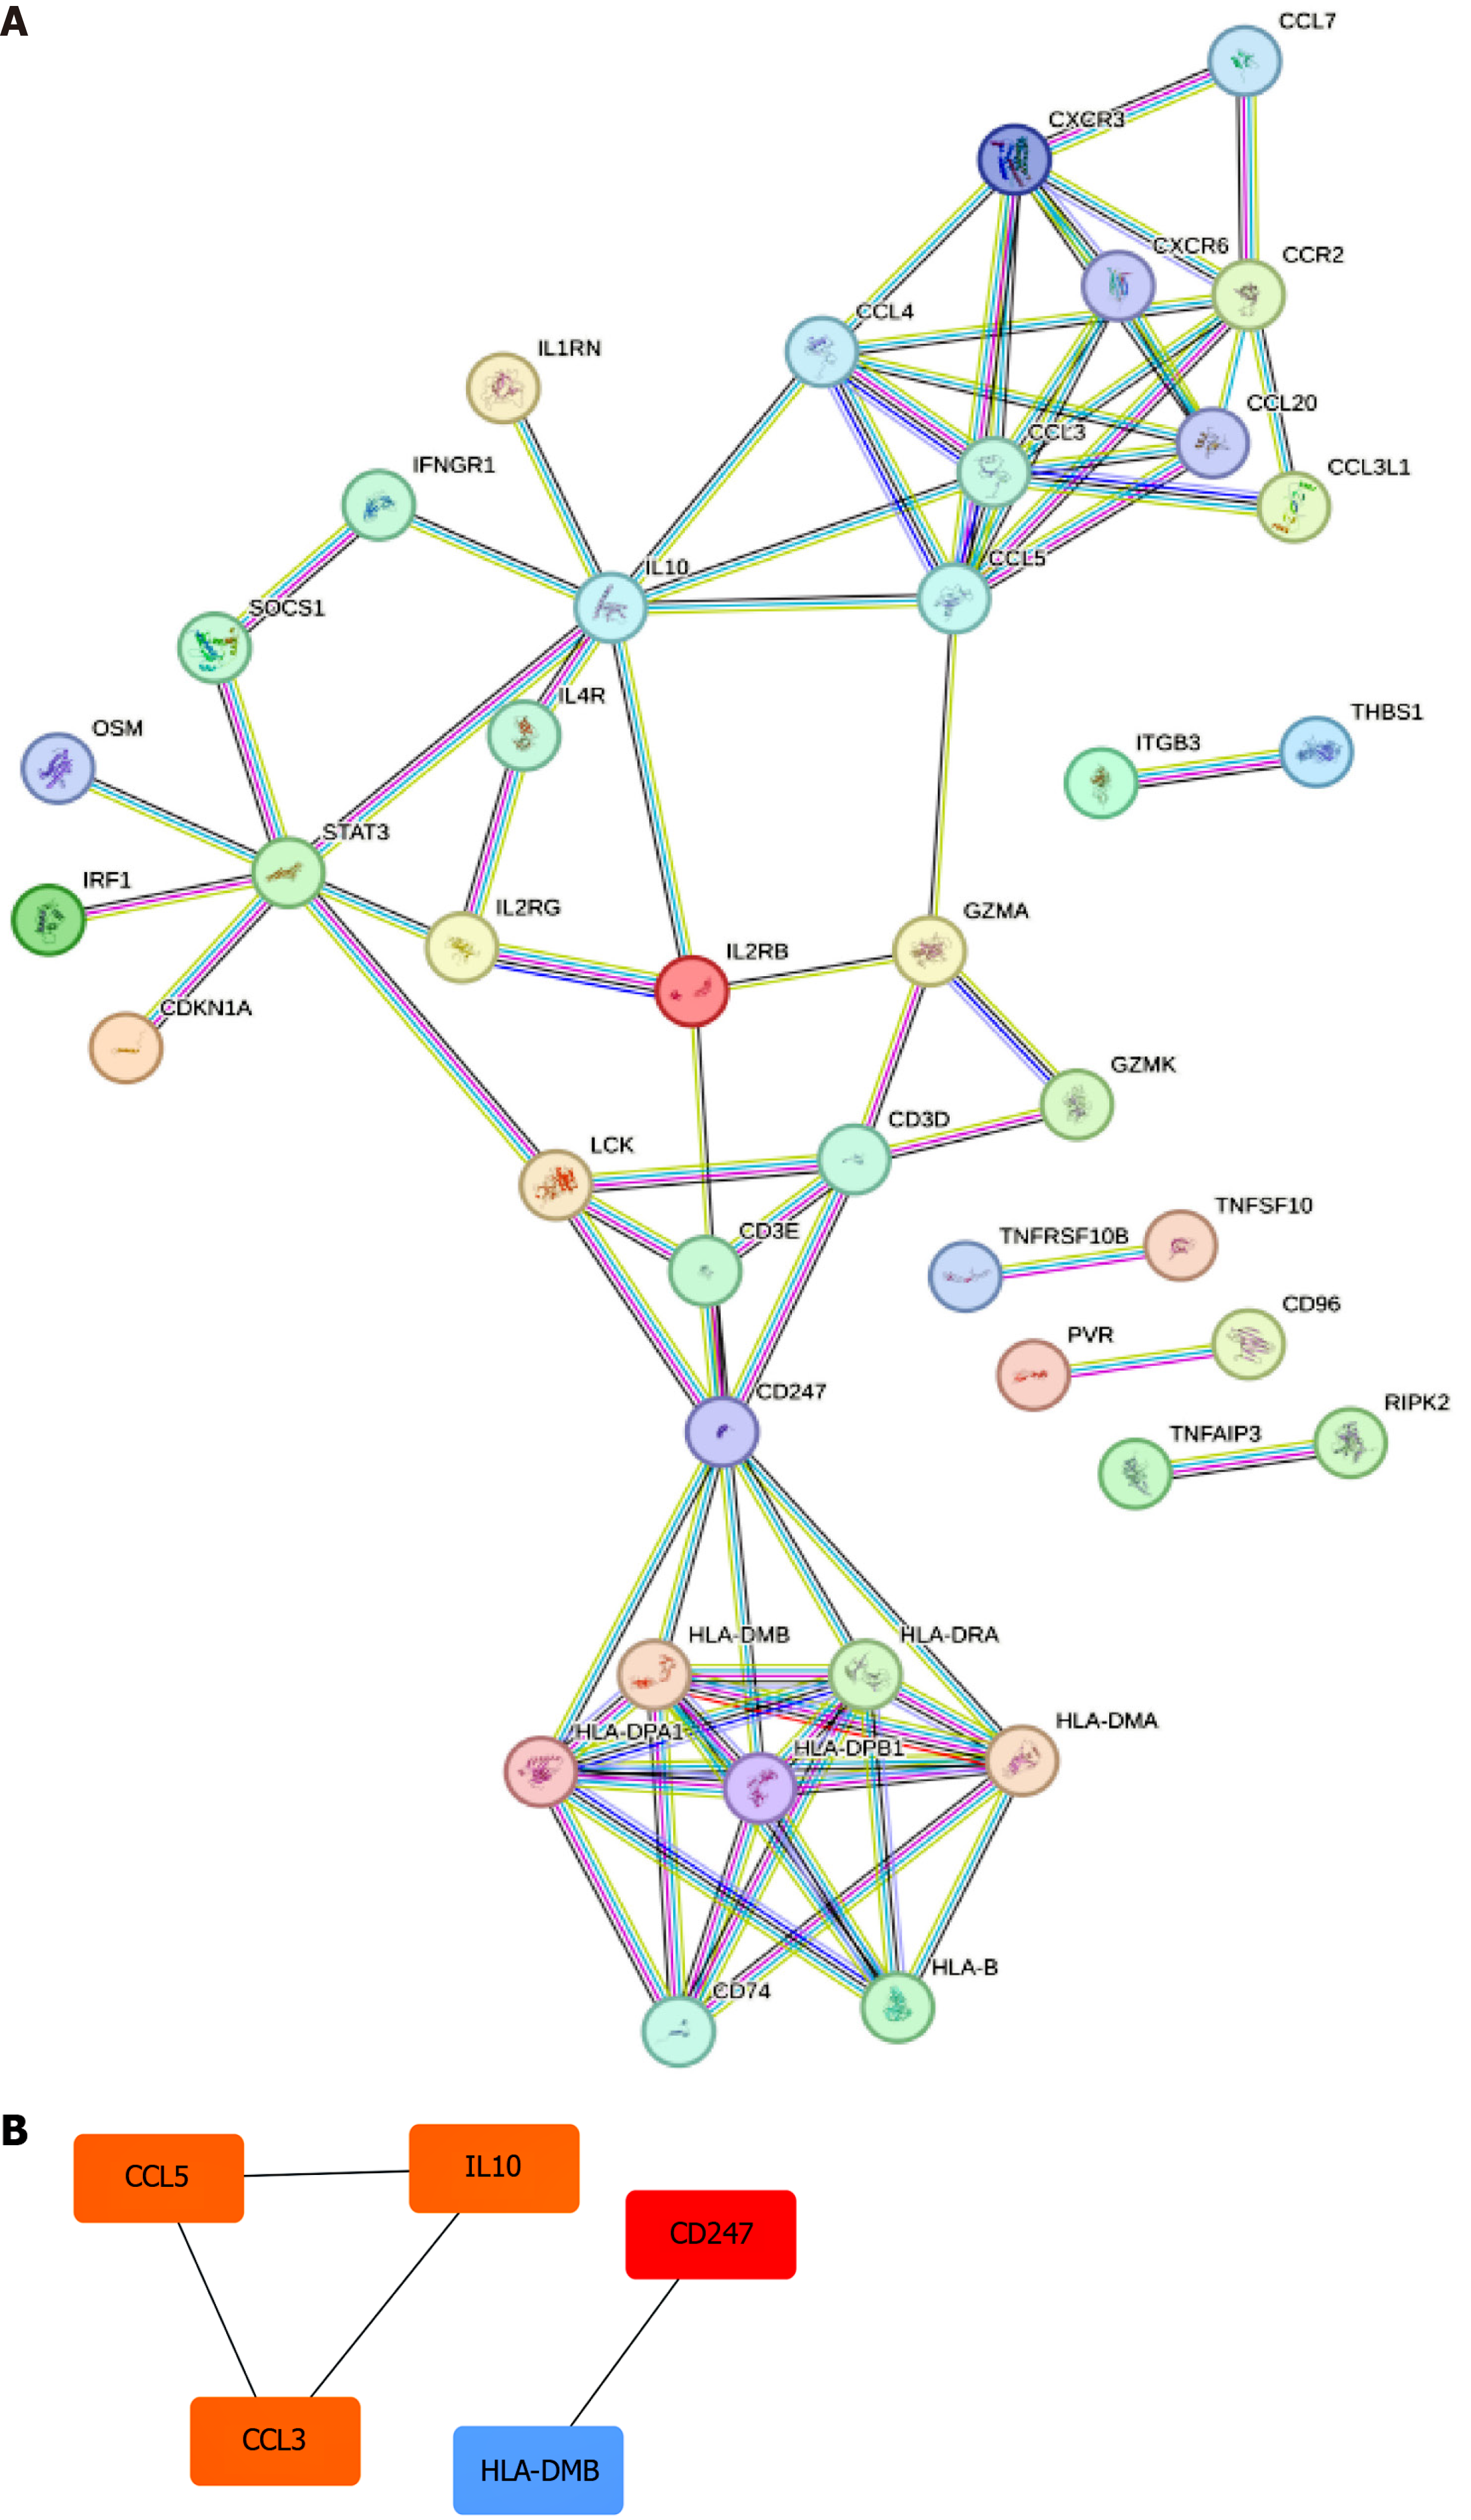
To explore the PPI networks and gene interactions relevant to PBC, we utilized the STRING database. The Degree algorithm in Cytoscape software facilitated the evaluation and ranking of the importance of genes within these networks. In a PPI network, the degree value reflects the number of interactions a gene has with other genes in the network, thus serving as an indicator of its significance within the network. This approach allowed us to identify hub genes critical to the gene interactions associated with the disease.
To construct a nomogram model for predicting the PBC risk, we utilized the “rms” package[11]. The predictive power of the nomogram model was evaluated using Harrell’s concordance index. We employed the “ROC” package to construct a receiver operator characteristic (ROC) curve and assess the diagnostic efficacy of candidate biomarkers. The accuracy of the model was determined by calculating the area under the ROC curve (AUC), with 0.9 ≤ AUC < 1 indicating excellent accuracy.
In order to investigate the role of immune cells in PBC, we conducted a CIBERSORT analysis to compare the immune cell infiltration levels of 22 immune cell types between the PBC and HC groups[12]. Furthermore, we evaluated the effect of hub genes on immune cell infiltration in PBC by comparing hub gene expression and immune cell infiltration levels.
All data in this study were obtained from publicly available databases. Two-sample MR was employed to investigate potential causal associations between hub genes and PBC risk, using SNPs as IVs. SNPs associated with PBC were identified using a significance threshold of P < 1e-5, and a linkage disequilibrium cutoff of r2 < 0.1 within 10000 bp was applied to each SNP to ensure independence. Data for hub genes were obtained from publicly accessible GWAS data sources. Data for IL10, CCL5, CCL3, and STAT3 were available. SNPs were harmonized to ensure consistent alleles before conducting a two-sample MR analysis. MR analysis was performed using the “TwoSampleMR” package, and the inverse variance weighted (IVW) method was utilized to assess the relationship between the hub gene levels and PBC risk. Additionally, MR-Egger was employed for sensitivity analysis[13].
To conduct our analysis, we retrieved the PBC dataset (GSE79850) from the GEO database and subsequently conducted a rigorous screening process to identify DEGs specific to the PBC dataset. Our detailed investigation revealed a total of 99 DEGs, segmented into 49 genes displaying increased expression and 50 genes showing decreased expression in the PBC group, as compared to the HC group (Figure 1).
To gain insight into the potential genetic modules underlying PBC, we utilized WGCNA, employing candidate genes derived from the PBC-related dataset (GSE79850), as illustrated in Figure 2A. Using this method, we successfully categorized the genes into four distinct modules (Figure 2B). Furthermore, we evaluated positive correlation coefficients and identified the "turquoise" module as the most relevant in the context of the GSE89632 dataset (Figure 2C). This specific module shows considerable potential for elucidating its pivotal role in PBC onset and progression.
We performed a comprehensive analysis and identified 71 overlapping genes from the WGCNA analysis and DEGs as key genes that may significantly affect PBC development and progression (Figure 3A). We utilized both GO and KEGG frameworks to gain a deeper insight into the functional roles of these 71 overlapping genes. GO enrichment analysis revealed their primary functions in biological processes, encompassing the positive regulation of cytokine production, cell activation, cytokine-mediated signaling pathways, and augmentation of leukocyte activation, as depicted in Figure 3B and C. KEGG analysis highlighted their involvement in complex pathways, such as cytokine-cytokine receptor inter
To delve into the intricate interplay among key genes, we utilized the STRING online platform to generate a protein-PPI network, as depicted in Figure 4A. This network visually captures the complex relationships among these genes, providing insights into their potential functional collaborations in the context of PBC. Additionally, we leveraged Cytoscape software to highlight the top 5 genes that emerged prominently within the hierarchy of the PPI network, providing a focused perspective, as shown in Figure 4B. The top 5 genes with the highest degree values, CD247, IL10, CCL5, CCL3, and STAT3, were identified as hub genes in the network. The color intensity represents degree values, with darker colors indicating higher degree values, thereby highlighting the most significant genes in the network.
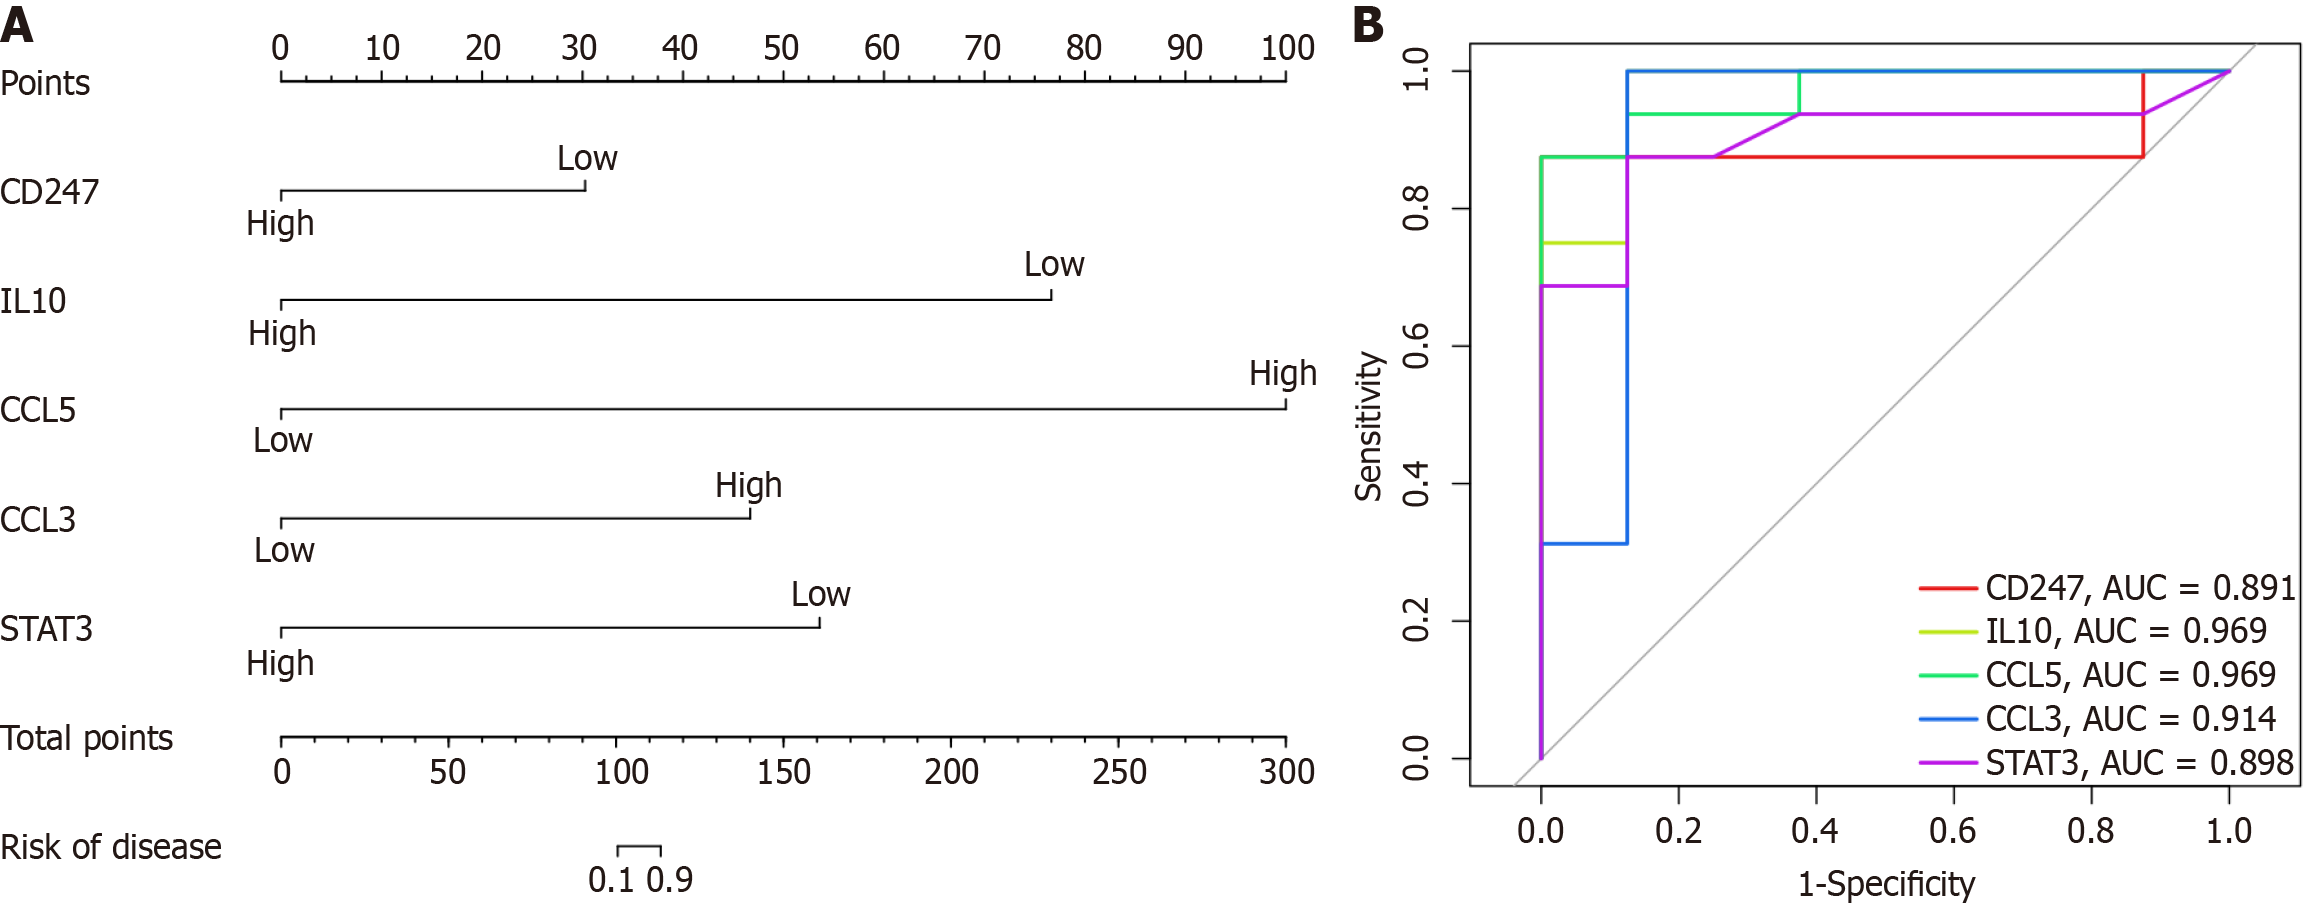
We developed a customized nomogram model, as depicted in Figure 5A, specifically tailored for accurate prediction of PBC risk. This model demonstrates remarkable competence in forecasting the emergence of this condition. Furthermore, ROC curves were generated to assess the diagnostic performance of five crucial genes, namely CD247, IL10, CCL5, CCL3, and STAT3. The AUC values, presented in Figure 5B, highlight the exceptional ability of these genes to distinguish between PBC patients and healthy individuals. The AUC values for CD247, IL10, CCL5, CCL3, and STAT3 were 0.891, 0.969, 0.969, 0.914, and 0.898, respectively.
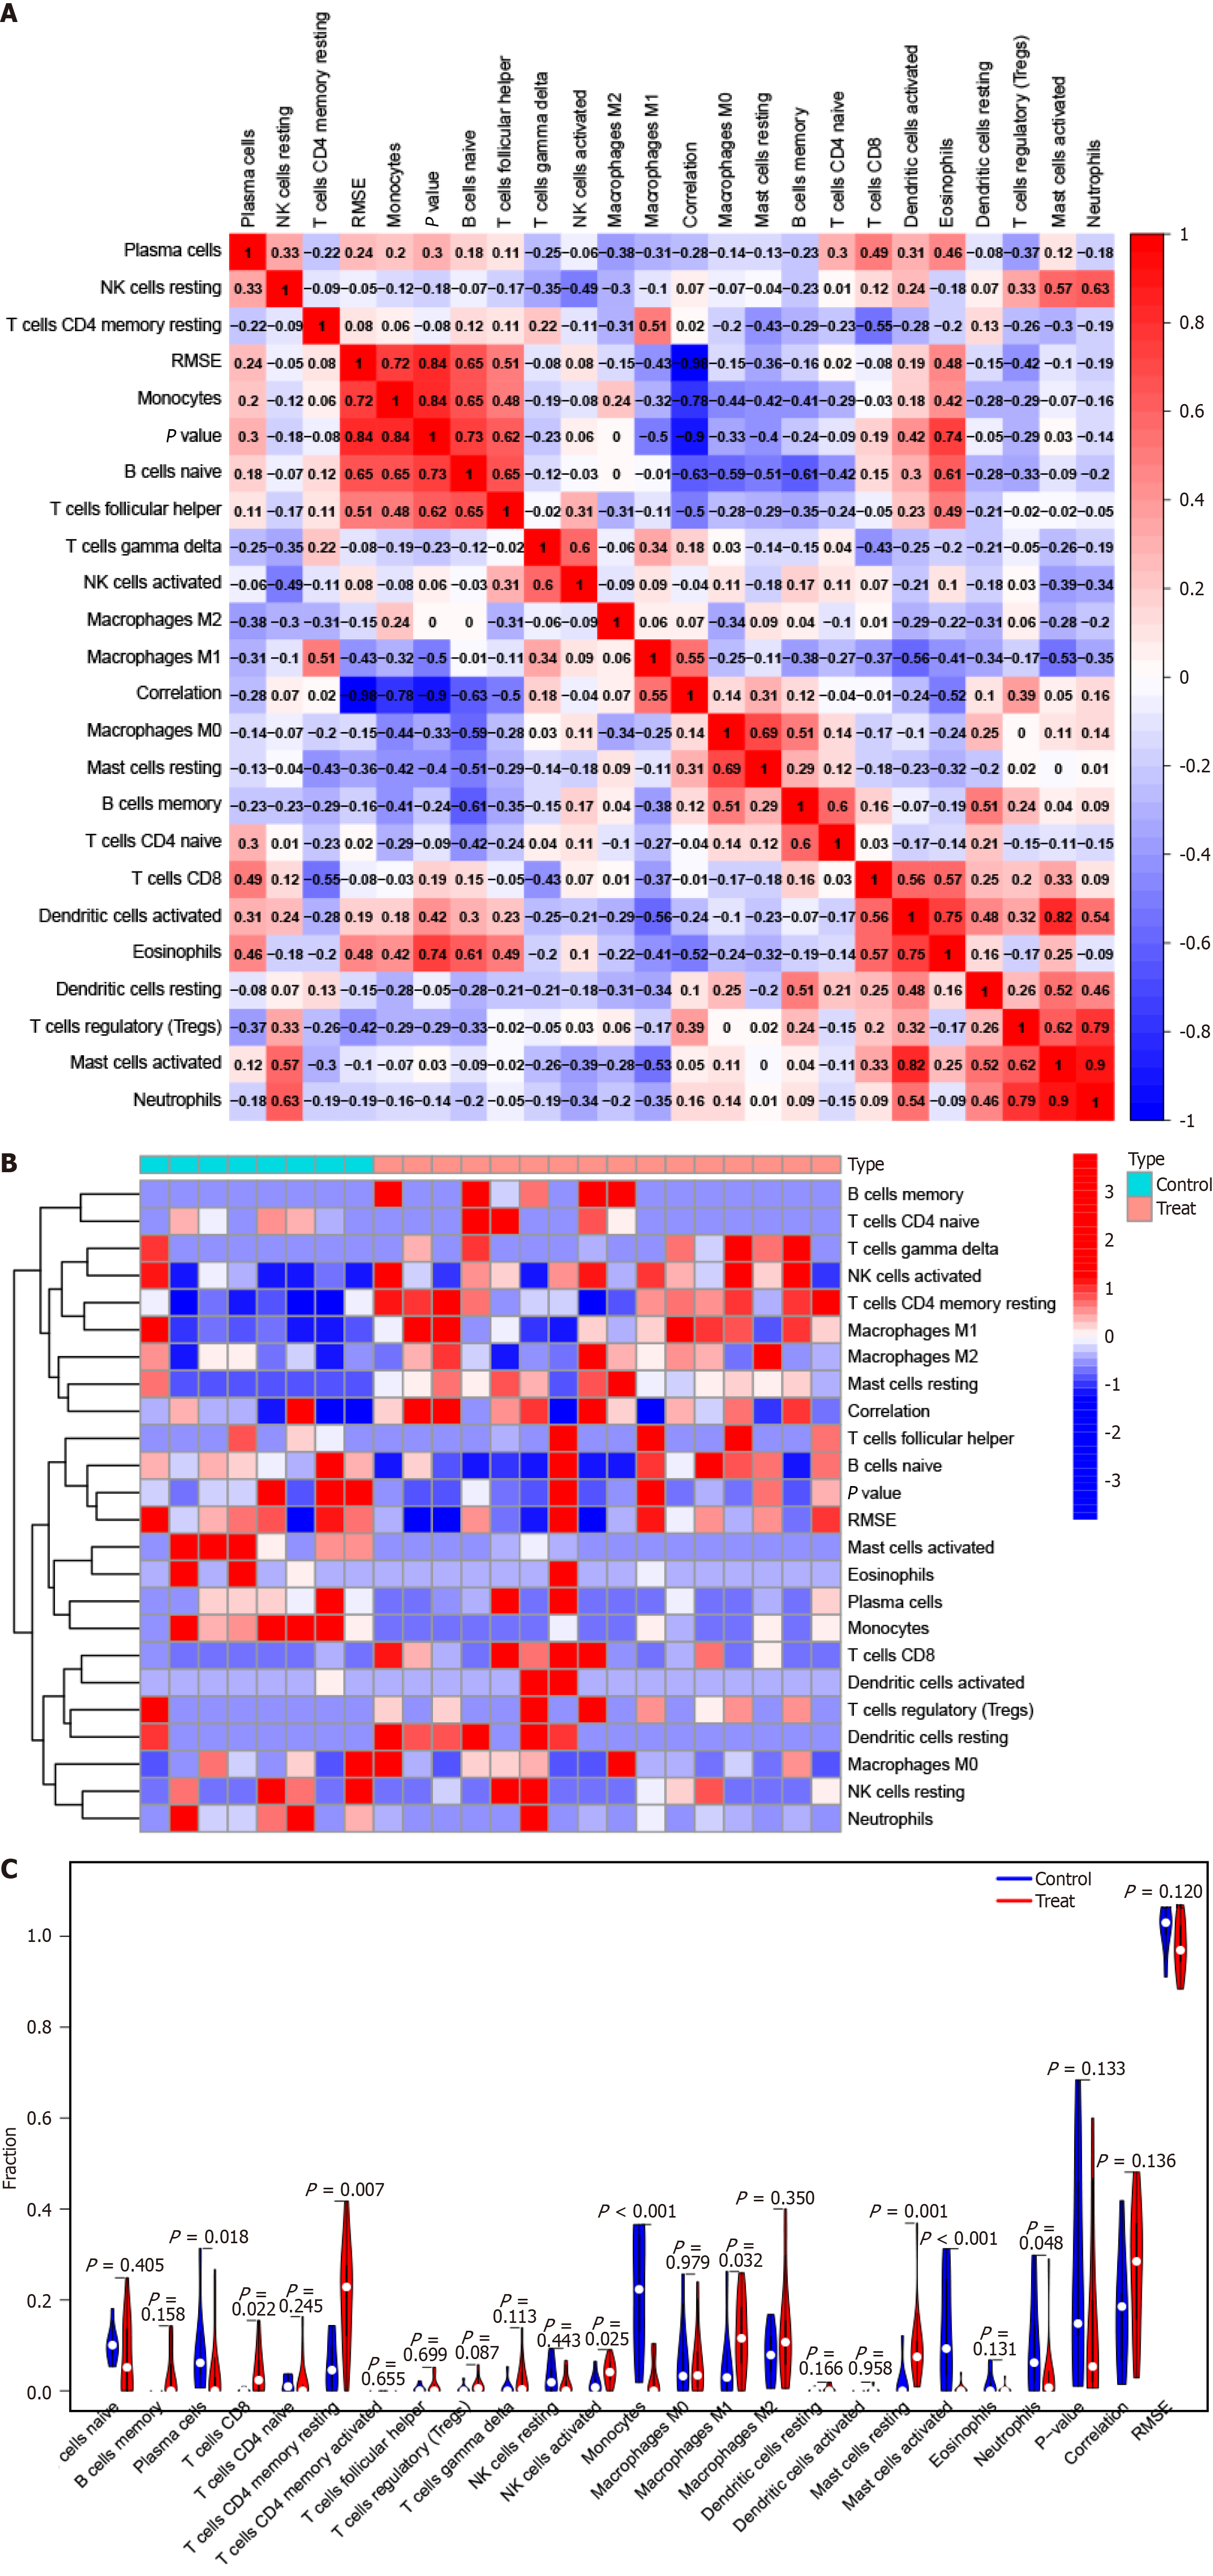
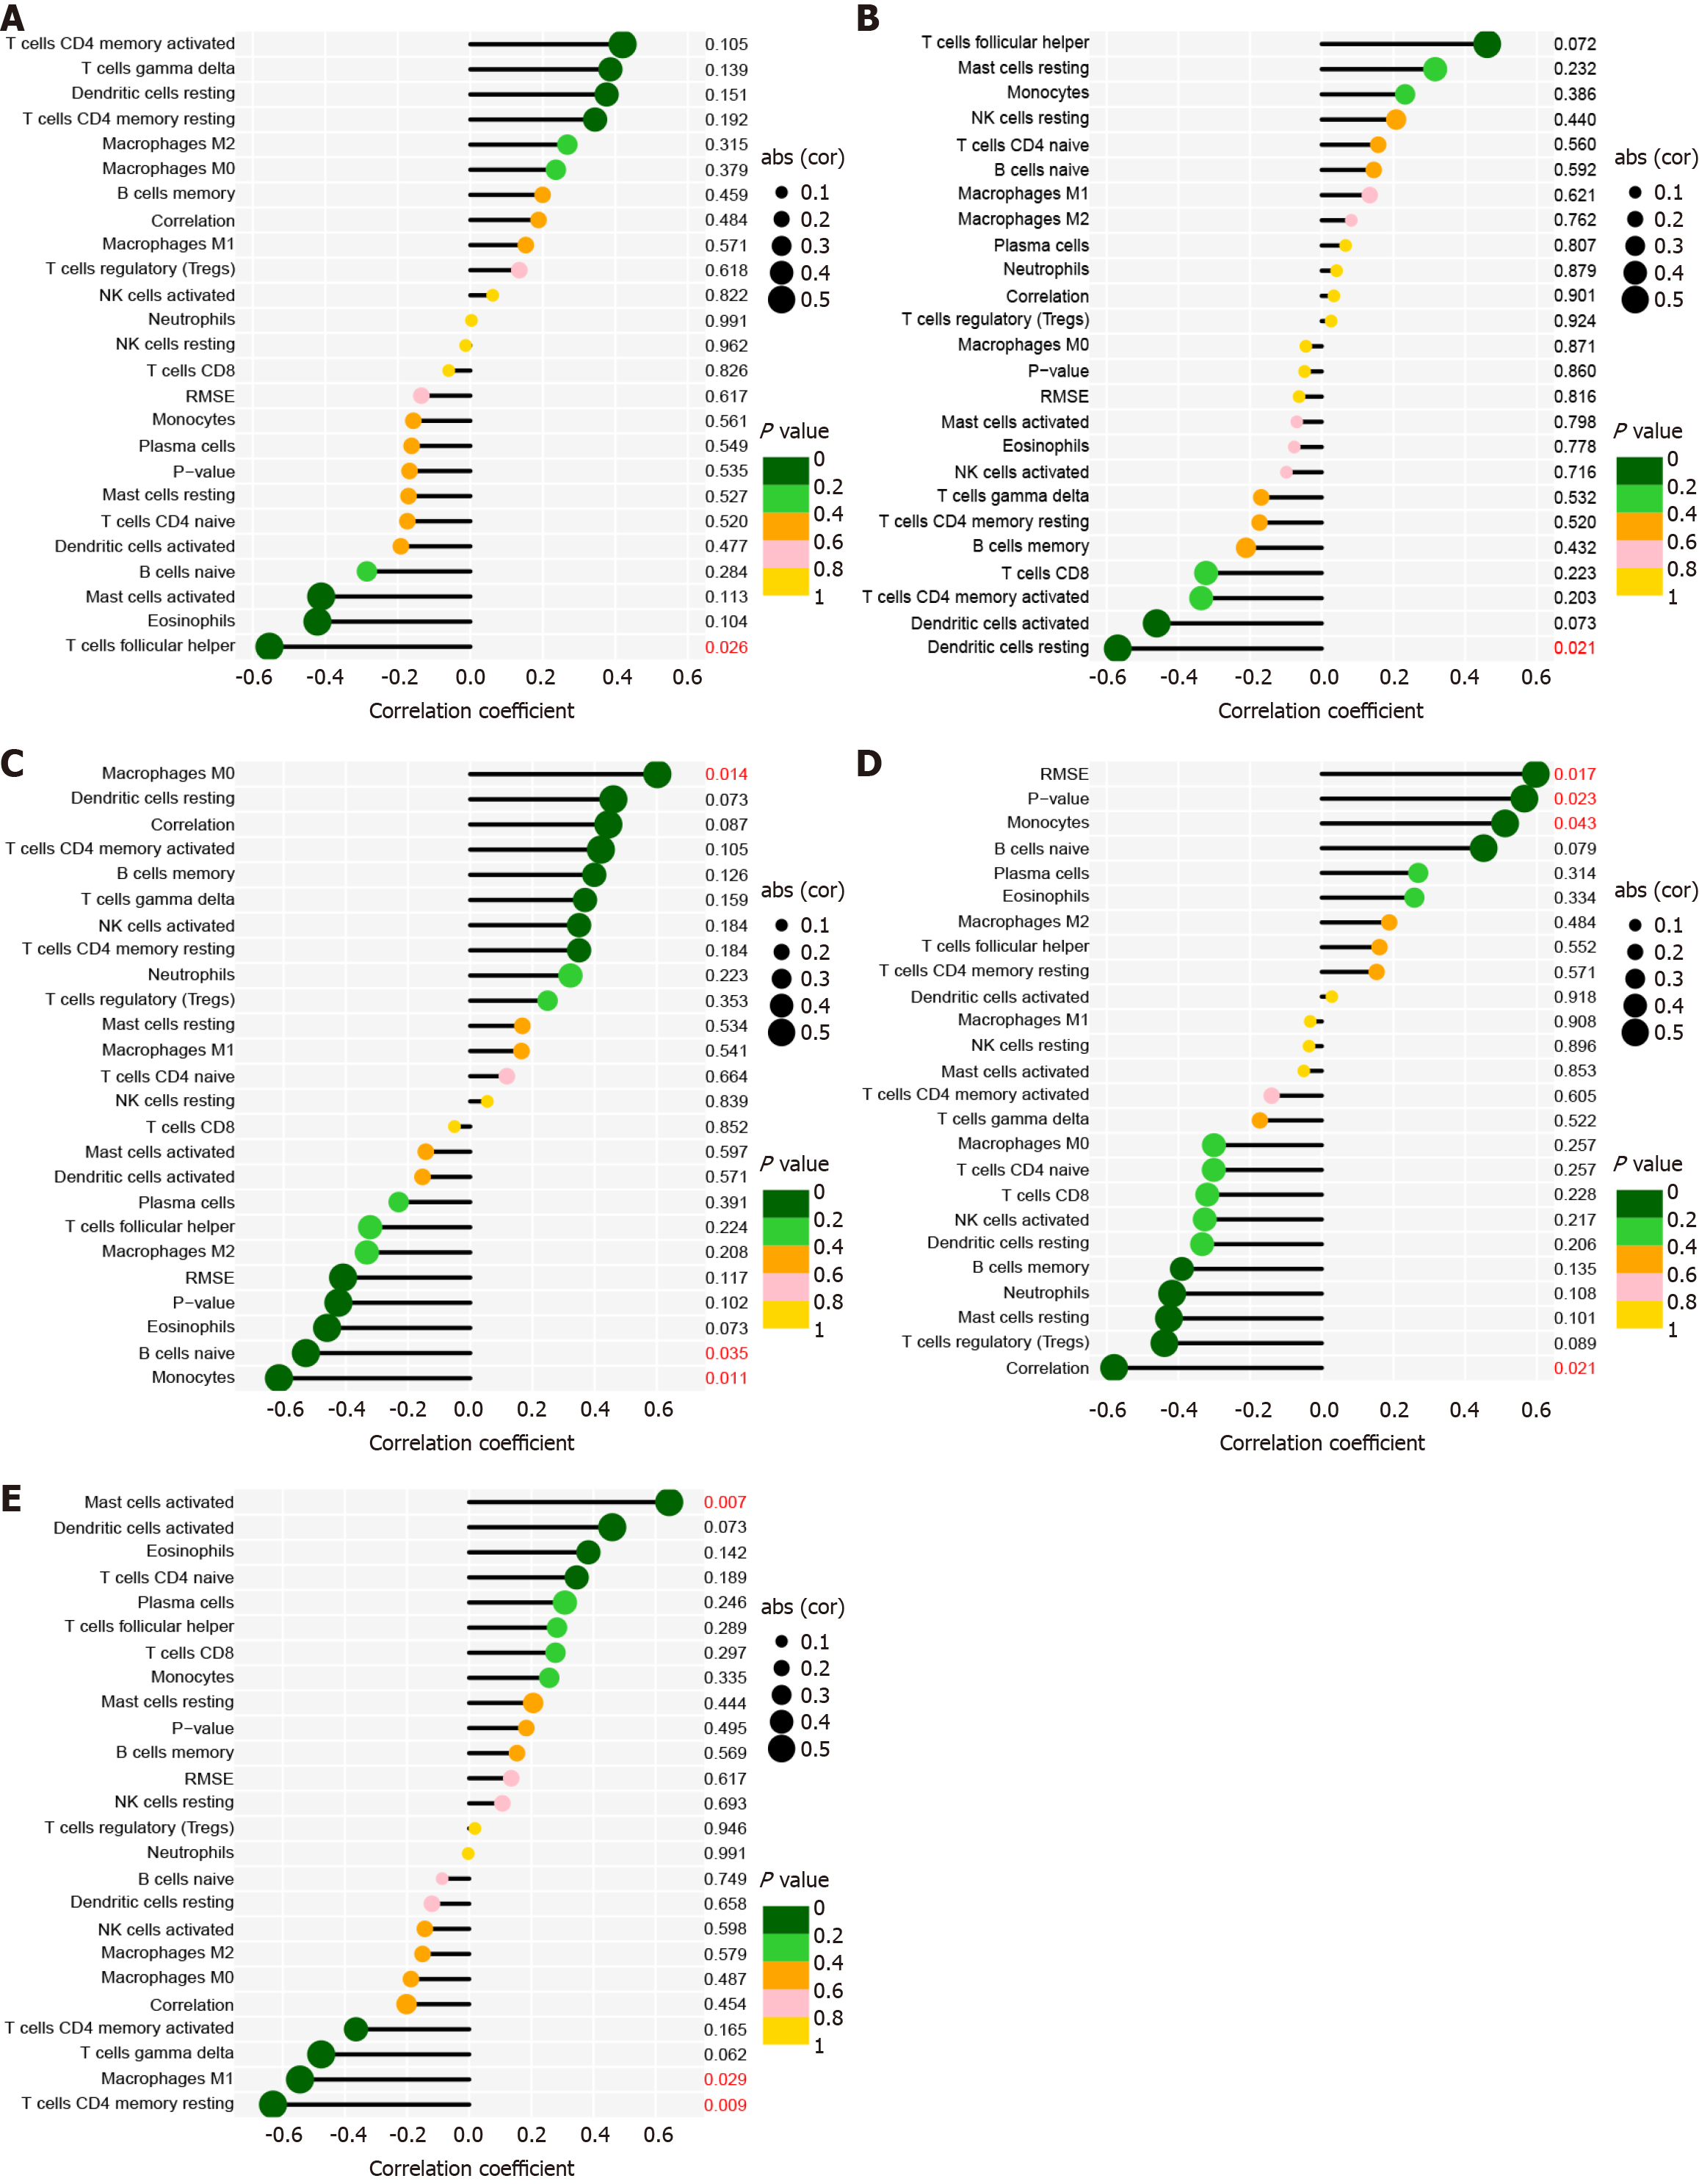
To identify the pertinence of hub genes within the immune microenvironment, the ratio of immune cell infiltration was analyzed using the CIBERSORT algorithm. The findings revealed distinct patterns of immune cell infiltration between PBC and HC (Figure 6). In addition, CD247 expression was significantly correlated with the ratio in T follicular helper cells (Figure 7A). IL10 expression was distinctly associated with resting dendritic cells (Figure 7B). CCL5 expression was significantly associated with the numbers of 3 types of immune cells, including M0 macrophages, naive B cells, and monocytes (Figure 7C). CCL3 expression was distinctly associated with monocytes (Figure 7D). Moreover, STAT3 expre
All SNPs were not considered weak IVs. We examined the causal association between hub genes and PBC using the IVW method. Our findings revealed no significant association between hub genes and PBC risk (Figure 8); IL10 [odds ratio (OR) 1.08, 95%CI: 0.99-1.18, NSNPs = 6, P = 0.10)], CCL5 (OR 0.95, 95%CI: 0.87-1.04, NSNPs = 24, P = 0.30), CCL3 (OR 1.00, 95%CI: 0.96-1.05, NSNPs = 22, P = 0.96), and STAT3 (OR 0.99, 95%CI: 0.91-1.08, NSNPs = 29, P = 0.82; Figure 8).
Advancements in molecular biology methodologies have sparked heightened interest in exploring genes linked to PBC. By analyzing genome-wide expression patterns, scientists can delve into intricate PBC-associated regulatory networks. Integrating genome-wide expression data enables researchers to identify key genes and dysregulated pathways in PBC, which can then be used as targets to develop therapies that specifically address the underlying molecular disease-related abnormalities. Advancements in molecular biology techniques have provided researchers with powerful tools to study gene roles in PBC progression. The analysis of gene expression profiles and integration of comprehensive genome-wide expression datasets has enabled researchers to decipher intricate regulatory mechanisms underlying PBC, ultimately aiming to identify promising therapeutic avenues for effective disease management.
Our investigation utilized the WGCNA and PPI methodologies to identify pivotal genes related to PBC. This analysis revealed five hub genes-CD247, IL10, CCL5, CCL3, and STAT3-that emerged as highly pertinent to PBC pathogenesis. Subsequently, we constructed a nomogram model integrating multiple factors, including the expression levels of the five hub genes, to accurately predict PBC risk, thereby providing a comprehensive tool for assessing PBC risk. The AUC analysis of the five pivotal genes underscored their proficiency in distinguishing PBC from the control cohort, empha
Using the Cytoscape software, we conducted a PPI network analysis and identified CD247 as the top-ranked gene in the network. CD247, also known as the CD3 zeta chain, is a crucial hub gene associated with PBC. CD247, a transmem
Interleukin-10 or IL10 plays a pivotal role in modulating immune responses and mitigating inflammation. Originating from diverse immune cells, such as T and B lymphocytes, macrophages, and dendritic cells, IL10 achieves its regulatory functions by engaging with specific receptors on target cells, subsequently triggering a cascade of intracellular signaling events[20,21]. The role of IL10 in PBC has been the subject of extensive research. Some studies have reported decreased levels of IL10 in PBC patients, suggesting that IL10 deficiency could play a role in disease pathogenesis[22,23]. IL10 de
This study marks the first exploration of the potential causal relationship between five hub genes and the risk of developing PBC using a two-sample MR analytical strategy. Utilizing extensive GWAS data for both hub genes (as exposures) and PBC (as the outcome), the MR investigation did not yield evidence indicating a causal relationship between these hub genes and PBC risk. MR methodology has a rigorous design similar to that of prospective randomized controlled trials and serves as a robust tool to counteract the systemic biases commonly encountered in traditional observational research, including confounding factors and the possibility of reverse causality. By incorporating highly precise genotyping methodologies, this approach effectively mitigates the issue of regression dilution due to detection inaccuracies. By leveraging genetic variants as IVs, MR analysis provides a robust framework to assess the causal relationships between exposures and outcomes. However, several limitations are associated with MR studies, including the assumption that genetic variants affect the outcome solely through the exposure of interest and the potential for horizontal pleiotropy. Further research is needed to explore the complex interplay between hub genes and PBC deve
Despite the significant findings, our study has a few other limitations. First, the bioinformatics-driven investigation into hub genes and their potential roles in PBC pathogenesis constitutes an initial step. To substantiate the specific mechanisms of these identified hub genes, subsequent biological experiments, encompassing both in vitro and in vivo studies, are imperative. These experiments would provide additional evidence of the functional roles of hub genes in PBC pathogenesis. Furthermore, it is crucial to note that our MR investigation was solely conducted among individuals of European descent, potentially limiting the broad applicability of our conclusions to diverse populations characterized by differing genetic profiles and environmental exposures. Replicated studies involving diverse populations would be valuable to assess the consistency and robustness of the observed associations. Addressing these limitations in future studies can build upon our findings and contribute to a more comprehensive understanding of the molecular mecha
Using WGCNA-based co-expression network analysis, we identified five hub genes strongly associated with PBC. This discovery provides a strong foundation for future research, enhancing our understanding of the intricate molecular mechanisms underlying PBC. It could propel the development of targeted therapeutic approaches and personalized treatment plans, advancing early diagnosis and optimized PBC management. Ultimately, these advancements are promising for improving patient outcomes and alleviating the overall burden of this liver disease.
We are grateful to all the participants and investigators involved in the TCGA and GWAS studies included in this study.
| 1. | Lindor KD, Bowlus CL, Boyer J, Levy C, Mayo M. Primary Biliary Cholangitis: 2018 Practice Guidance from the American Association for the Study of Liver Diseases. Hepatology. 2019;69:394-419. [RCA] [PubMed] [DOI] [Full Text] [Cited by in Crossref: 164] [Cited by in RCA: 417] [Article Influence: 69.5] [Reference Citation Analysis (0)] |
| 2. | Kowdley KV, Bowlus CL, Levy C, Akarca US, Alvares-da-Silva MR, Andreone P, Arrese M, Corpechot C, Francque SM, Heneghan MA, Invernizzi P, Jones D, Kruger FC, Lawitz E, Mayo MJ, Shiffman ML, Swain MG, Valera JM, Vargas V, Vierling JM, Villamil A, Addy C, Dietrich J, Germain JM, Mazain S, Rafailovic D, Taddé B, Miller B, Shu J, Zein CO, Schattenberg JM; ELATIVE Study Investigators’ Group; ELATIVE Study Investigators' Group. Efficacy and Safety of Elafibranor in Primary Biliary Cholangitis. N Engl J Med. 2024;390:795-805. [RCA] [PubMed] [DOI] [Full Text] [Cited by in Crossref: 126] [Cited by in RCA: 102] [Article Influence: 102.0] [Reference Citation Analysis (0)] |
| 3. | Hirschfield GM, Dyson JK, Alexander GJM, Chapman MH, Collier J, Hübscher S, Patanwala I, Pereira SP, Thain C, Thorburn D, Tiniakos D, Walmsley M, Webster G, Jones DEJ. The British Society of Gastroenterology/UK-PBC primary biliary cholangitis treatment and management guidelines. Gut. 2018;67:1568-1594. [RCA] [PubMed] [DOI] [Full Text] [Full Text (PDF)] [Cited by in Crossref: 179] [Cited by in RCA: 220] [Article Influence: 31.4] [Reference Citation Analysis (0)] |
| 4. | Younossi ZM, Bernstein D, Shiffman ML, Kwo P, Kim WR, Kowdley KV, Jacobson IM. Diagnosis and Management of Primary Biliary Cholangitis. Am J Gastroenterol. 2019;114:48-63. [RCA] [PubMed] [DOI] [Full Text] [Cited by in Crossref: 50] [Cited by in RCA: 126] [Article Influence: 21.0] [Reference Citation Analysis (0)] |
| 5. | Kawashima M, Hitomi Y, Aiba Y, Nishida N, Kojima K, Kawai Y, Nakamura H, Tanaka A, Zeniya M, Hashimoto E, Ohira H, Yamamoto K, Abe M, Nakao K, Yamagiwa S, Kaneko S, Honda M, Umemura T, Ichida T, Seike M, Sakisaka S, Harada M, Yokosuka O, Ueno Y, Senju M, Kanda T, Shibata H, Himoto T, Murata K, Miyake Y, Ebinuma H, Taniai M, Joshita S, Nikami T, Ota H, Kouno H, Kouno H, Nakamuta M, Fukushima N, Kohjima M, Komatsu T, Komeda T, Ohara Y, Muro T, Yamashita T, Yoshizawa K, Nakamura Y, Shimada M, Hirashima N, Sugi K, Ario K, Takesaki E, Naganuma A, Mano H, Yamashita H, Matsushita K, Yamauchi K, Makita F, Nishimura H, Furuta K, Takahashi N, Kikuchi M, Masaki N, Tanaka T, Tamura S, Mori A, Yagi S, Shirabe K, Komori A, Migita K, Ito M, Nagaoka S, Abiru S, Yatsuhashi H, Yasunami M, Shimoda S, Harada K, Egawa H, Maehara Y, Uemoto S, Kokudo N, Takikawa H, Ishibashi H, Chayama K, Mizokami M, Nagasaki M, Tokunaga K, Nakamura M. Genome-wide association studies identify PRKCB as a novel genetic susceptibility locus for primary biliary cholangitis in the Japanese population. Hum Mol Genet. 2017;26:650-659. [RCA] [PubMed] [DOI] [Full Text] [Cited by in Crossref: 11] [Cited by in RCA: 23] [Article Influence: 2.9] [Reference Citation Analysis (0)] |
| 6. | Langfelder P, Horvath S. WGCNA: an R package for weighted correlation network analysis. BMC Bioinformatics. 2008;9:559. [RCA] [PubMed] [DOI] [Full Text] [Full Text (PDF)] [Cited by in Crossref: 10254] [Cited by in RCA: 16404] [Article Influence: 964.9] [Reference Citation Analysis (0)] |
| 7. | Yuan Y, Chen J, Wang J, Xu M, Zhang Y, Sun P, Liang L. Identification Hub Genes in Colorectal Cancer by Integrating Weighted Gene Co-Expression Network Analysis and Clinical Validation in vivo and vitro. Front Oncol. 2020;10:638. [RCA] [PubMed] [DOI] [Full Text] [Full Text (PDF)] [Cited by in Crossref: 37] [Cited by in RCA: 39] [Article Influence: 7.8] [Reference Citation Analysis (0)] |
| 8. | Lawlor DA, Harbord RM, Sterne JA, Timpson N, Davey Smith G. Mendelian randomization: using genes as instruments for making causal inferences in epidemiology. Stat Med. 2008;27:1133-1163. [RCA] [PubMed] [DOI] [Full Text] [Cited by in Crossref: 3525] [Cited by in RCA: 2999] [Article Influence: 176.4] [Reference Citation Analysis (0)] |
| 9. | Davey Smith G, Hemani G. Mendelian randomization: genetic anchors for causal inference in epidemiological studies. Hum Mol Genet. 2014;23:R89-R98. [RCA] [PubMed] [DOI] [Full Text] [Full Text (PDF)] [Cited by in Crossref: 2280] [Cited by in RCA: 2911] [Article Influence: 264.6] [Reference Citation Analysis (0)] |
| 10. | Kanehisa M, Goto S. KEGG: kyoto encyclopedia of genes and genomes. Nucleic Acids Res. 2000;28:27-30. [RCA] [PubMed] [DOI] [Full Text] [Cited by in Crossref: 18868] [Cited by in RCA: 24696] [Article Influence: 987.8] [Reference Citation Analysis (0)] |
| 11. | Iasonos A, Schrag D, Raj GV, Panageas KS. How to build and interpret a nomogram for cancer prognosis. J Clin Oncol. 2008;26:1364-1370. [RCA] [PubMed] [DOI] [Full Text] [Cited by in Crossref: 1306] [Cited by in RCA: 2304] [Article Influence: 135.5] [Reference Citation Analysis (0)] |
| 12. | Chen B, Khodadoust MS, Liu CL, Newman AM, Alizadeh AA. Profiling Tumor Infiltrating Immune Cells with CIBERSORT. Methods Mol Biol. 2018;1711:243-259. [RCA] [PubMed] [DOI] [Full Text] [Cited by in Crossref: 993] [Cited by in RCA: 2448] [Article Influence: 349.7] [Reference Citation Analysis (0)] |
| 13. | Wang C, Zhu D, Zhang D, Zuo X, Yao L, Liu T, Ge X, He C, Zhou Y, Shen Z. Causal role of immune cells in schizophrenia: Mendelian randomization (MR) study. BMC Psychiatry. 2023;23:590. [RCA] [PubMed] [DOI] [Full Text] [Full Text (PDF)] [Cited by in Crossref: 1] [Cited by in RCA: 186] [Article Influence: 93.0] [Reference Citation Analysis (0)] |
| 14. | Tapia-Galisteo A, Compte M, Álvarez-Vallina L, Sanz L. When three is not a crowd: trispecific antibodies for enhanced cancer immunotherapy. Theranostics. 2023;13:1028-1041. [RCA] [PubMed] [DOI] [Full Text] [Full Text (PDF)] [Cited by in Crossref: 1] [Cited by in RCA: 52] [Article Influence: 26.0] [Reference Citation Analysis (0)] |
| 15. | Call ME, Pyrdol J, Wiedmann M, Wucherpfennig KW. The organizing principle in the formation of the T cell receptor-CD3 complex. Cell. 2002;111:967-979. [RCA] [PubMed] [DOI] [Full Text] [Cited by in Crossref: 310] [Cited by in RCA: 329] [Article Influence: 14.3] [Reference Citation Analysis (0)] |
| 16. | Zhao SX, Li WC, Fu N, Zhou GD, Liu SH, Jiang LN, Zhang YG, Wang RQ, Nan YM, Zhao JM. Emperipolesis mediated by CD8(+) T cells correlates with biliary epithelia cell injury in primary biliary cholangitis. J Cell Mol Med. 2020;24:1268-1275. [RCA] [PubMed] [DOI] [Full Text] [Full Text (PDF)] [Cited by in Crossref: 6] [Cited by in RCA: 20] [Article Influence: 3.3] [Reference Citation Analysis (0)] |
| 17. | Oertelt S, Lian ZX, Cheng CM, Chuang YH, Padgett KA, He XS, Ridgway WM, Ansari AA, Coppel RL, Li MO, Flavell RA, Kronenberg M, Mackay IR, Gershwin ME. Anti-mitochondrial antibodies and primary biliary cirrhosis in TGF-beta receptor II dominant-negative mice. J Immunol. 2006;177:1655-1660. [RCA] [PubMed] [DOI] [Full Text] [Cited by in Crossref: 202] [Cited by in RCA: 195] [Article Influence: 10.3] [Reference Citation Analysis (0)] |
| 18. | Yang GX, Lian ZX, Chuang YH, Moritoki Y, Lan RY, Wakabayashi K, Ansari AA, Flavell RA, Ridgway WM, Coppel RL, Tsuneyama K, Mackay IR, Gershwin ME. Adoptive transfer of CD8(+) T cells from transforming growth factor beta receptor type II (dominant negative form) induces autoimmune cholangitis in mice. Hepatology. 2008;47:1974-1982. [RCA] [PubMed] [DOI] [Full Text] [Full Text (PDF)] [Cited by in Crossref: 91] [Cited by in RCA: 89] [Article Influence: 5.2] [Reference Citation Analysis (0)] |
| 19. | Shimoda S, Harada K, Niiro H, Shirabe K, Taketomi A, Maehara Y, Tsuneyama K, Nakanuma Y, Leung P, Ansari AA, Gershwin ME, Akashi K. Interaction between Toll-like receptors and natural killer cells in the destruction of bile ducts in primary biliary cirrhosis. Hepatology. 2011;53:1270-1281. [RCA] [PubMed] [DOI] [Full Text] [Full Text (PDF)] [Cited by in Crossref: 108] [Cited by in RCA: 103] [Article Influence: 7.4] [Reference Citation Analysis (0)] |
| 20. | Ouyang W, Rutz S, Crellin NK, Valdez PA, Hymowitz SG. Regulation and functions of the IL-10 family of cytokines in inflammation and disease. Annu Rev Immunol. 2011;29:71-109. [RCA] [PubMed] [DOI] [Full Text] [Cited by in Crossref: 1100] [Cited by in RCA: 1417] [Article Influence: 101.2] [Reference Citation Analysis (0)] |
| 21. | Wang X, Wong K, Ouyang W, Rutz S. Targeting IL-10 Family Cytokines for the Treatment of Human Diseases. Cold Spring Harb Perspect Biol. 2019;11. [RCA] [PubMed] [DOI] [Full Text] [Cited by in Crossref: 89] [Cited by in RCA: 202] [Article Influence: 33.7] [Reference Citation Analysis (0)] |
| 22. | Qiu C, Yang L, Liu S, Zhang C, Zhang Q, Jin Z. Interleukin-35 dampens T helper 22 phenotype shift in CD4+CD25+CD127dim/- regulatory T cells in primary biliary cholangitis. Int Immunopharmacol. 2023;109751. [RCA] [PubMed] [DOI] [Full Text] [Reference Citation Analysis (0)] |
| 23. | Chen Q, Lai L, Chi X, Lu X, Wu H, Sun J, Wu W, Cai L, Zeng X, Wang C, Chen W, Peng A. CD19(+)CD24(hi)CD38(hi) B Cell Dysfunction in Primary Biliary Cholangitis. Mediators Inflamm. 2020;2020:3019378. [RCA] [PubMed] [DOI] [Full Text] [Full Text (PDF)] [Cited by in Crossref: 5] [Cited by in RCA: 14] [Article Influence: 2.8] [Reference Citation Analysis (0)] |
| 24. | Hsueh YH, Chen HW, Syu BJ, Lin CI, Leung PSC, Gershwin ME, Chuang YH. Endogenous IL-10 maintains immune tolerance but IL-10 gene transfer exacerbates autoimmune cholangitis. J Autoimmun. 2018;95:159-170. [RCA] [PubMed] [DOI] [Full Text] [Cited by in Crossref: 6] [Cited by in RCA: 17] [Article Influence: 2.4] [Reference Citation Analysis (0)] |
| 25. | Hsueh YH, Chang YN, Loh CE, Gershwin ME, Chuang YH. AAV-IL-22 modifies liver chemokine activity and ameliorates portal inflammation in murine autoimmune cholangitis. J Autoimmun. 2016;66:89-97. [RCA] [PubMed] [DOI] [Full Text] [Cited by in Crossref: 27] [Cited by in RCA: 35] [Article Influence: 3.9] [Reference Citation Analysis (0)] |


