Published online Sep 6, 2024. doi: 10.12998/wjcc.v12.i25.5681
Revised: May 25, 2024
Accepted: July 1, 2024
Published online: September 6, 2024
Processing time: 130 Days and 21.1 Hours
Sepsis, which is characterized by acute systemic inflammation and is associated with high rates of morbidity and mortality, presents a significant challenge in health care. Some scholars have found that the sequential organ failure assess
To assess cytokine levels in the plasma of sepsis patients and identify potential biomarkers for diagnosing sepsis.
Ten sepsis patients admitted to the emergency department within 24 h of onset were enrolled as the observation group, whereas ten noninfected patients served as the control group. Of the 10 noninfected patients, 9 hypertension combined with cerebral infarction, 1 patients with vertiginous syndrome. Plasma Cytokines were measured using the Bio-Plex Pro™ Human Chemokine Panel 40-plex. Differentially expressed cytokines in plasma of sepsis and nonsepsis patients were analyzed using Gene Ontology (GO) functional enrichment and Kyoto Encyclopedia of Genes and Genomes (KEGG) pathway analyses.
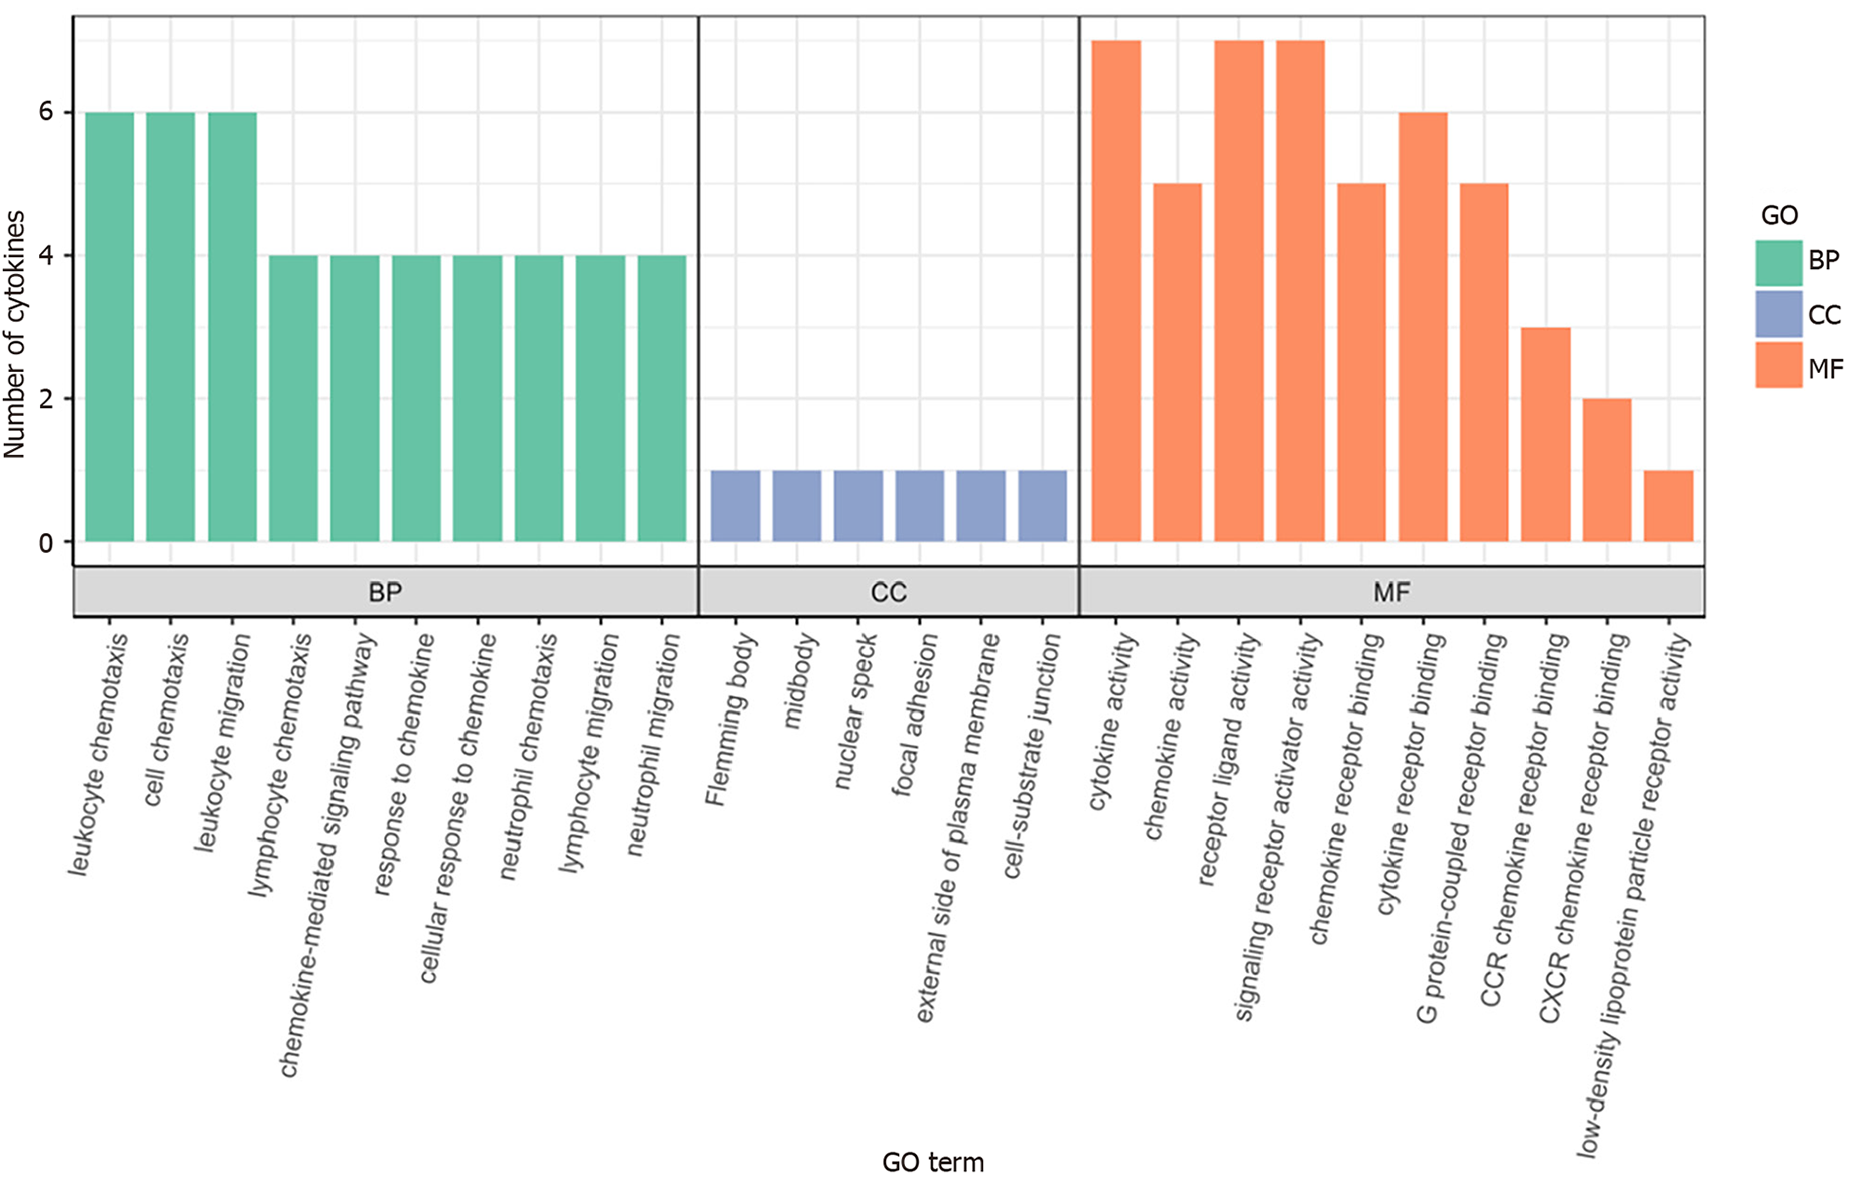
Interleukin (IL)-16, granulocyte-macrophage granulocyte-macrophage colony-stimulating factor (GM-CSF), CX3CL1, CXCL9, CXCL16, CCL25, and CCL23 plasma levels were significantly increased in sepsis patients. GO analysis revealed that these cytokines were mainly associated with cellular structures such as intermediates, nuclear plaques, adhesion plaques, lateral plasma membranes, and cell matrix junctions. These genes were involved in various molecular functions, such as cytokine activity, receptor ligand activity, and signal receptor activator activity, contributing to various biological functions, such as leukocyte chemotaxis, migration, and chemotaxis. KEGG analysis indicated involvement in cytokine cytokine receptor interactions, chemokine signaling pathways, virus–protein interactions with cytokines and cytokine receptors, and the tumor necrosis factor signaling pathway.
Elevated serum levels of IL-16, GM-CSF, CX3CL1, CXCL9, CXCL16, CCL25, and CCL23 in sepsis patients suggest their potential as diagnostic biomarkers for sepsis.
Core Tip: Clinically, sequential organ failure assessment (SOFA) or quick SOFA (qSOFA) scores are often used to identify and diagnose sepsis. However, some scholars have found that qSOFA scores are not good at predicting severe sepsis and mortality. Therefore, it is necessary to explore a new diagnostic method for sepsis. In this study, changes in plasma cytokine levels in patients with sepsis were assessed. We found that the serum levels of the cytokines interleukin16, granulocyte-macrophage colony-stimulating factor, CX3CL1, CXCL9, CXCL16, CCL25 and CCL23 were significantly increased in patients with sepsis, representing potential diagnostic biomarkers of sepsis.
- Citation: Liu HX, Wang YY, Yang XF. Differential expression of plasma cytokines in sepsis patients and their clinical implications. World J Clin Cases 2024; 12(25): 5681-5696
- URL: https://www.wjgnet.com/2307-8960/full/v12/i25/5681.htm
- DOI: https://dx.doi.org/10.12998/wjcc.v12.i25.5681
Sepsis, which is characterized by acute systemic inflammation and is associated with high rates of morbidity and mortality, presents a significant challenge in health care[1]. Accurate identification of sepsis and the ability to predict patients at risk of developing this condition are pivotal for effective treatment interventions[2]. Recent epidemiological studies have suggested the use of organ dysfunction classification systems such as the sequential organ failure assessment (SOFA) or quick SOFA (qSOFA) scores for diagnosing sepsis[3]. However, some scholars have reported limitations in the performance of qSOFA scores, particularly in predicting severe sepsis and mortality, with up to two-thirds of emergency department patients with severe sepsis remaining undetected[4].
Although microbial cultures are valuable for diagnosing sepsis, they have limitations, including a time delay of 2-3 d for bacterial growth and an inability to provide early diagnostic and treatment guidance[3]. Therefore, there is a pressing need to explore novel diagnostic approaches for sepsis[3].
Several biomarkers have been proposed to aid in sepsis diagnosis[3], including C-reactive protein (CRP) and procalcitonin (PCT)[5]. CRP, an acute-phase reactive protein, can help in excluding sepsis when its levels are not significantly elevated. However, elevated CRP levels cannot discern whether inflammation stems from infection or noninfectious causes[6]. PCT, which is synthesized and secreted by thyroid parafollicular cells, often increases during sepsis but also in noninfectious conditions such as surgery or trauma, limiting its diagnostic specificity for sepsis[7]. Consequently, there is a critical need for identifying new, more sensitive, and specific diagnostic biomarkers for sepsis.
Cytokines have emerged as potential biomarkers for distinguishing sepsis from other nonseptic conditions[8]. These small peptide factors, synthesized and secreted by immune and nonimmune cells, regulate various physiological functions, including the immune response, hematopoiesis, cell growth, and tissue repair. Excessive cytokine production during sepsis can lead to a cytokine storm, contributing to systemic inflammatory response syndrome, multiorgan damage, and mortality[9]. Despite their pivotal role in sepsis pathogenesis, the utility of cytokines as sepsis biomarkers remains to be fully elucidated[10].
Plasma proteomics has emerged as a promising tool for identifying fluid biomarkers for sepsis[11]. In this study, we used the Bio-Plex Pro™ Human Chemokine Panel 40-plex (Bio-Rad Laboratories, Inc., CA, United States) on the Luminex 200 system (Luminex Corporation, Austin, TX, United States) platform to assess cytokine alterations in the plasma of sepsis patients. Using hierarchical clustering analysis, functional enrichment analysis, and Kyoto Encyclopedia of Genes and Genomes (KEGG) pathway enrichment analysis, we aimed to identify potential diagnostic biomarkers for sepsis.
Subjects: The observation group comprised ten patients who were diagnosed with sepsis and treated at the Emergency Department of Putuo District People's Hospital, Shanghai, from June 2022 to November 2022. The observation group included 5 males and 5 females whose mean age at admission was 83.10 ± 10.05 years. In addition, 10 patients admitted to the same ward at the same time were selected as the control group, 9 hypertension combined with cerebral infarction, 1 patients with vertiginous syndrome, all of whom had no infection or infectious diseases. The control group included 5 males and 5 females whose mean age at admission was 81.80 ± 9.390 years. No significant differences in sex, age, height, or weight were noted between the observation group (sepsis group) and the control group (nonsepsis group) (P > 0.05), ensuring comparability. All patients provided written informed consent. After admission, general conditions, vital signs, and hospital diagnoses were recorded. Plasma was separated from whole blood, and the white blood cell count, neutrophil ratio, platelet count, liver and kidney function, PCT, CRP, and D-dimer were recorded. Both groups received standardized treatment after admission, with seven survivors and three deaths in each group.
The study protocol was approved by the Ethics Committee of Shanghai Putuo District People's Hospital.
Sepsis diagnostic criteria: Patients in the sepsis group met the Sepsis 3.0 diagnostic criteria with a SOFA score ≥ 2[12].
Inclusion and exclusion criteria: In both groups, patients with severe mental illness, severe chronic cardiac, liver or kidney failure, cancer patients, patients who had taken oral glucocorticoids for more than two months or received intravenous glucocorticoids within the past month, patients with acquired immunodeficiency syndrome, and patients who had undergone surgery or suffered severe trauma within the past three months were excluded.
Initially, standards and samples were processed according to the instructions of the kit. The plasma samples (from 10 patients) were centrifuged to obtain the supernatant, which was then diluted four times with sample diluent. Standard samples were diluted with standard diluent to generate standard curves (S1-S8). Subsequently, the Bio-Plex Pro™ Human Chemokine Panel 40-plex (Bio-Rad Laboratories, Inc., CA, United States) was used to analyze the samples according to the manufacturer's instructions. The samples were incubated for 1 h. Then, samples were incubated with the appropriate antibody for 30 min followed by streptavidin-PE for 10 min. Fluorescence detection FI values were obtained for samples and standard samples using the Luminex 200 system (Luminex Corporation, Austin, TX, United States). Two replicates of detection were performed for both the samples and standard samples. The coefficient of variation of all standard samples was less than 20%, indicating good reproducibility and compliance with quality control requirements. Based on the FI values obtained from the standard samples, standard curves and equations were generated, with concentrations reported in pg/mL. Finally, the original fluorescence detected for each sample was substituted into the standard curve equation to calculate the sample concentration for intersample comparisons.
Data assignments and statistical analysis of inter-group differences: When values were out of range (OOR) according to the software analysis, a value half lower than the lowest standard concentration was assigned (as standard dilution was 1:4) for OOR values below the curves, and a value two times higher than the highest standard concentration was assigned for OOR values above the curve. Further statistical analysis of the difference between groups was conducted using Student's t test to determine significance, with the ratio of the mean between the groups representing the up- or downward relationship of the two groups and the final result obtained using Luminex-statistical analysis of the difference results.
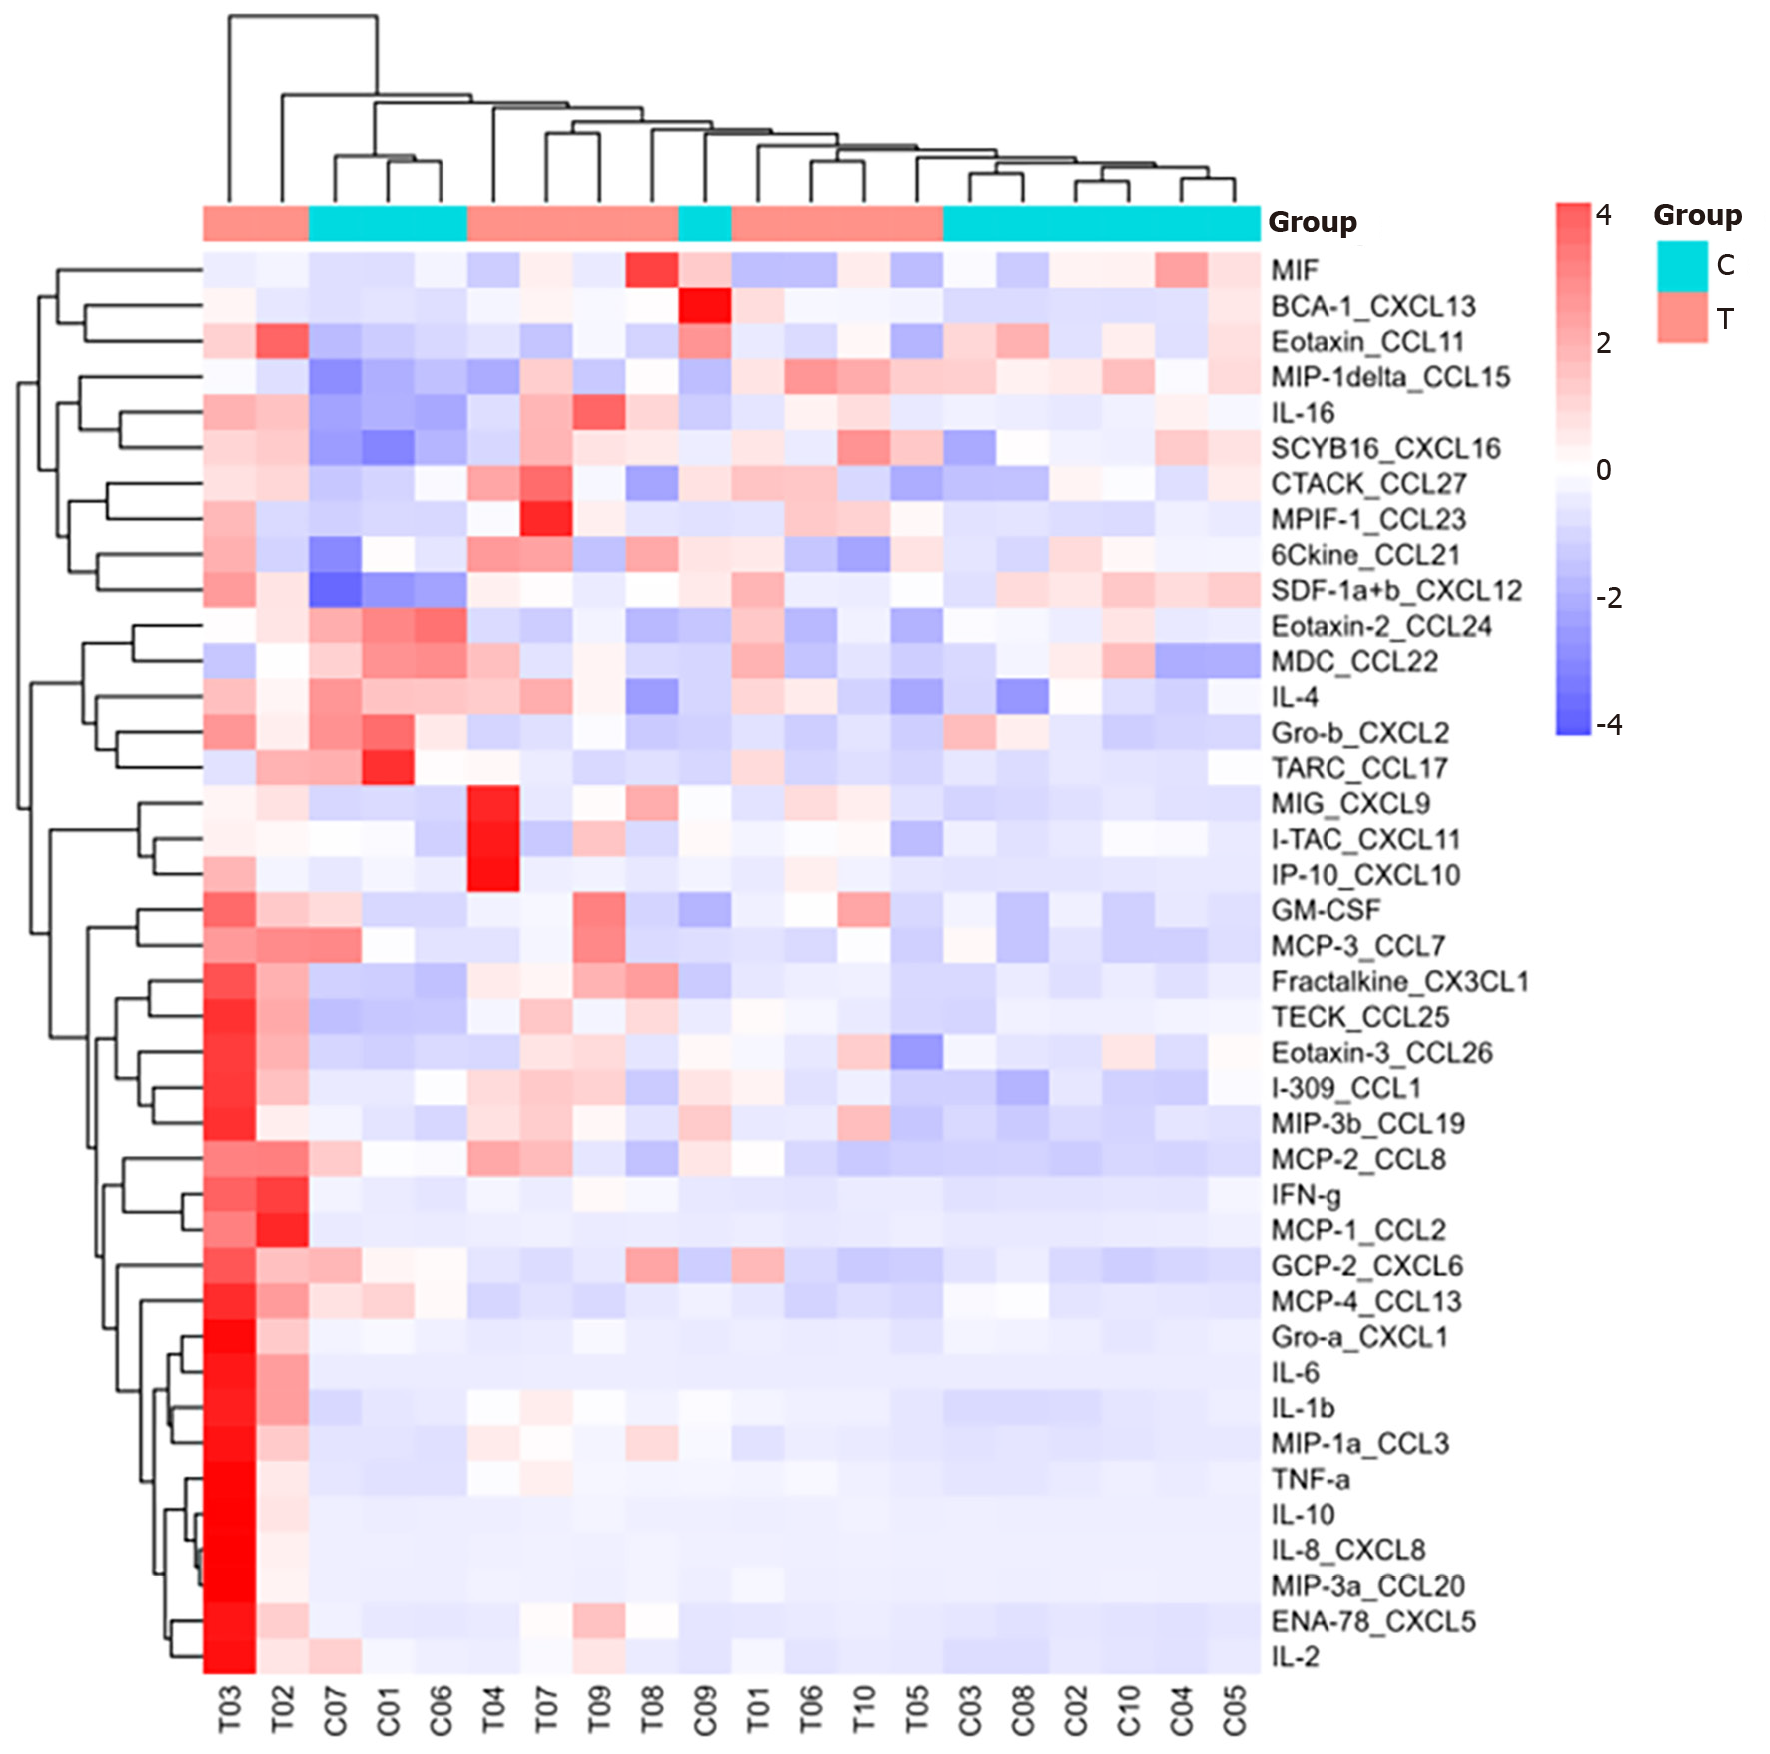
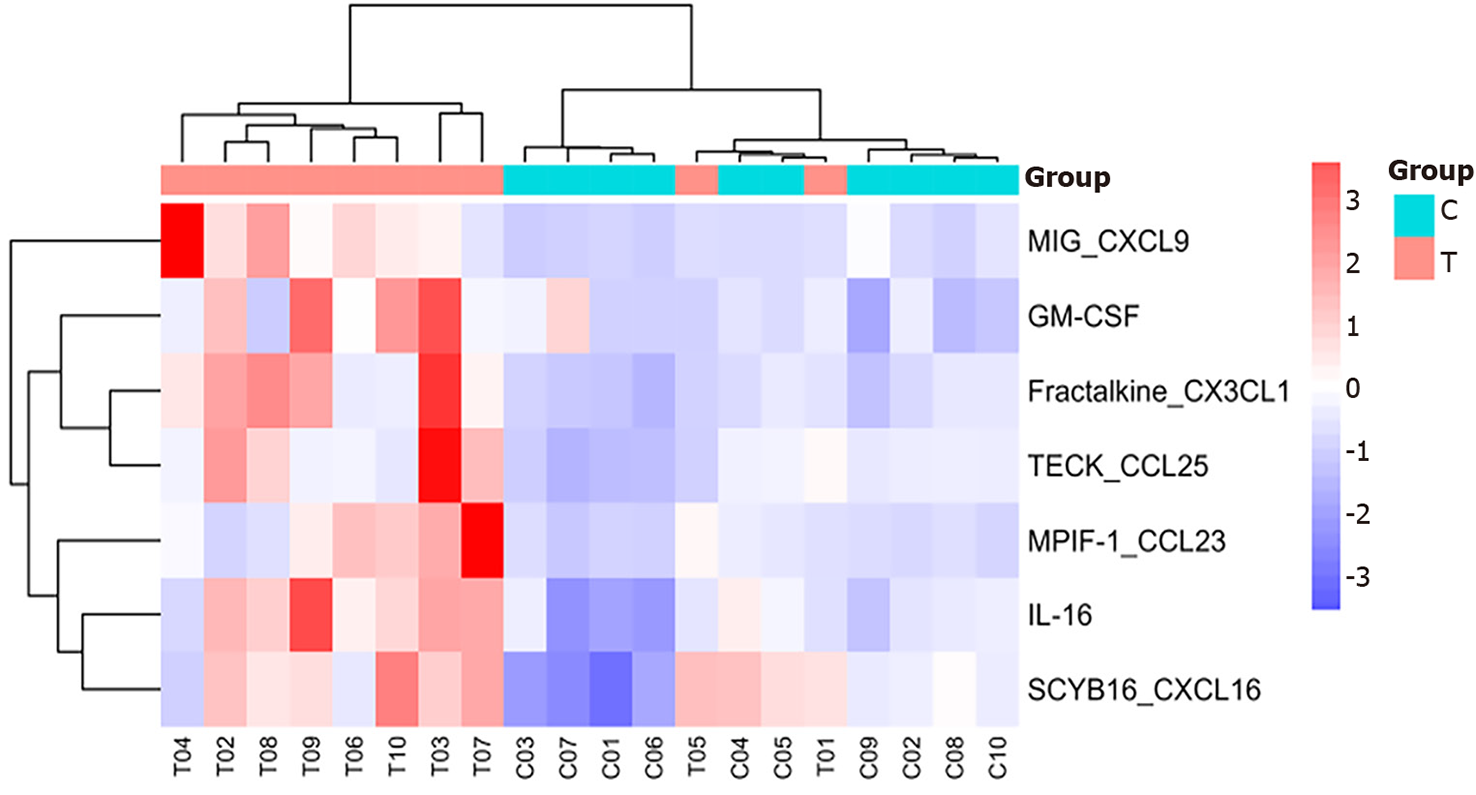
Heatmap analysis: Hierarchical cluster analysis was used to generate cluster heatmaps from the assigned data, and R pheatmap (version 1.0.12) software was used for visualization.
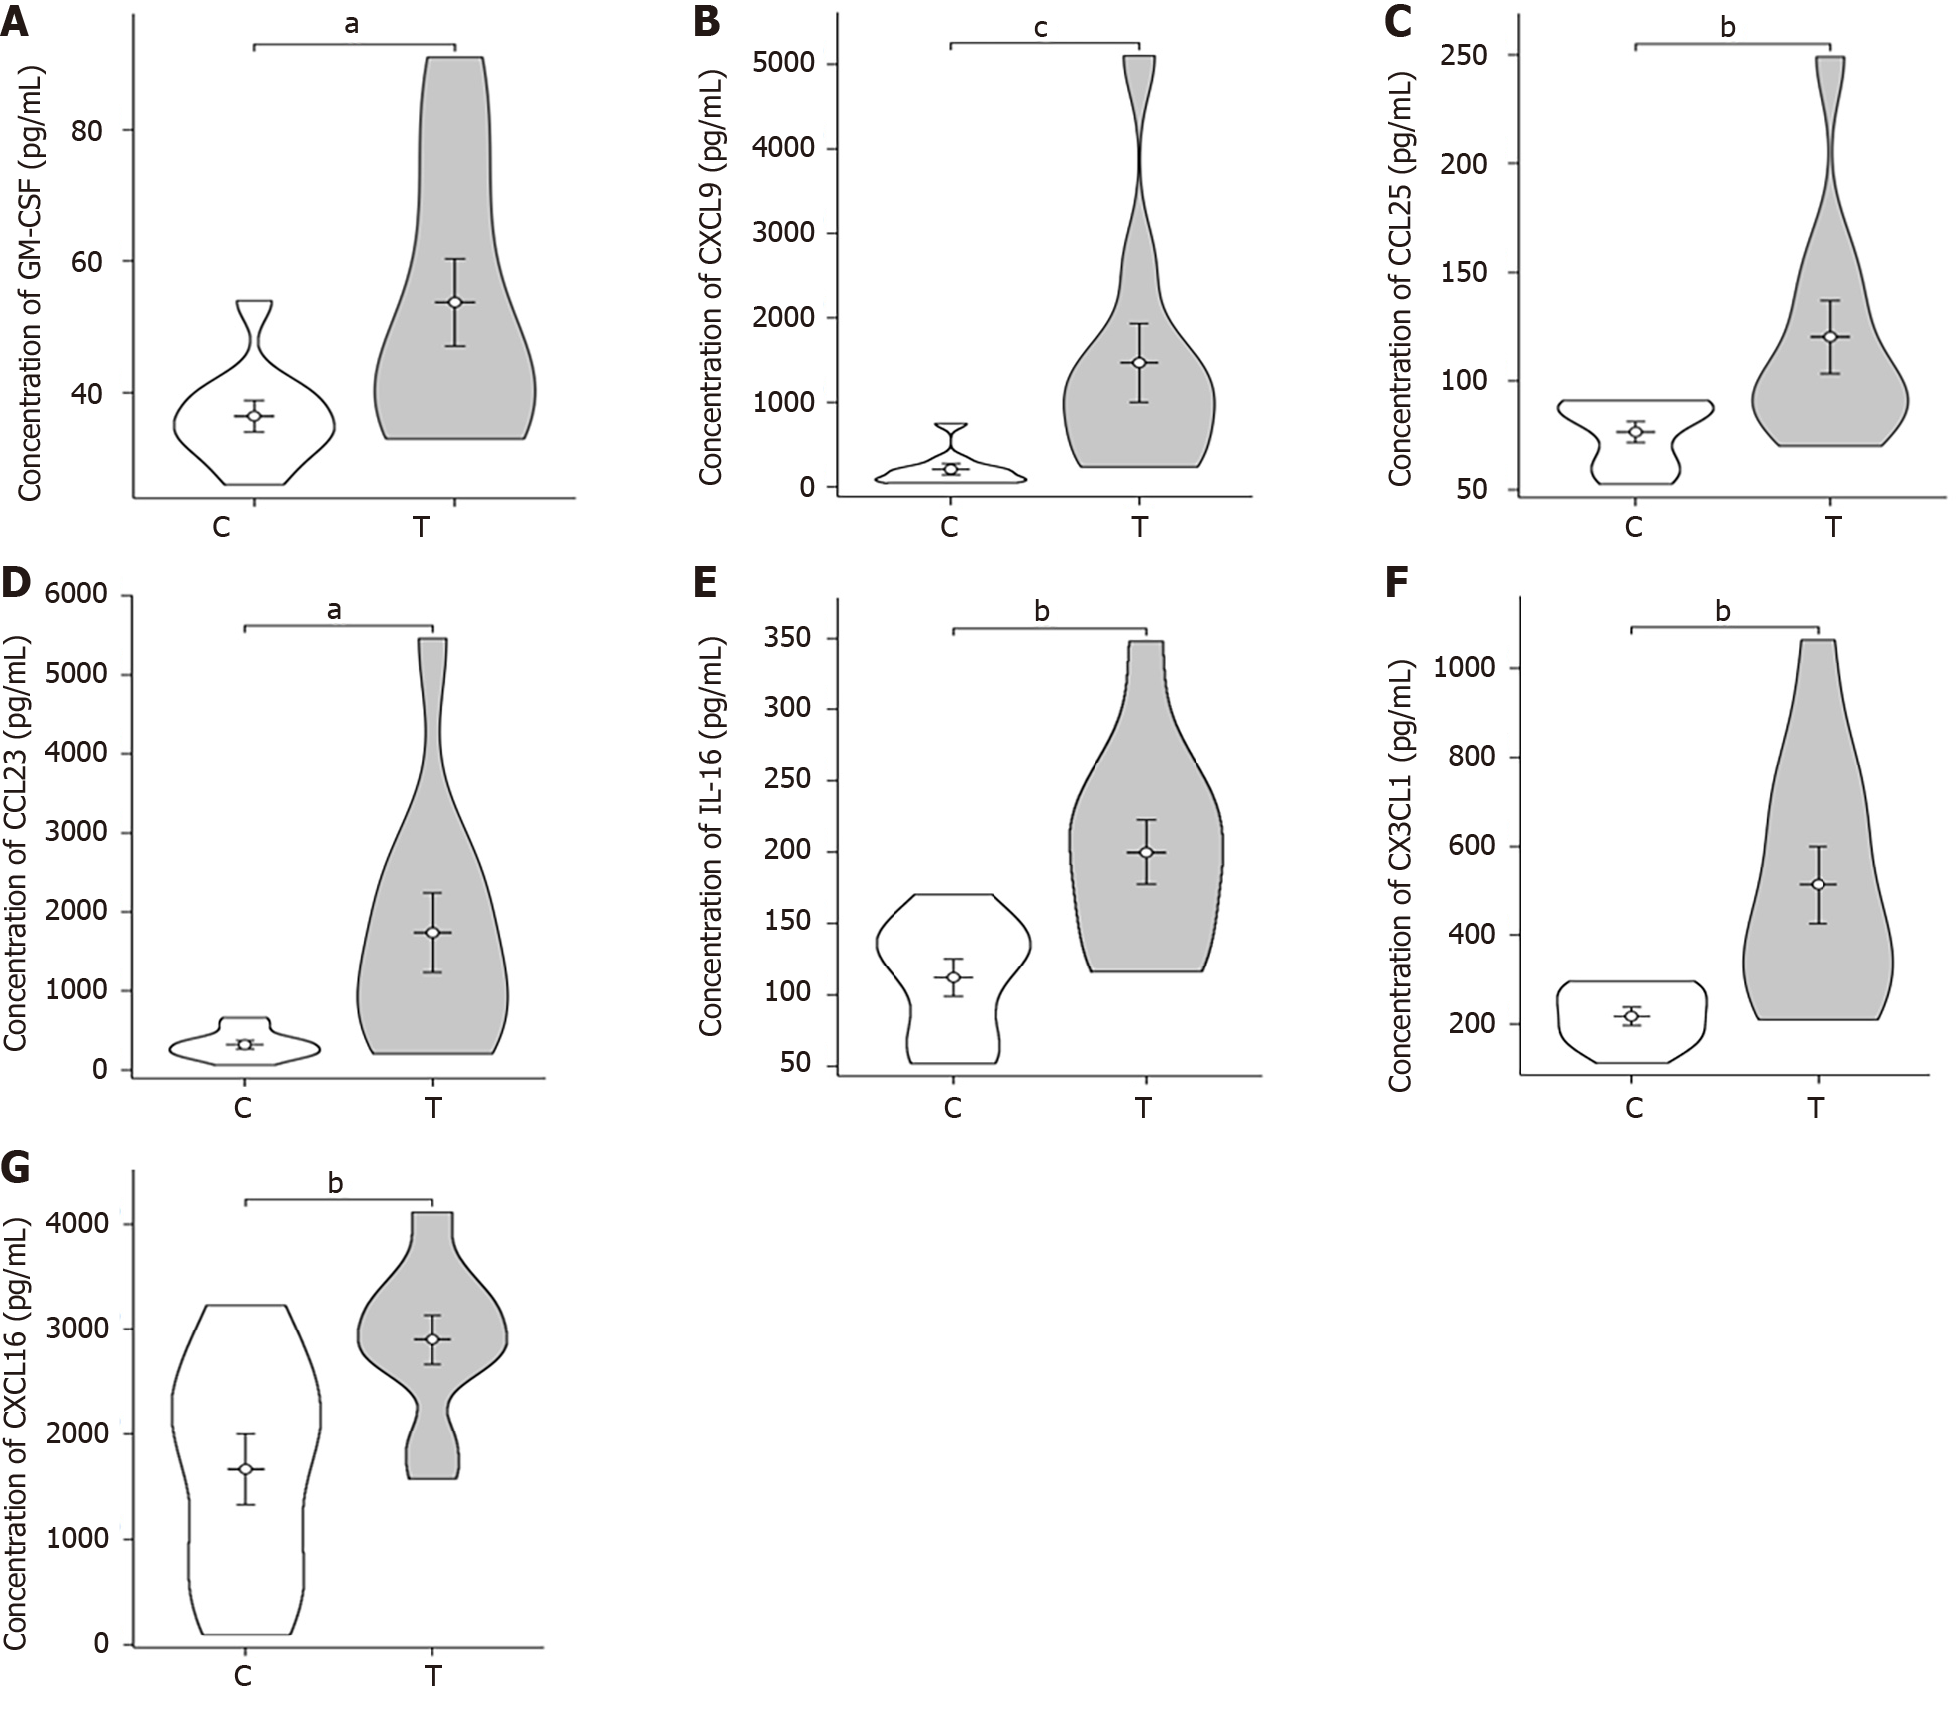
Violin plot: A violin plot is a method for visualizing continuous data. This plot combines the box plot and kernel density plot, providing similar information as the box plot, including the median (black line at the center of the violin), interquartile range (black bar at the center of the violin), and width of the violin representing the density of the dataset at that position. Lower/higher adjacent values (black bars) are defined as the first quartile (-1.5 iQR) and the third quartile (+1.5 iQR), respectively, and can be used for simple outlier detection.
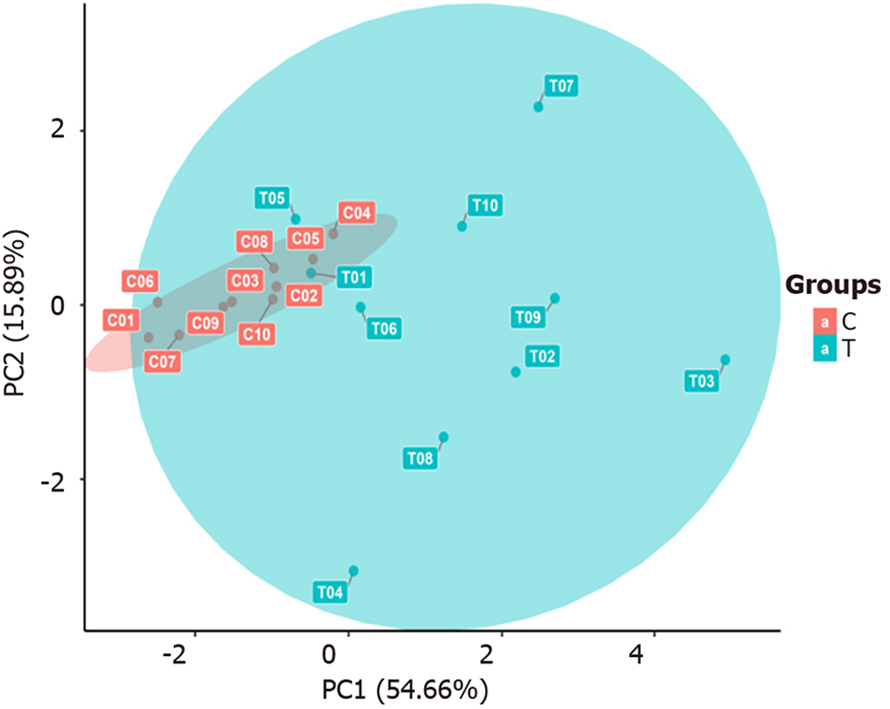
Principal component analysis: Principal component analysis (PCA) is a common multivariate statistical method used for dimensionality reduction. The method utilizes orthogonal transformation to obtain a set of linearly uncorrelated variables to replace the original variables, potentially revealing correlations. The resulting new variables are called principal components. This method can be used to visualize large sets of detected indicators, ultimately presenting the positions of various samples and groups through two-dimensional or three-dimensional coordinate plots, indicating similarities and differences between overall samples and groups.
Gene Ontology enrichment analysis: Gene Ontology (GO) functional analysis involves three aspects of biology: Cellular component (CC), molecular function (MF), and biological process (BP). The CC includes every part of the cell and its extracellular environment. MF refers to molecular-level activities such as catalysis or binding. BP can be defined in a broad and narrow sense and mainly refers to ordered combinations of one or more molecular functions. GO enrichment analysis categorizes and annotates different genes according to their functions.
KEGG enrichment analysis: KEGG enrichment analysis of differentially expressed proteins obtained from experiments can identify pathways with significant differences, providing clues for exploring biological regulatory pathways in subsequent experiments.
Quantitative data are expressed as the mean ± SD (x ± s). Significance analysis of microarray software was used for data analysis. Student's t tests were used to determine whether statistically significant differences existed between the observation group and the control group. A P value < 0.05 indicated statistical significance, P < 0.01 indicated statistical significance, and P > 0.05 indicated no statistical significance.
No statistically significant differences in age, sex (five males and five females in each group), height, or weight were noted between the observation and control groups (P > 0.05). However, significant differences were observed in the creatinine, PCT, and D-dimer levels (P < 0.05) as well as in the systolic blood pressure, white blood cell count, neutrophil ratio, alanine aminotransferase, and CRP level (P < 0.01), as shown in Table 1.
| General clinical data | Sepsis group (T) | Control group (C) | T value | P value |
| Number of cases | 10 | 10 | ||
| Age (years) | 83.10 ± 10.05 | 81.80 ± 9.39 | 0.334 | |
| Height (cm) | 163 ± 7.2 | 165.7 ± 9.07 | 0.4703 | |
| Weight (kg) | 60.4 ± 8.45 | 66.4 ± 12.5 | 0.2247 | |
| Systolic blood pressure (kPa) | 15.95 ± 2.2 | 19.64 ± 2.23 | 0.0016 | b |
| Diastolic pressure (kPa) | 9.93 ± 1.44 | 10.55 ± 1.76 | 0.4046 | |
| White blood cell count (109/L) | 15.1 ± 7.57 | 6.15 ± 1.44 | 0.0017 | b |
| Neutrophil percentage (%) | 88.11 ± 5.47 | 62.46 ± 5.99 | < 0.0001 | d |
| Platelet count (1012/L) | 162.3 ± 88.28 | 208.1 ± 41.68 | 0.1552 | |
| Alanine aminotransferase (U/L) | 100.94 ± 157.5 | 17.51 ± 7.77 | 0.1116 | b |
| Total bilirubin (μmol/L) | 24.08 ± 23.58 | 14.85 ± 7.23 | 0.2521 | |
| Creatinine (μmol/L) | 130.44 ± 76.68 | 70.84 ± 13.26 | 0.0262 | a |
| C-reactive protein (mg/L) | 141 ± 63.09 | 1.54 ± 1.15 | < 0.0001 | d |
| Procalcitonin (ng/mL) | 14.51 ± 16.96 | 0.04 ± 0.01 | 0.0147 | a |
| D-dimer (ng/mL) | 12.88 ± 27.55 | 0.55 ± 0.55 | 0.1742 | a |
The original fluorescence values obtained from the detection samples were substituted into the standard curve formula to obtain the concentration of each sample for subsequent data analysis and intergroup comparison. The concentrations of the samples are detailed in Table 2.
| No. | Cytokine | Sepsis group (T) | Control group (C) | T value | P value |
| 1 | 6Ckine_CCL21 | 22115.55 ± 5190.13 | 19744.73 ± 3054.24 | 0.26 | |
| 2 | BCA-1_CXCL13 | 69.83 ± 23.97 | 73.73 ± 130.56 | 0.93 | |
| 3 | CTACK_CCL27 | 779.84 ± 438.20 | 529.79 ± 199.55 | 0.14 | |
| 4 | ENa-78_CXCL5 | 2999.36 ± 3172.84 | 939.51 ± 182.15 | 0.08 | |
| 5 | EOtaxin-2_CCL24 | 29.51 ± 13.71 | 45.68 ± 20.90 | 0.07 | |
| 6 | EOtaxin-3_CCL26 | 104.94 ± 53.77 | 78.45 ± 16.06 | 0.19 | |
| 7 | Eotaxin_CCL11 | 76.63 ± 38.25 | 83.49 ± 33.94 | 0.69 | |
| 8 | Fractalkine_CX3CL1 | 302.24 ± 163.08 | 118.26 ± 36.84 | 0.01 | a |
| 9 | GCP-2_CXCL6 | 54.87 ± 39.74 | 36.08 ± 19.61 | 0.23 | |
| 10 | GM-CSF | 27.55 ± 10.48 | 18.01 ± 4.52 | 0.03 | a |
| 11 | Gro minus a_CXCL1 | 396.70 ± 471.60 | 217.92 ± 29.77 | 0.29 | |
| 12 | Gro-b_CXCL2 | 79.72 ± 52.39 | 116.70 ± 76.76 | 0.25 | |
| 13 | I-309_Ccl1 | 68.07 ± 22.17 | 51.49 ± 8.77 | 0.06 | |
| 14 | I-TAC_CXCL11 | 98.14 ± 95.41 | 63.55 ± 17.94 | 0.31 | |
| 15 | IFN-g | 64.52 ± 73.72 | 20.94 ± 6.25 | 0.11 | |
| 16 | IL-10 | 84.44 ± 192.83 | 6.03 ± 1.30 | 0.25 | |
| 17 | IL-16 | 315.86 ± 100.55 | 179.71 ± 64.95 | 0.00 | c |
| 18 | IL-1B | 5.53 ± 3.89 | 2.81 ± 0.55 | 0.07 | |
| 19 | IL-2 | 16.03 ± 25.31 | 6.37 ± 7.86 | 0.23 | |
| 20 | IL-4 | 56.53 ± 18.81 | 53.53 ± 19.02 | 0.74 | |
| 21 | IL-6 | 3575.78 ± 7581.85 | 14.27 ± 15.51 | 0.19 | |
| 22 | IL-8_CXCL8 | 704.18 ± 1779.37 | 13.77 ± 12.44 | 0.27 | |
| 23 | IP-10_CXcl10 | 488.38 ± 687.30 | 120.44 ± 50.64 | 0.14 | |
| 24 | McP-1_CCL2 | 342.19 ± 565.76 | 60.92 ± 13.31 | 0.17 | |
| 25 | McP-2_CCL8 | 20.41 ± 14.52 | 12.89 ± 6.68 | 0.18 | |
| 26 | McP-3_CCL7 | 181.11 ± 91.81 | 139.20 ± 68.38 | 0.29 | |
| 27 | McP-4_CCL13 | 51.51 ± 54.87 | 45.39 ± 15.85 | 0.75 | |
| 28 | MDC_CL22 | 205.13 ± 104.45 | 252.88 ± 157.92 | 0.46 | |
| 29 | MIF | 4255.04 ± 3872.22 | 4984.17 ± 2222.53 | 0.63 | |
| 30 | MIG_CXCL9 | 475.39 ± 420.47 | 96.37 ± 68.50 | 0.02 | a |
| 31 | MIP-1a_CL3 | 35.18 ± 41.11 | 8.40 ± 3.46 | 0.08 | |
| 32 | MIP-1delta_CCL15 | 2399.60 ± 816.60 | 1986.99 ± 836.93 | 0.30 | |
| 33 | MIP-3A_CCL20 | 245.17 ± 606.30 | 6.20 ± 3.72 | 0.27 | |
| 34 | MIP-3b_CCL19 | 411.58 ± 234.76 | 244.49 ± 92.84 | 0.07 | |
| 35 | MpIF-1 CCL23 | 748.86 ± 663.34 | 161.30 ± 70.52 | 0.03 | a |
| 36 | SCYB16_CXCL16 | 594.64 ± 146.81 | 345.80 ± 198.26 | 0.01 | b |
| 37 | Sdf-1a +b_CXCL12 | 2201.58 ± 418.86 | 1853.09 ± 765.81 | 0.25 | |
| 38 | Tarc CL17 | 12.65 ± 14.57 | 21.31 ± 28.89 | 0.43 | |
| 39 | TECK_CCL25 | 1541.17 ± 697.26 | 931.70 ± 204.77 | 0.03 | a |
| 40 | TNF-α | 222.08 ± 272.34 | 71.74 ± 21.85 | 0.13 |
Heatmap analysis: As shown in Figures 1 and 2, interleukin (IL)-16, granulocyte-macrophage colony-stimulating factor (GM-CSF), CX3CL1, CXCL9, CXCL16, CCL25, and CCL23 were highly expressed in the sepsis group, with CXCL9, CCL25, and CCL23 exhibiting particularly high levels. In contrast, IL-16, GM-CSF, CX3CL1, CXCL9, CXCL16, CCL25, and CCL23 were expressed at low levels in the control group.
Violin plot: The violin plot (Figure 3) compares the sepsis group with the control group, revealing significant differences (P values between 0.01 and 0.05) in GM-CSF, CXCL9, CCL25, and CCL23 Levels. Furthermore, IL-16, CX3CL1, and CXCL16 exhibited highly significant differences (P values between 0.001 and 0.01).
PCA: As shown in Figure 4, the samples within each group clustered closely together and were significantly separated from the samples in the other groups, indicating that the intragroup differences were smaller than the intergroup differences. This suggests that the differentially selected substances can effectively distinguish between different comparison groups, which is ideal. However, actual clinical sample analysis results may be affected by factors such as individual differences and sample size, thereby facilitating the analysis of the actual overall situation of each comparison group and different samples.
GO enrichment analysis: To further analyze significantly differentially expressed cytokines, GO enrichment analysis was conducted using R/Bioconductor. Figure 5 shows that the differentially expressed cytokines, including IL-16, GM-CSF, CX3CL1, CXCL9, CXCL16, CCL25, and CCL23, in sepsis patients mainly participate in molecular functions and biological processes.
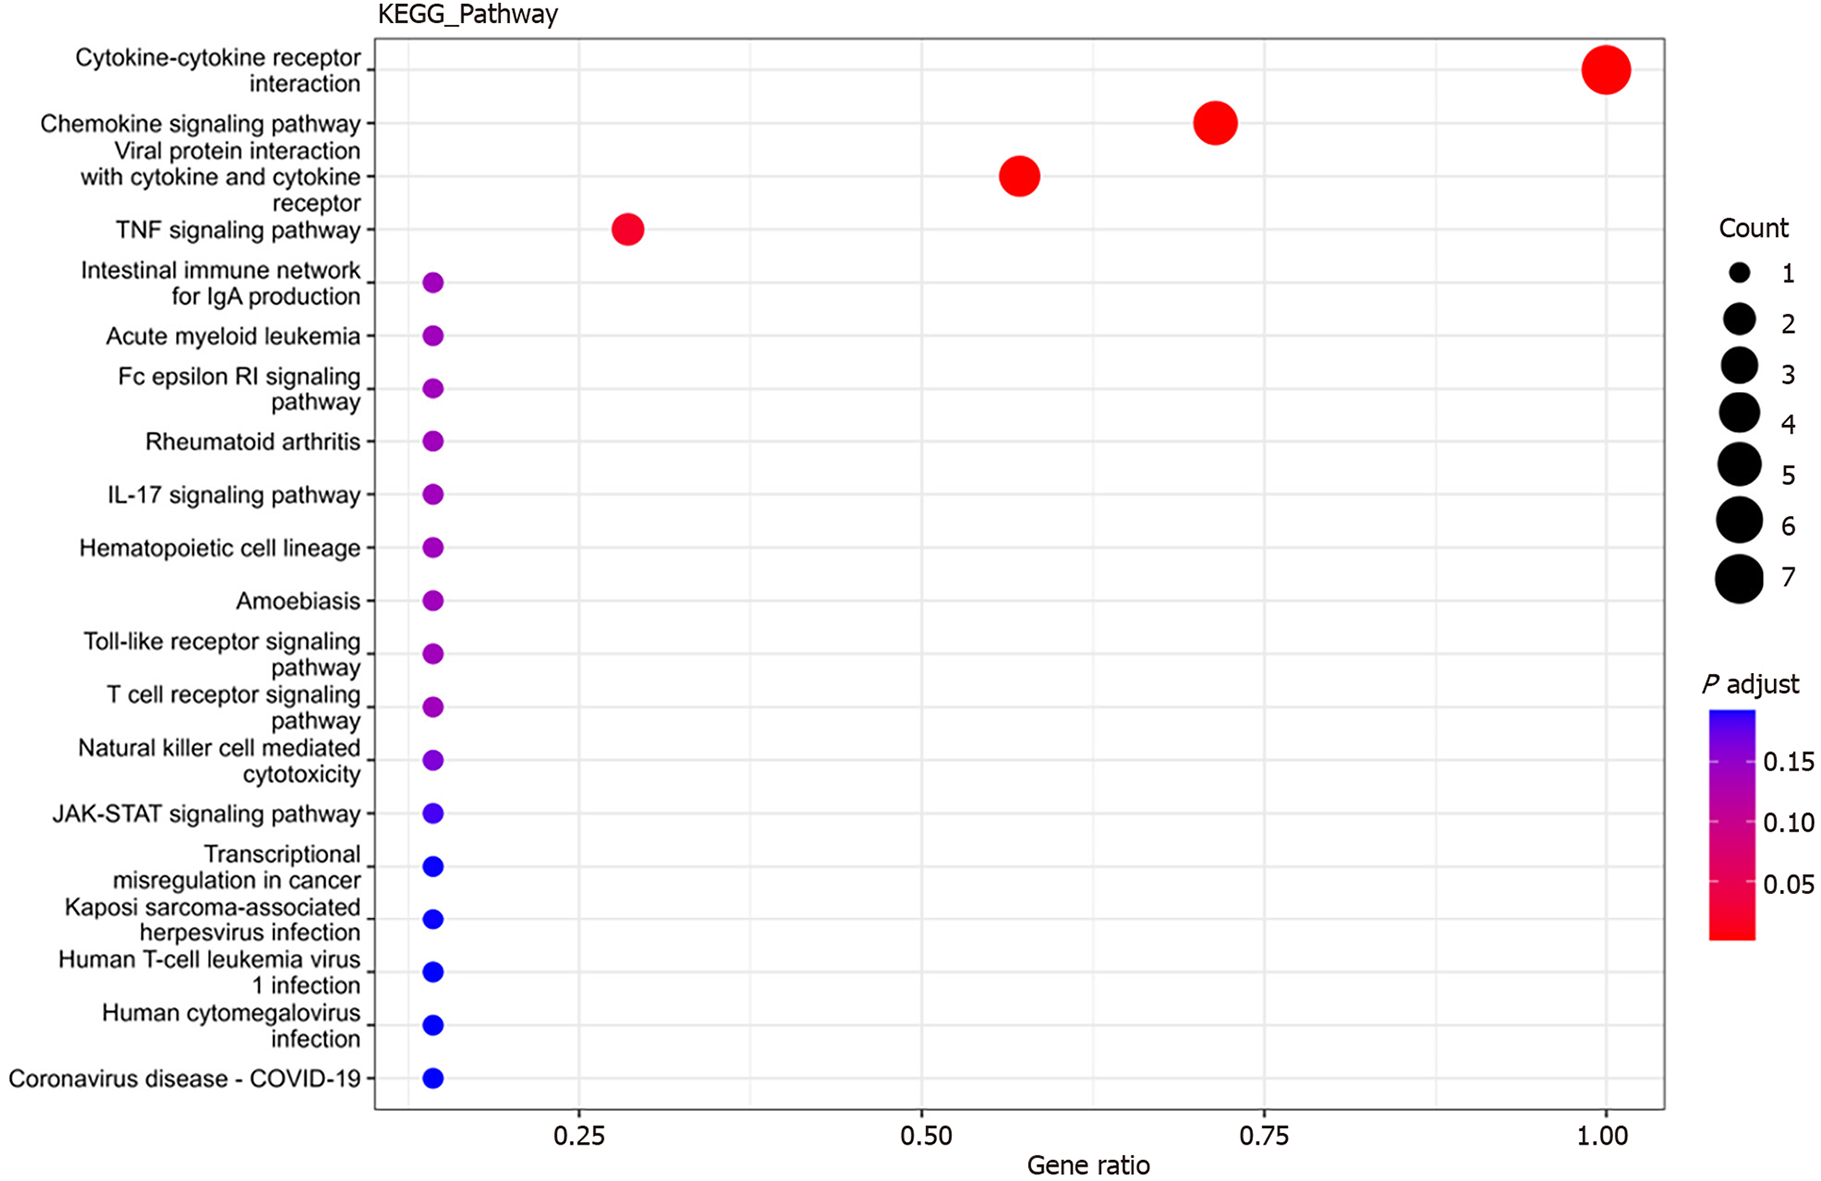
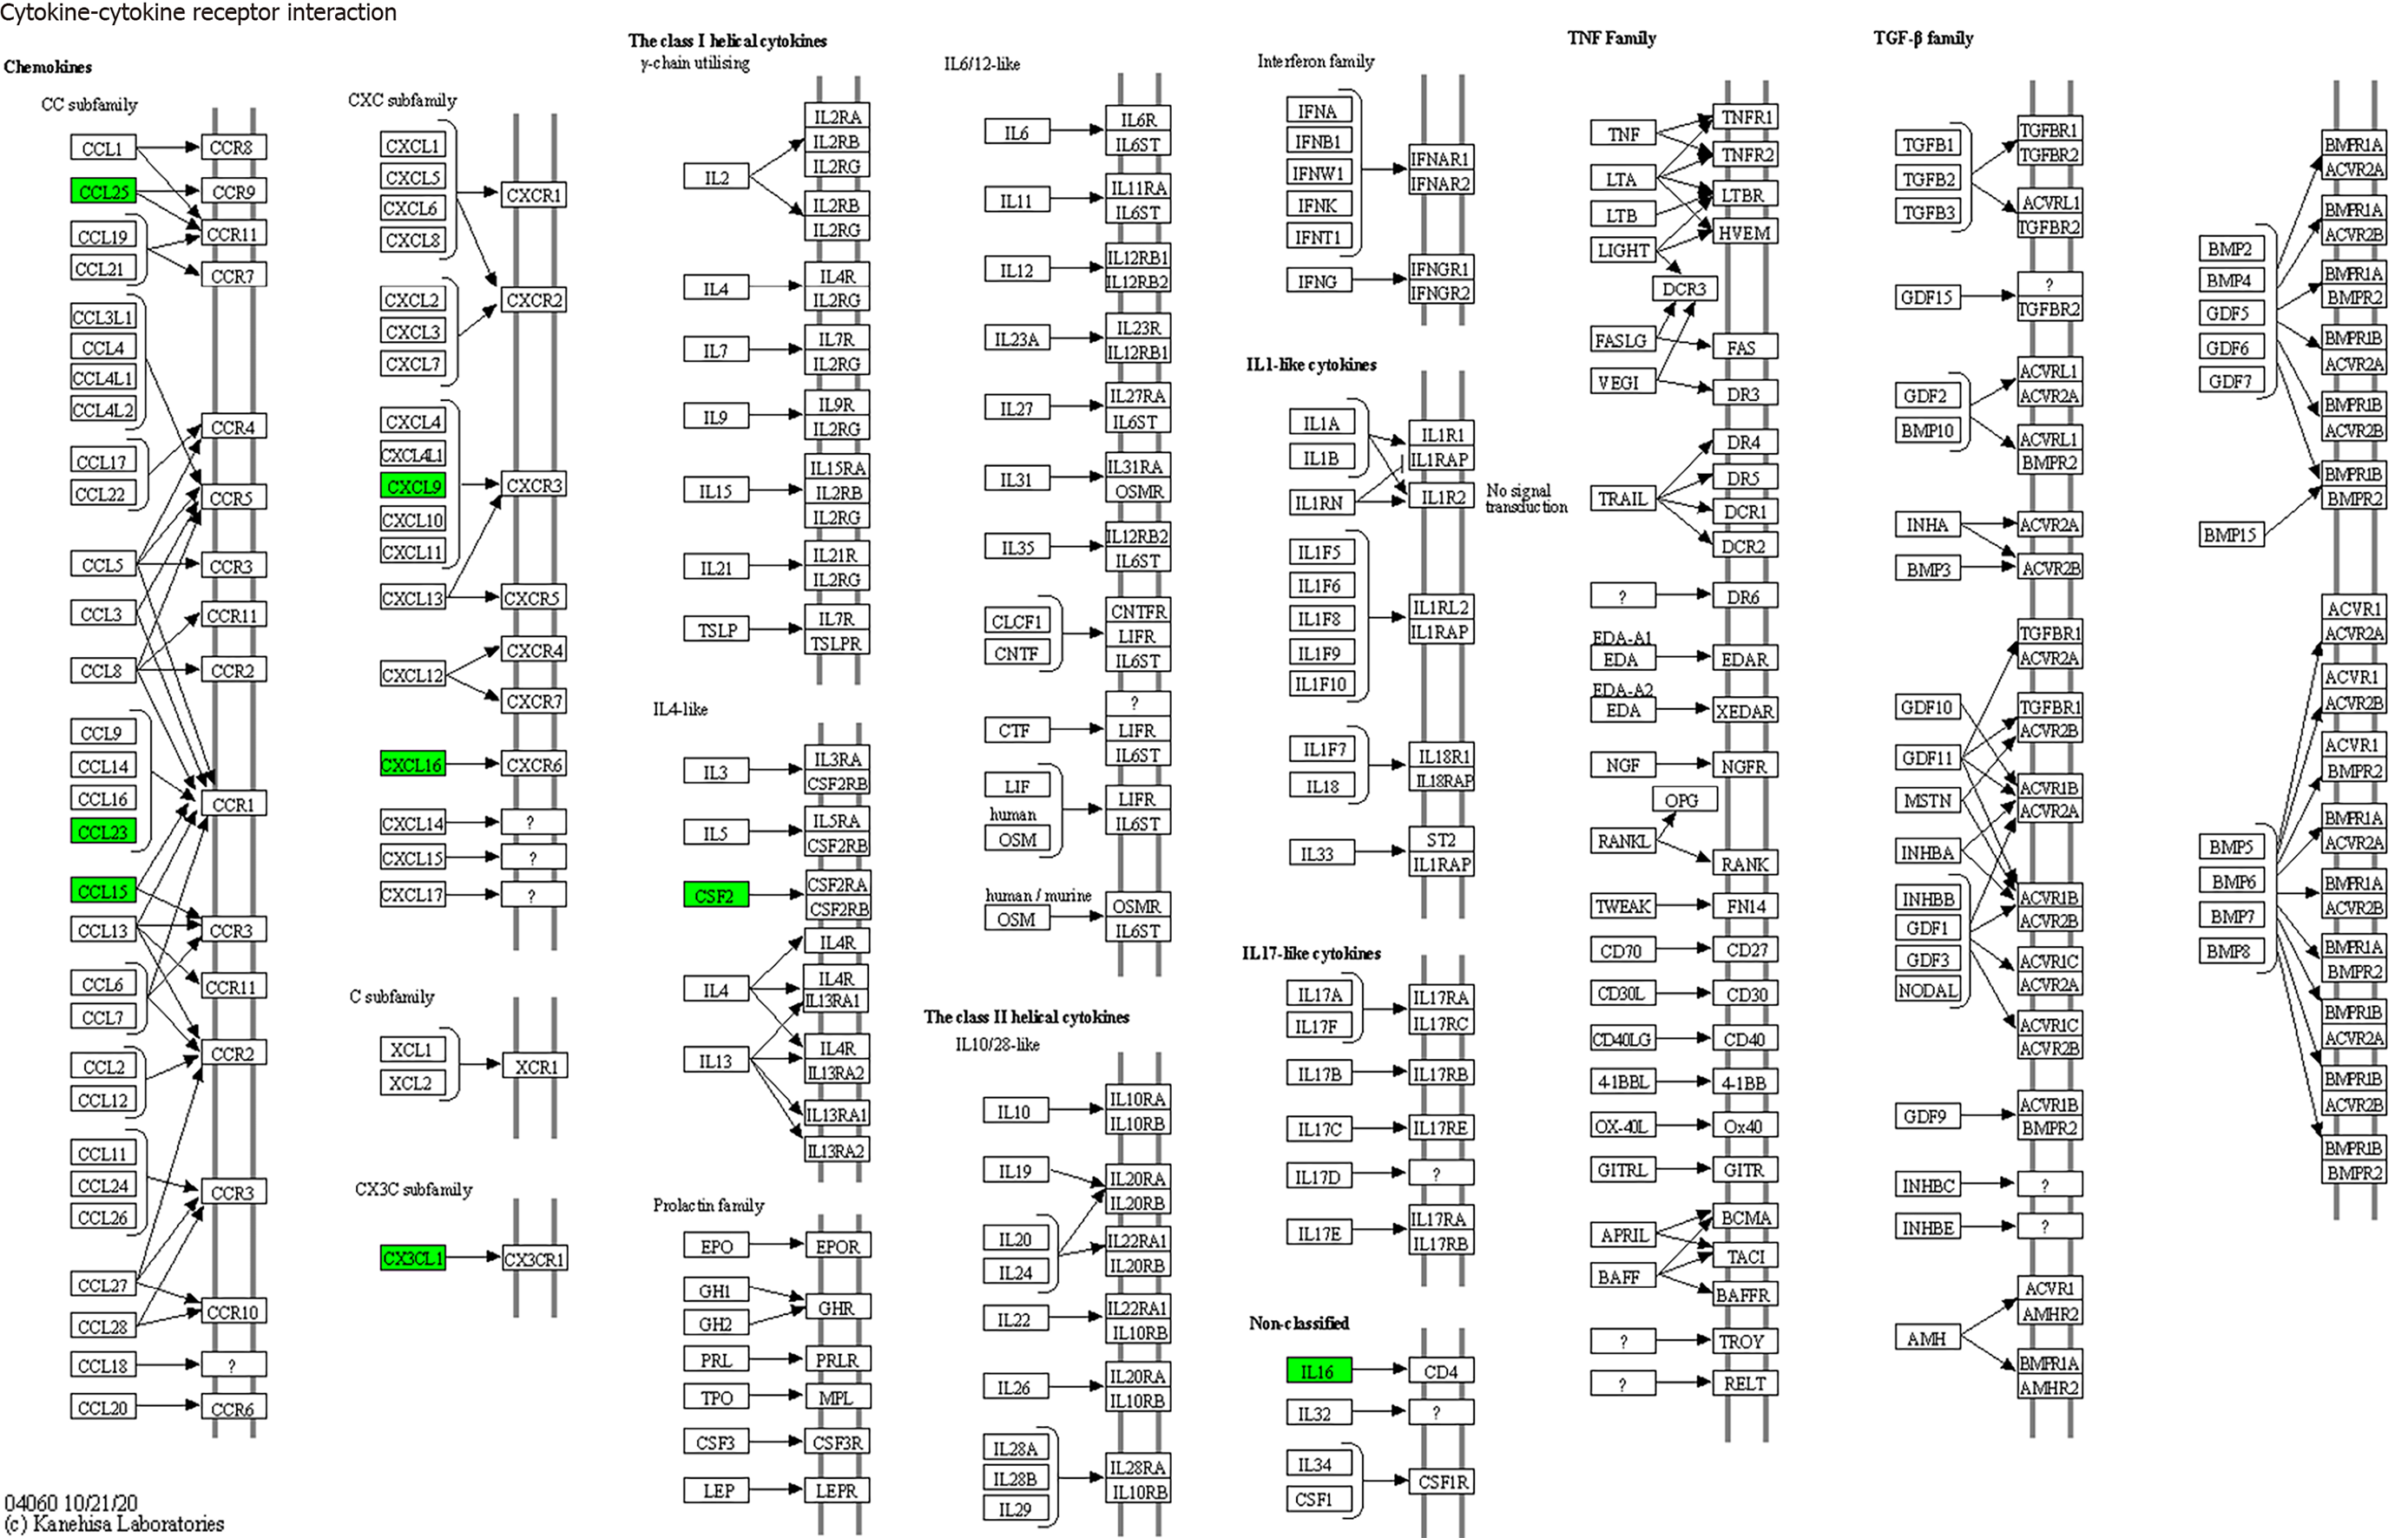
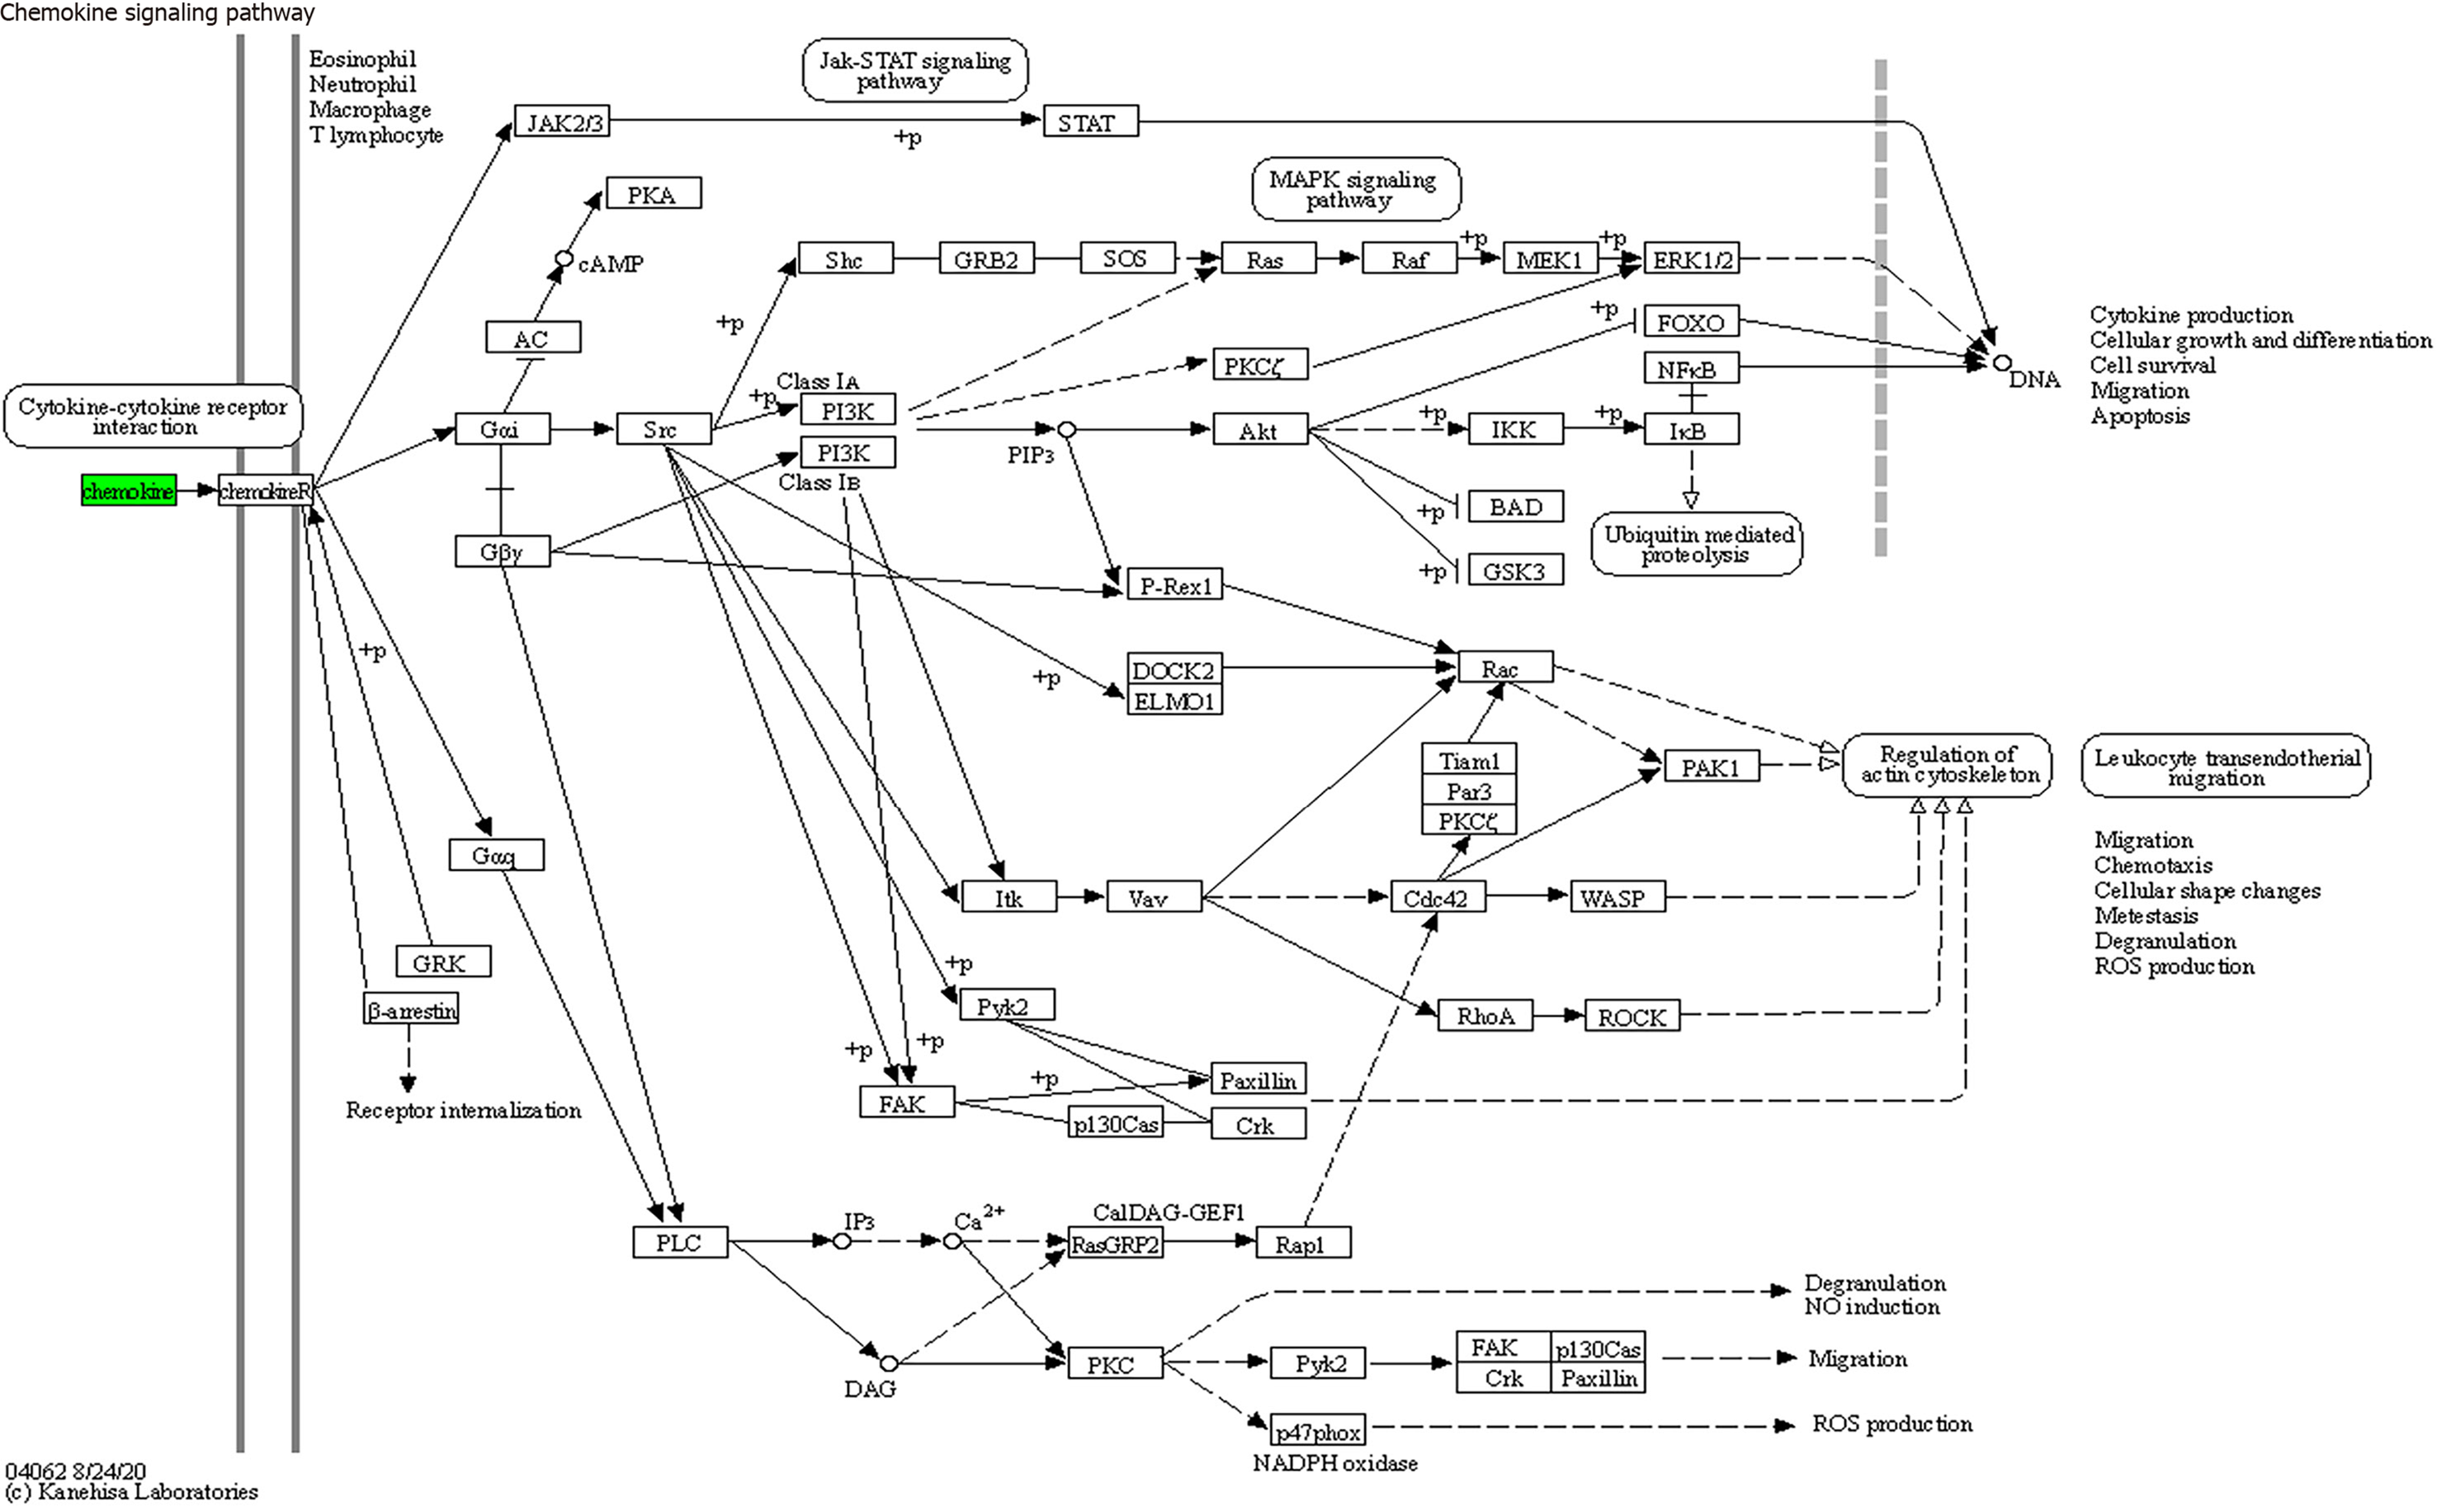
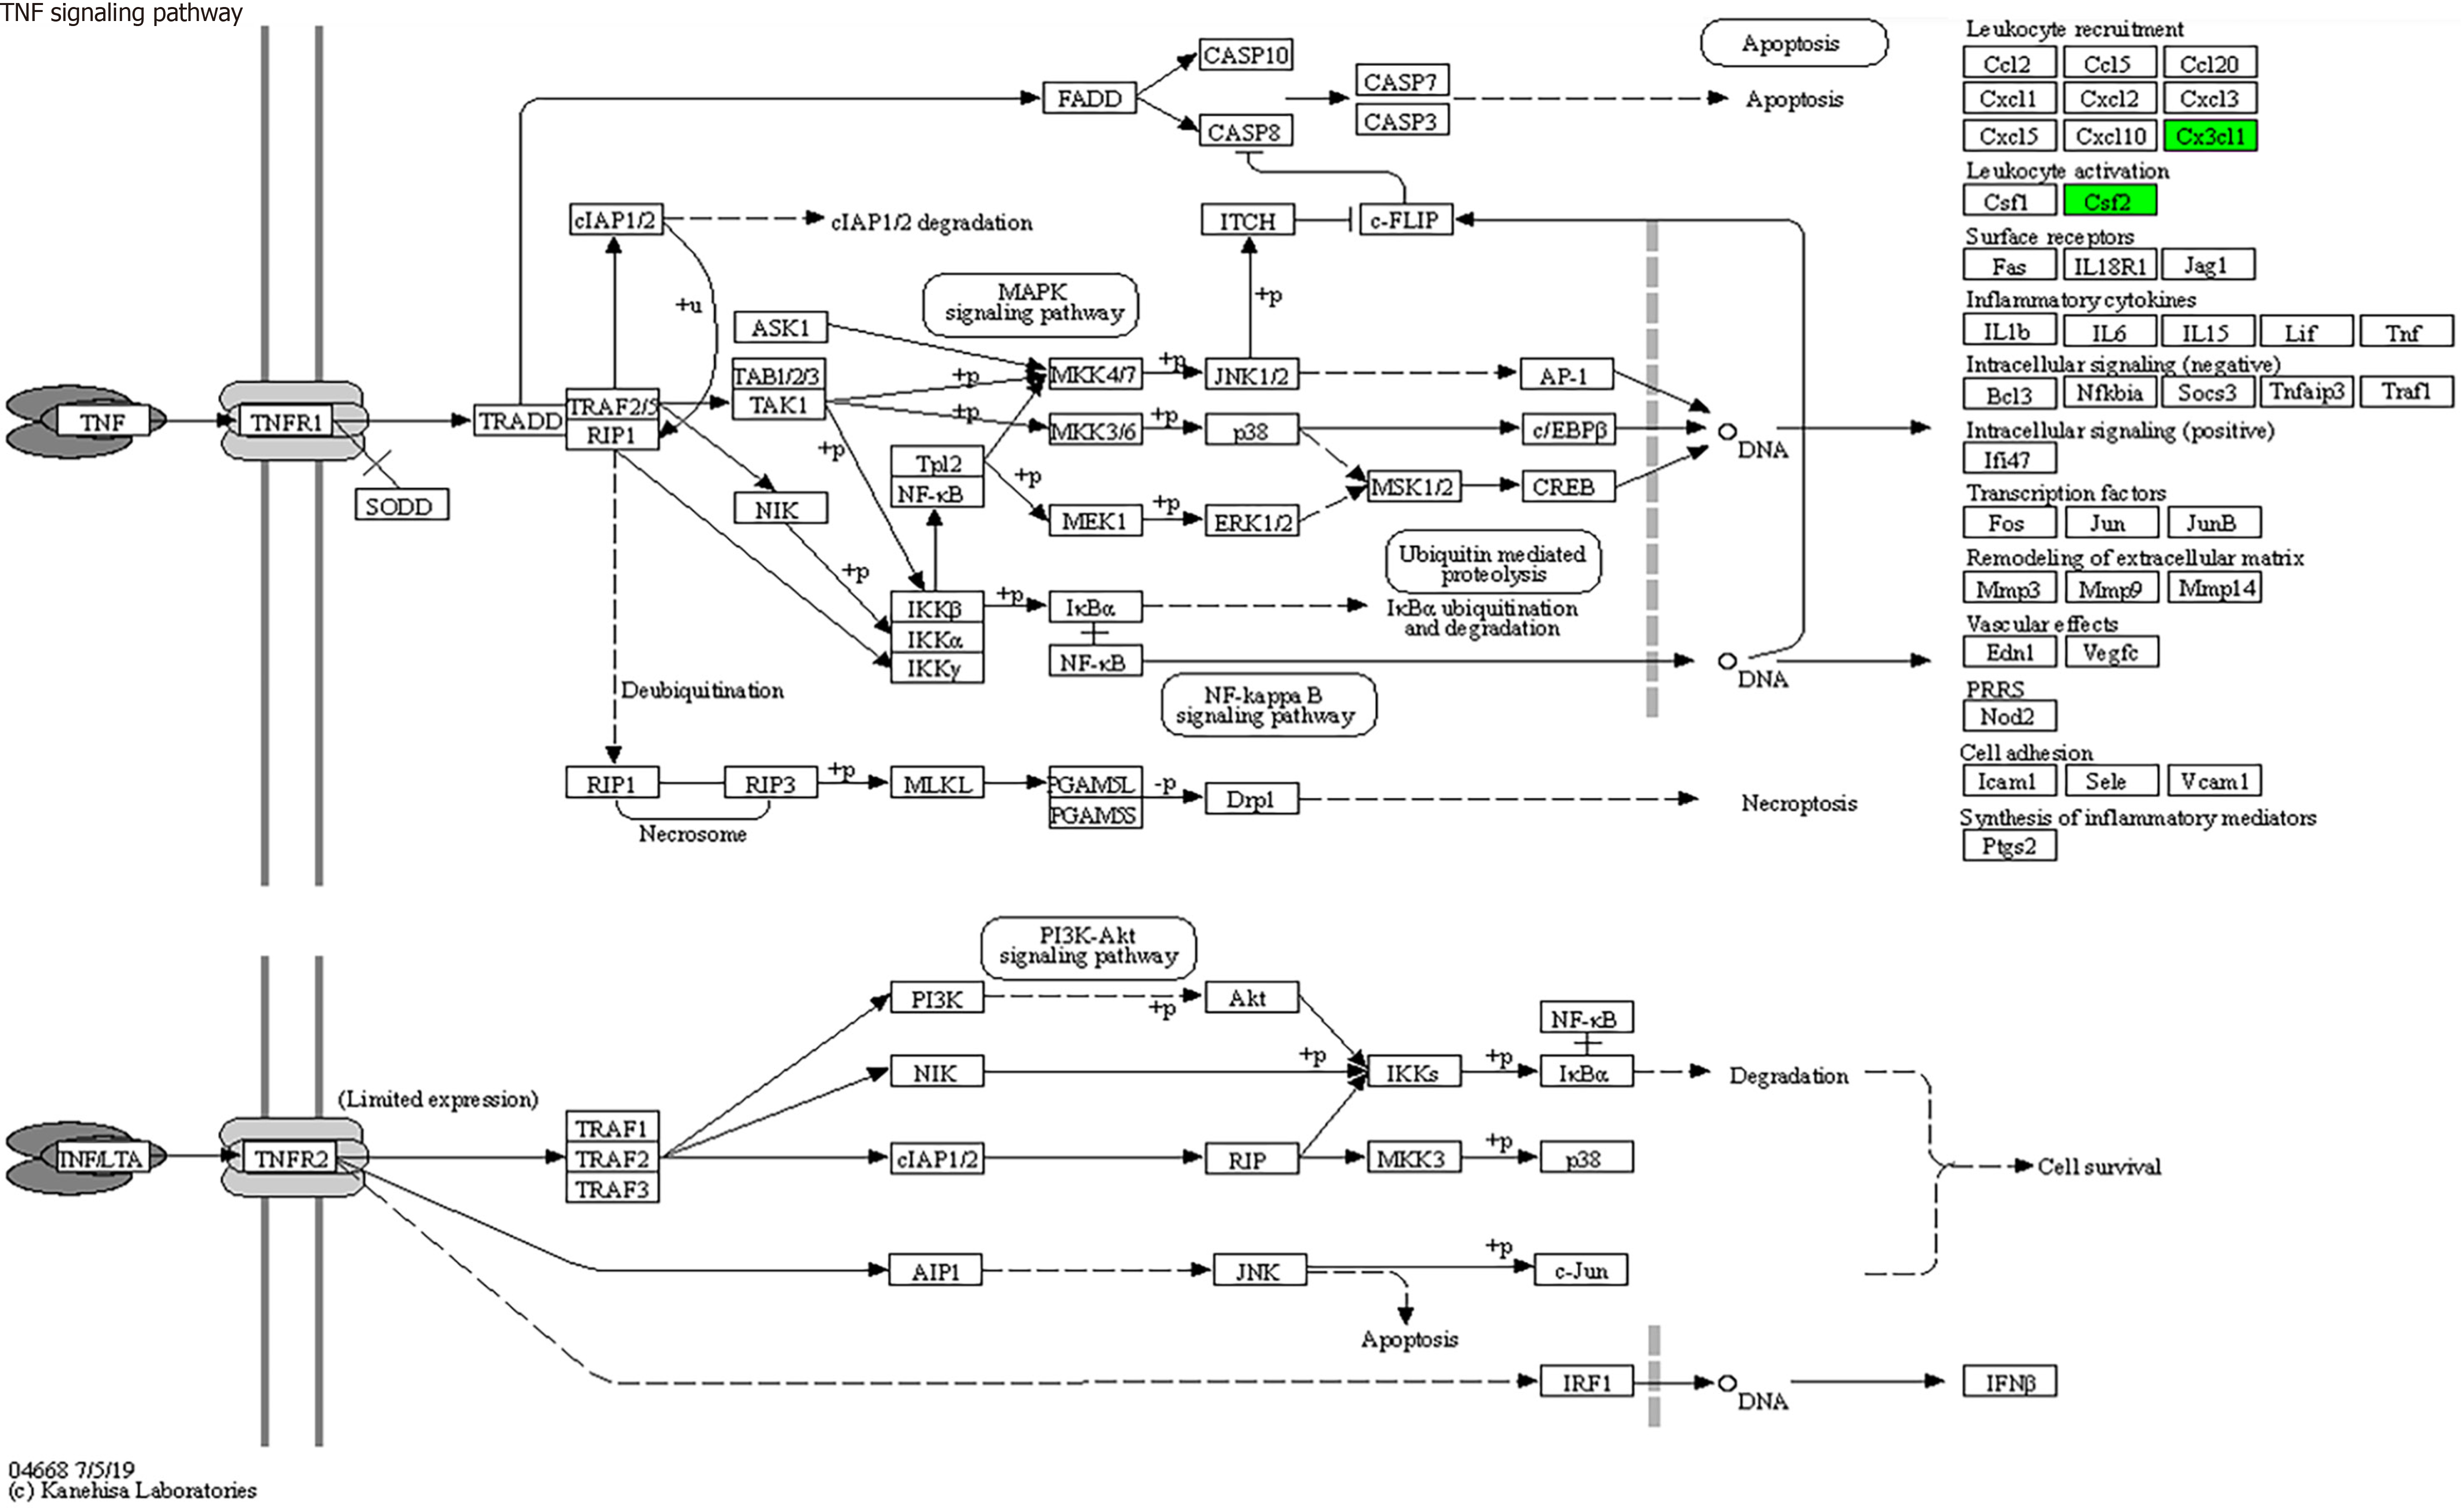
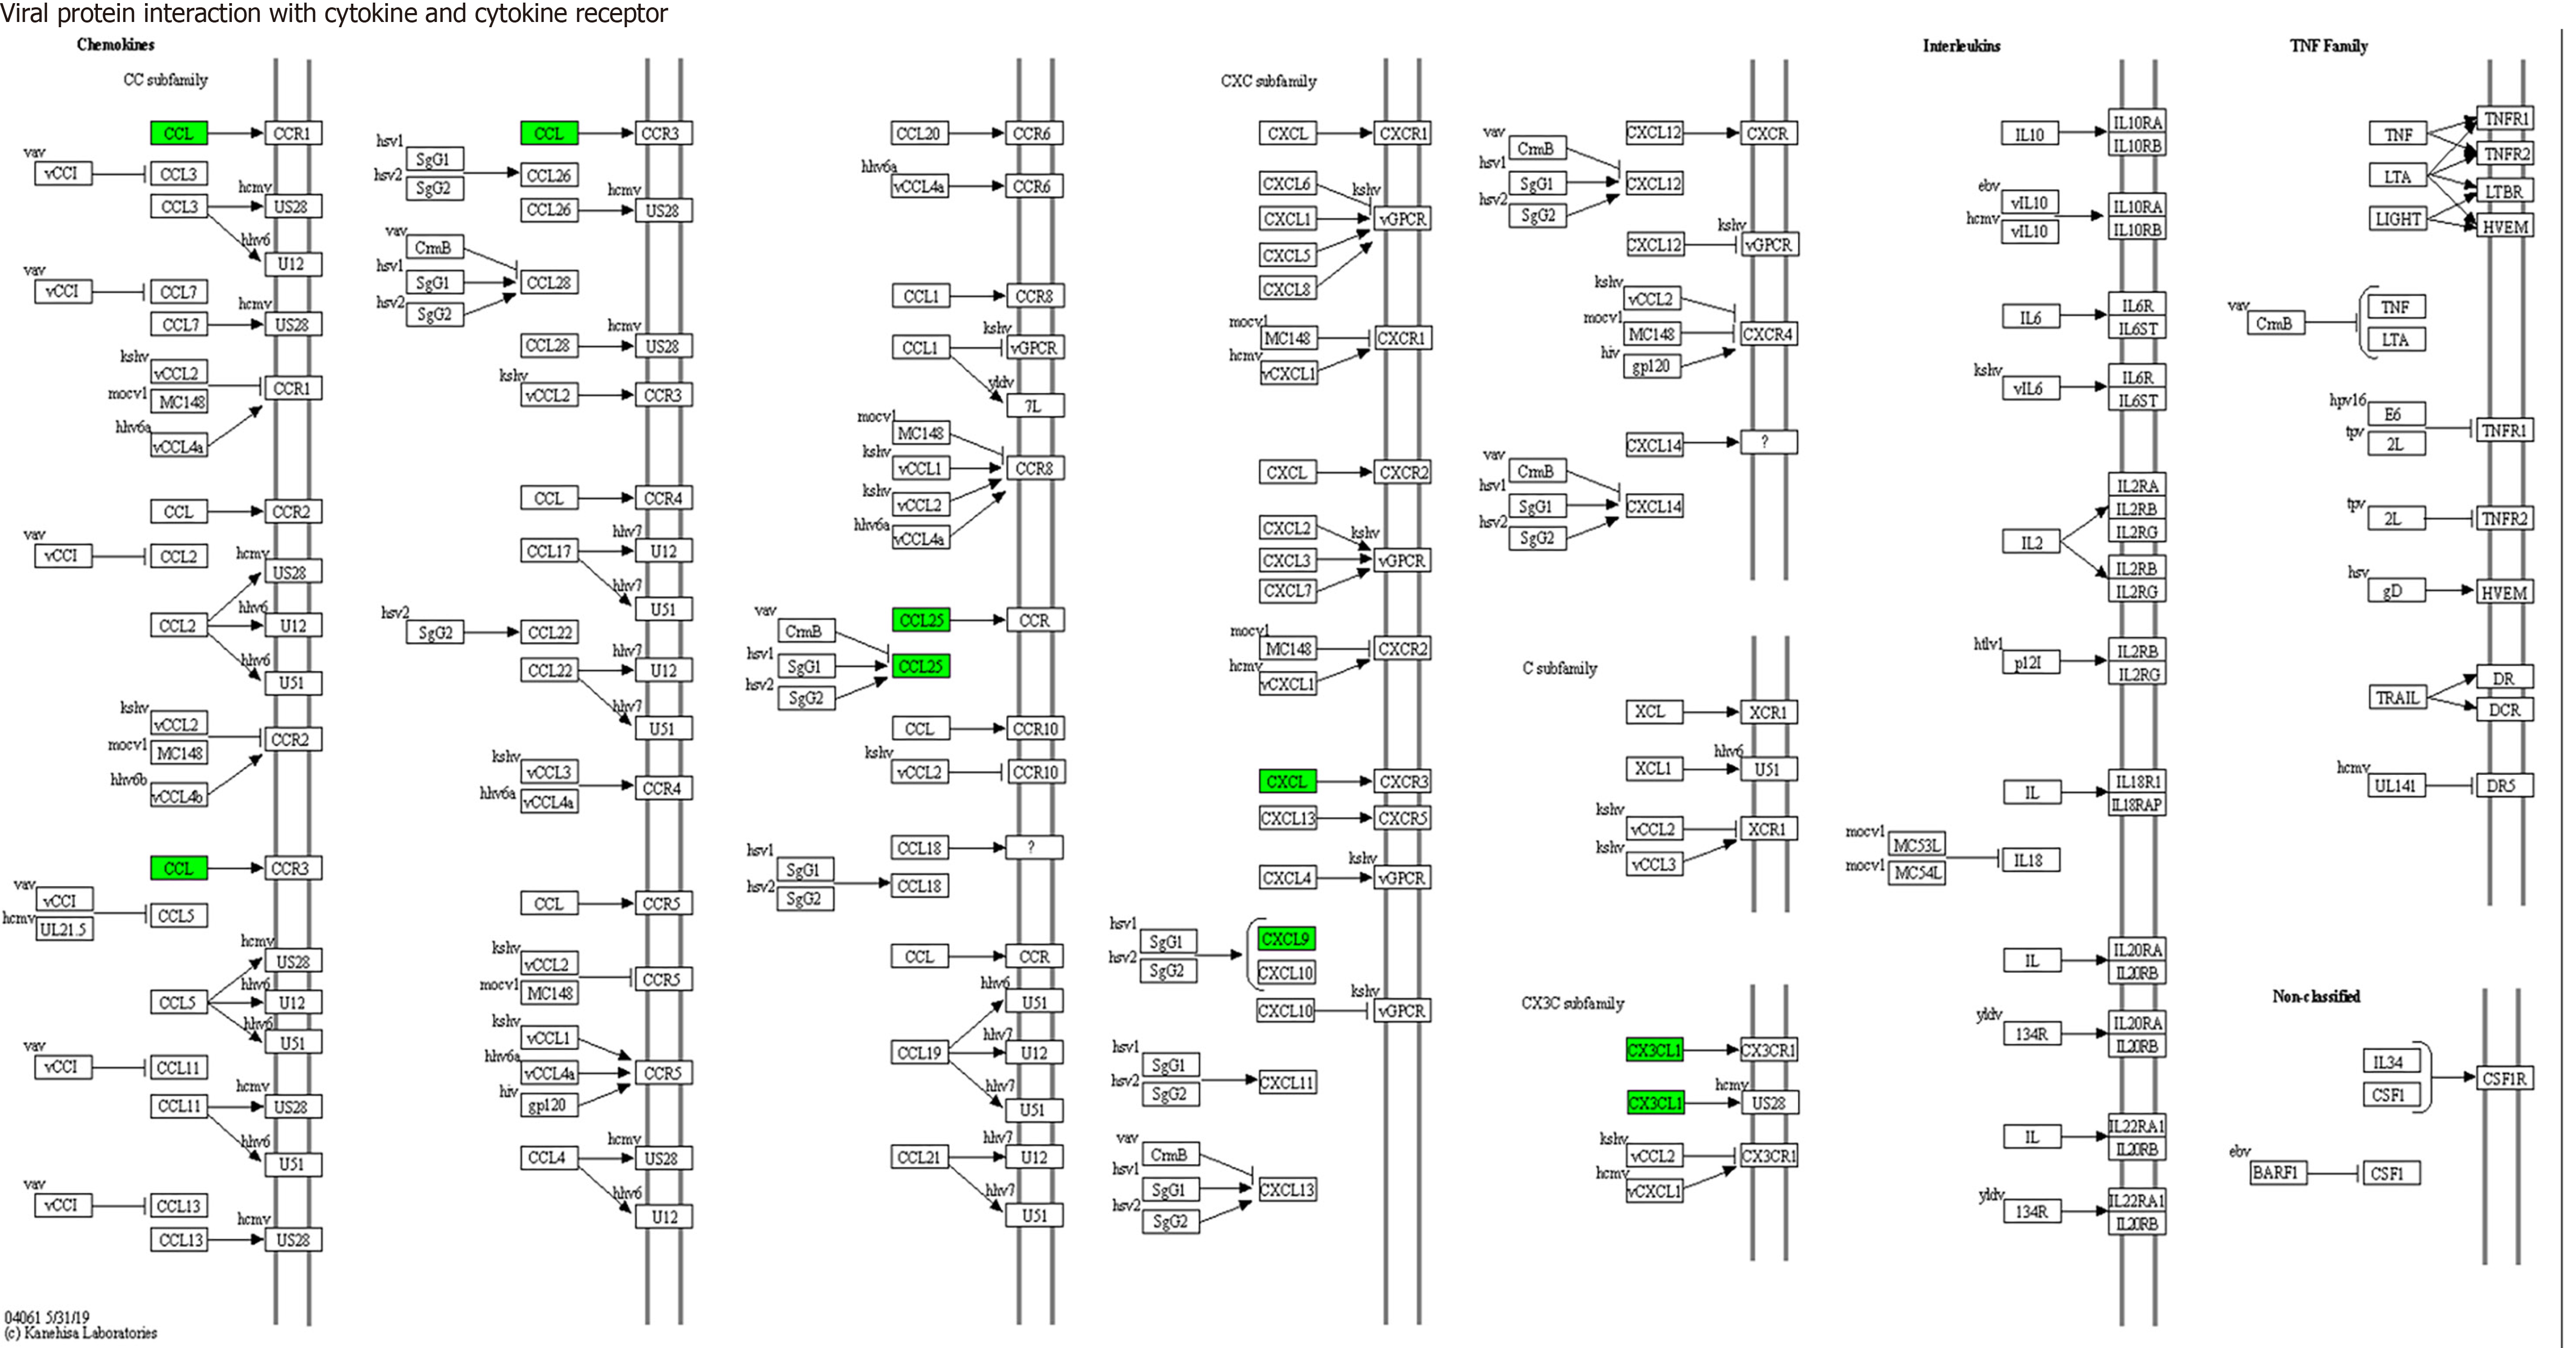
KEGG enrichment analysis: Significantly differentially expressed cytokines were selected for KEGG analysis using R/Bioconductor. Figure 6 shows that the differentially expressed cytokines mainly participate in cytokine cytokine receptor interactions (including IL-16, GM-CSF, CX3CL1, CXCL9, CXCL16, CCL25 and CCL23) (Figure 7), chemokine signaling pathways (including CX3CL1, CXCL9, CXCL16, CCL25, and CCL23) (Figure 8), tumor necrosis factor signaling pathways (including GM-CSF and CX3CL1) (Figure 9), and viral protein interactions with cytokines and cytokine receptors (mainly including CX3CL1, CXCL9, and CCL25) (Figure 10).
Currently, dozens of cytokines, each of which possesses unique and predominantly active biological activity, have been discovered and formally named. Despite their diverse types, varied cellular origins and targets, broad biological activities, and differing mechanisms of action, numerous cytokines share common characteristics. For instance, cells in a resting or quiescent state must be activated before synthesizing and secreting cytokines. In addition, cytokines need to bind specifically to high-affinity receptors on target cells to exert their biological effects, and most natural cytokines act on themselves or adjacent target cells through autocrine or paracrine mechanisms.
In this study, we utilized the Bio-Plex Pro™ Human Chemokine Panel 40-plex (Bio-Rad Laboratories, Inc., CA, United States) on the Luminex 200 system (Luminex Corporation, Austin, TX, United States) platform to detect 40 cytokines in the plasma of sepsis and nonsepsis patients. We identified seven differentially expressed cytokines that were significantly elevated in the plasma of sepsis patients, namely, IL-16, GM-CSF, CX3CL1, CXCL9, CXCL16, CCL25, and CCL23.
IL-16 is a secreted glycoprotein primarily produced by CD8+ T lymphocytes. It binds specifically to receptors on CD4+ cells, inducing the migration and activation of CD4+ lymphocytes, monocytes, and eosinophils[13]. Additionally, IL-16 promotes IL-2R expression on CD4+ lymphocytes, thereby stimulating lymphocyte proliferation[13,14]. IL-16 also induces the aggregation, activation, and proliferation of CD8+ T cells[15]. Studies have revealed significantly elevated IL-16 levels in septic patients compared to nonseptic individuals[15,16]. Zhang et al[16] discovered that IL-16 serves as a target gene for microRNA-96, and the serum levels of these genes are negatively correlated with each other. These findings suggest that reduced serum miR-96 levels could serve as a noninvasive biomarker for diagnosing neonatal sepsis[16]. Our research also revealed significantly increased IL-16 levels in septic patients than in nonseptic patients, consistent with the literature[16,17].
GM-CSF, a member of the CSF superfamily, is primarily generated by lymphocytes and natural lymphoid-like cells. Peripheral blood GM-CSF produced by CD4+ T cells has been identified as a marker for the severity of sepsis in patients[18]. Our study corroborates previous findings by identifying high GM-CSF levels in the plasma of septic patients[19]. The impact of GM-CSF on the body is multifaceted. Although GM-CSF serves as a cytokine in normal inflammatory responses, regulating immune reactions and aiding pathogen clearance[20], excessive expression by lymphocytes may trigger a cytokine storm, leading to multiple organ dysfunction syndrome and potential fatality[19]. Consequently, various clinical strategies are employed. For example, exogenous GM-CSF supplementation is utilized for neutropenia caused by chemotherapy-induced bone marrow suppression[21]. Conversely, GM-CSF inhibitors are administered for cytokine storms associated with sepsis, representing a promising novel therapeutic approach to mitigate the excessive cytokine influx observed at infection sites and its ensuing catastrophic consequences[19].
CX3CL1 is a transmembrane glycoprotein comprising 373 amino acids and is the sole member of the CX3C chemokine family. It is predominantly expressed in endothelial cells, lymphocytes, epithelial cells, and neurons. CX3CL1 exclusively binds to CX3CR1 receptors, actively participating in processes such as the chemotactic inflammatory response, directional movement, immune response, tissue repair, and tumor formation. The binding of CX3CL1 and CX3CR1 induces chemotactic effects, recruiting monocytes, macrophages, natural killer cells, effector T cells, and macrophages to the infection site, facilitating the phagocytosis and destruction of pathogens. Hoogendijk et al[22] performed dynamic monitoring of plasma CX3CL1 levels in 1103 septic patients, revealing significant increases in septic patients compared with healthy volunteers. Moreover, CX3CL1 levels were notably increased in patients with septic shock, and the increased levels were positively correlated with the number of organ failures. In deceased patients, CX3CL1 levels continue to rise throughout the illness[22]. Consistent with these findings, our study revealed a significant increase in plasma CX3CL1 levels among septic patients.
CXCL9 acts as a ligand for chemokine receptor 3 (CXCR3) and is an interferon-γ-induced chemokine. It is synthesized in response to toll-like receptor ligands, such as lipopolysaccharides, or cytokine induction[23] and is expressed by various cell types. Following bacterial infection, CXCR3-CXCL9 recruitment of T cells and macrophages to the infection site aids in bacterial clearance. However, inappropriate or excessive CXCR3-CXCL9 expression may lead to nonspecific aggregation of inflammatory cells, triggering an excessive inflammatory response and causing inflammatory damage to the body[24].
CXCL16, which belongs to the α-chemokine subfamily, is primarily produced by macrophages and dendritic cells in both transmembrane and soluble forms[1]. Soluble CXCL16 exerts chemotactic effects on cells expressing the CXCR6 receptor[25,26], whereas membrane-bound CXCL16 acts as an adhesive protein that binds to CXCR6, playing a crucial role in immune cell aggregation at inflammatory sites[27] and mediating the adhesion of gram-negative and gram-positive bacteria[28]. CXCL16 may also function as a receptor, transmitting signals from the extracellular environment to the intracellular environment. CXCL16 has been implicated in various human diseases. Xu et al[29] reported increased CXCL16 expression in the liver during septic shock in a mouse model of lethal liver injury induced by Mycobacterium bovis Bacillus Calmette-Guérin and lipopolysaccharide[28]. Sun et al[30] identified the CXCL16 T123V181 haplotype as a biomarker for the early identification of high-risk trauma sepsis or multiple organ dysfunction syndrome. Our study also revealed significantly elevated CXCL16 expression in the peripheral blood of septic patients, consistent with the literature[30].
CCL25, also known as a thymus-expressed chemokine, has been detected in both the thymus and intestinal epithelium of humans and mice. In healthy individuals, CCL25 is expressed at minimal levels in the small intestine or not at all[31]. This chemokine plays a pivotal role in regulating inflammation, leukocyte trafficking, and immune differentiation by controlling various immune cells, particularly in recruiting innate immune cells[31,32]. Xia et al[32] investigated chemokine expression in septic patients and noted relatively increased CCL25 serum levels in these individuals compared with healthy controls. Consistent with these findings, our study revealed a significant increase in the plasma CCL25 concentration among septic patients, which is consistent with the findings of previous studies[32].
CCL23 acts as a potent chemotactic factor for T cells and monocytes. Ginde et al[33] demonstrated a positive correlation between CCL23 levels and disease severity in septic patients. Furthermore, after adjusting for sepsis severity, elderly patients exhibited increased CCL23 levels upon sepsis presentation compared with their younger counterparts[33]. Van Nynatten et al[34] conducted a dynamic analysis of plasma proteins in intensive care unit-admitted septic patients, revealing significant increases in plasma CCL23 levels on both the first and third days compared to those in healthy controls[34]. Similarly, studies by Isis and others indicated a notable elevation in plasma CCL23 levels among septic patients[35], consistent with our research findings. However, to date, no reports have elucidated the mechanisms linking CCL23 to septicemia, suggesting a potential area for future investigation.
Through functional enrichment analysis of differential proteins, including GO and KEGG pathway analyses, it was found that these differential expressed cytokines primarily participate in cytokine cytokine receptor interactions (IL-16, GM-CSF, CX3CL1, CXCL9, CXCL16, CCL25, and CCL23), chemokine signaling pathways (CX3CL1, CXCL9, CXCL16, CCL25, and CCL23), virus protein interactions with cytokines and cytokine receptors (CX3CL1, CXCL9, and CCL25), and tumor necrosis factor signaling pathways (GM-CSF and CX3CL1), exerting biological effects.
In conclusion, this study employed protein chip technology to identify seven differentially expressed proteins in septic patients, namely, IL-16, GM-CSF, CX3CL1, CXCL9, CXCL16, CCL25, and CCL23. These proteins hold promise as early diagnostic biomarkers for septic patients. The differential cytokines IL-16, GM-CSF, CX3CL1, CXCL9, CXCL16, CCL25, and CCL23 primarily participate in cytokine cytokine receptor interactions, chemokine signaling pathways, virus protein interactions with cytokines and cytokine receptors, and tumor necrosis factor signaling pathways. These findings contribute to a deeper understanding of the mechanisms underlying the occurrence and development of sepsis and offer a theoretical basis for its diagnosis and treatment.
| 1. | Oakley RH, Ramamoorthy S, Foley JF, Busada JT, Lu NZ, Cidlowski JA. Glucocorticoid receptor isoform-specific regulation of development, circadian rhythm, and inflammation in mice. FASEB J. 2018;32:5258-5271. [RCA] [PubMed] [DOI] [Full Text] [Cited by in Crossref: 11] [Cited by in RCA: 21] [Article Influence: 3.0] [Reference Citation Analysis (0)] |
| 2. | Fleuren LM, Klausch TLT, Zwager CL, Schoonmade LJ, Guo T, Roggeveen LF, Swart EL, Girbes ARJ, Thoral P, Ercole A, Hoogendoorn M, Elbers PWG. Machine learning for the prediction of sepsis: a systematic review and meta-analysis of diagnostic test accuracy. Intensive Care Med. 2020;46:383-400. [RCA] [PubMed] [DOI] [Full Text] [Full Text (PDF)] [Cited by in Crossref: 447] [Cited by in RCA: 351] [Article Influence: 70.2] [Reference Citation Analysis (0)] |
| 3. | Ellett F, Jorgensen J, Marand AL, Liu YM, Martinez MM, Sein V, Butler KL, Lee J, Irimia D. Diagnosis of sepsis from a drop of blood by measurement of spontaneous neutrophil motility in a microfluidic assay. Nat Biomed Eng. 2018;2:207-214. [RCA] [PubMed] [DOI] [Full Text] [Cited by in Crossref: 64] [Cited by in RCA: 85] [Article Influence: 12.1] [Reference Citation Analysis (0)] |
| 4. | Askim Å, Moser F, Gustad LT, Stene H, Gundersen M, Åsvold BO, Dale J, Bjørnsen LP, Damås JK, Solligård E. Poor performance of quick-SOFA (qSOFA) score in predicting severe sepsis and mortality - a prospective study of patients admitted with infection to the emergency department. Scand J Trauma Resusc Emerg Med. 2017;25:56. [RCA] [PubMed] [DOI] [Full Text] [Full Text (PDF)] [Cited by in Crossref: 133] [Cited by in RCA: 164] [Article Influence: 20.5] [Reference Citation Analysis (0)] |
| 5. | Trzeciak A, Pietropaoli AP, Kim M. Biomarkers and Associated Immune Mechanisms for Early Detection and Therapeutic Management of Sepsis. Immune Netw. 2020;20:e23. [RCA] [PubMed] [DOI] [Full Text] [Full Text (PDF)] [Cited by in Crossref: 9] [Cited by in RCA: 10] [Article Influence: 2.0] [Reference Citation Analysis (0)] |
| 6. | Wu F, Hou XQ, Sun RR, Cui XJ. The predictive value of joint detection of serum amyloid protein A, PCT, and Hs-CRP in the diagnosis and efficacy of neonatal septicemia. Eur Rev Med Pharmacol Sci. 2019;23:5904-5911. [RCA] [PubMed] [DOI] [Full Text] [Cited by in RCA: 1] [Reference Citation Analysis (0)] |
| 7. | Sweeney TE, Wong HR, Khatri P. Robust classification of bacterial and viral infections via integrated host gene expression diagnostics. Sci Transl Med. 2016;8:346ra91. [RCA] [PubMed] [DOI] [Full Text] [Cited by in Crossref: 197] [Cited by in RCA: 235] [Article Influence: 29.4] [Reference Citation Analysis (0)] |
| 8. | Frimpong A, Owusu EDA, Amponsah JA, Obeng-Aboagye E, van der Puije W, Frempong AF, Kusi KA, Ofori MF. Cytokines as Potential Biomarkers for Differential Diagnosis of Sepsis and Other Non-Septic Disease Conditions. Front Cell Infect Microbiol. 2022;12:901433. [RCA] [PubMed] [DOI] [Full Text] [Full Text (PDF)] [Cited by in RCA: 30] [Reference Citation Analysis (0)] |
| 9. | Martínez-García JJ, Martínez-Banaclocha H, Angosto-Bazarra D, de Torre-Minguela C, Baroja-Mazo A, Alarcón-Vila C, Martínez-Alarcón L, Amores-Iniesta J, Martín-Sánchez F, Ercole GA, Martínez CM, González-Lisorge A, Fernández-Pacheco J, Martínez-Gil P, Adriouch S, Koch-Nolte F, Luján J, Acosta-Villegas F, Parrilla P, García-Palenciano C, Pelegrin P. P2X7 receptor induces mitochondrial failure in monocytes and compromises NLRP3 inflammasome activation during sepsis. Nat Commun. 2019;10:2711. [RCA] [PubMed] [DOI] [Full Text] [Full Text (PDF)] [Cited by in Crossref: 89] [Cited by in RCA: 168] [Article Influence: 28.0] [Reference Citation Analysis (0)] |
| 10. | Reinhart K, Bauer M, Riedemann NC, Hartog CS. New approaches to sepsis: molecular diagnostics and biomarkers. Clin Microbiol Rev. 2012;25:609-634. [RCA] [PubMed] [DOI] [Full Text] [Cited by in Crossref: 324] [Cited by in RCA: 348] [Article Influence: 29.0] [Reference Citation Analysis (0)] |
| 11. | Toledo AG, Golden G, Campos AR, Cuello H, Sorrentino J, Lewis N, Varki N, Nizet V, Smith JW, Esko JD. Proteomic atlas of organ vasculopathies triggered by Staphylococcus aureus sepsis. Nat Commun. 2019;10:4656. [RCA] [PubMed] [DOI] [Full Text] [Full Text (PDF)] [Cited by in Crossref: 33] [Cited by in RCA: 57] [Article Influence: 9.5] [Reference Citation Analysis (0)] |
| 12. | Moreno R, Rhodes A, Piquilloud L, Hernandez G, Takala J, Gershengorn HB, Tavares M, Coopersmith CM, Myatra SN, Singer M, Rezende E, Prescott HC, Soares M, Timsit JF, de Lange DW, Jung C, De Waele JJ, Martin GS, Summers C, Azoulay E, Fujii T, McLean AS, Vincent JL. The Sequential Organ Failure Assessment (SOFA) Score: has the time come for an update? Crit Care. 2023;27:15. [RCA] [PubMed] [DOI] [Full Text] [Full Text (PDF)] [Cited by in RCA: 83] [Reference Citation Analysis (0)] |
| 13. | Center DM, Cruikshank WW, Parada NA, Ryan T, Theodore AC, Viglianti G, Lim KG, Weller PF. Measurement of interleukin 16. Curr Protoc Immunol. 2001;Chapter 6:6.23.1-6.23.14. [RCA] [PubMed] [DOI] [Full Text] [Cited by in RCA: 2] [Reference Citation Analysis (0)] |
| 14. | Parada NA, Center DM, Kornfeld H, Rodriguez WL, Cook J, Vallen M, Cruikshank WW. Synergistic activation of CD4+ T cells by IL-16 and IL-2. J Immunol. 1998;160:2115-2120. [RCA] [PubMed] [DOI] [Full Text] [Cited by in Crossref: 2] [Reference Citation Analysis (0)] |
| 15. | Smyth LJ, Starkey C, Gordon FS, Vestbo J, Singh D. CD8 chemokine receptors in chronic obstructive pulmonary disease. Clin Exp Immunol. 2008;154:56-63. [RCA] [PubMed] [DOI] [Full Text] [Cited by in Crossref: 14] [Cited by in RCA: 14] [Article Influence: 0.8] [Reference Citation Analysis (0)] |
| 16. | Zhang C, Li X, Liu N, Feng Z, Zhang C. MicroRNA-96 is Downregulated in Sepsis Neonates and Attenuates LPSInduced Inflammatory Response by Inhibiting IL-16 in Monocytes. Comb Chem High Throughput Screen. 2022;25:90-96. [RCA] [PubMed] [DOI] [Full Text] [Cited by in Crossref: 2] [Cited by in RCA: 2] [Article Influence: 0.4] [Reference Citation Analysis (0)] |
| 17. | Warford J, Lamport AC, Kennedy B, Easton AS. Human Brain Chemokine and Cytokine Expression in Sepsis: A Report of Three Cases. Can J Neurol Sci. 2017;44:96-104. [RCA] [PubMed] [DOI] [Full Text] [Cited by in Crossref: 20] [Cited by in RCA: 28] [Article Influence: 3.1] [Reference Citation Analysis (0)] |
| 18. | Huang H, Wang S, Jiang T, Fan R, Zhang Z, Mu J, Li K, Wang Y, Jin L, Lin F, Xia J, Sun L, Xu B, Ji C, Chen J, Chang J, Tu B, Song B, Zhang C, Wang FS, Xu R. High levels of circulating GM-CSF(+)CD4(+) T cells are predictive of poor outcomes in sepsis patients: a prospective cohort study. Cell Mol Immunol. 2019;16:602-610. [RCA] [PubMed] [DOI] [Full Text] [Cited by in Crossref: 24] [Cited by in RCA: 32] [Article Influence: 4.6] [Reference Citation Analysis (0)] |
| 19. | Peter AE, Sandeep BV, Rao BG, Kalpana VL. Calming the Storm: Natural Immunosuppressants as Adjuvants to Target the Cytokine Storm in COVID-19. Front Pharmacol. 2020;11:583777. [RCA] [PubMed] [DOI] [Full Text] [Full Text (PDF)] [Cited by in Crossref: 69] [Cited by in RCA: 68] [Article Influence: 17.0] [Reference Citation Analysis (0)] |
| 20. | Prakash V, Arora V, Jindal A, Maiwall R, Sarin SK. Combination of GM CSF and carbapenem is superior to carbapenem monotherapy in difficult-to-treat spontaneous bacterial peritonitis: A randomized controlled trial. Liver Int. 2023;43:1298-1306. [RCA] [PubMed] [DOI] [Full Text] [Cited by in RCA: 7] [Reference Citation Analysis (0)] |
| 21. | Mehta HM, Malandra M, Corey SJ. G-CSF and GM-CSF in Neutropenia. J Immunol. 2015;195:1341-1349. [RCA] [PubMed] [DOI] [Full Text] [Cited by in Crossref: 196] [Cited by in RCA: 261] [Article Influence: 26.1] [Reference Citation Analysis (0)] |
| 22. | Hoogendijk AJ, Wiewel MA, van Vught LA, Scicluna BP, Belkasim-Bohoudi H, Horn J, Zwinderman AH, Klein Klouwenberg PM, Cremer OL, Bonten MJ, Schultz MJ, van der Poll T; MARS consortium. Plasma fractalkine is a sustained marker of disease severity and outcome in sepsis patients. Crit Care. 2015;19:412. [RCA] [PubMed] [DOI] [Full Text] [Full Text (PDF)] [Cited by in Crossref: 17] [Cited by in RCA: 23] [Article Influence: 2.3] [Reference Citation Analysis (0)] |
| 23. | Boyé K, Billottet C, Pujol N, Alves ID, Bikfalvi A. Ligand activation induces different conformational changes in CXCR3 receptor isoforms as evidenced by plasmon waveguide resonance (PWR). Sci Rep. 2017;7:10703. [RCA] [PubMed] [DOI] [Full Text] [Full Text (PDF)] [Cited by in Crossref: 11] [Cited by in RCA: 20] [Article Influence: 2.5] [Reference Citation Analysis (0)] |
| 24. | Kakimi K, Lane TE, Wieland S, Asensio VC, Campbell IL, Chisari FV, Guidotti LG. Blocking chemokine responsive to gamma-2/interferon (IFN)-gamma inducible protein and monokine induced by IFN-gamma activity in vivo reduces the pathogenetic but not the antiviral potential of hepatitis B virus-specific cytotoxic T lymphocytes. J Exp Med. 2001;194:1755-1766. [RCA] [PubMed] [DOI] [Full Text] [Full Text (PDF)] [Cited by in Crossref: 195] [Cited by in RCA: 196] [Article Influence: 8.2] [Reference Citation Analysis (0)] |
| 25. | Korbecki J, Bajdak-Rusinek K, Kupnicka P, Kapczuk P, Simińska D, Chlubek D, Baranowska-Bosiacka I. The Role of CXCL16 in the Pathogenesis of Cancer and Other Diseases. Int J Mol Sci. 2021;22. [RCA] [PubMed] [DOI] [Full Text] [Full Text (PDF)] [Cited by in Crossref: 20] [Cited by in RCA: 92] [Article Influence: 23.0] [Reference Citation Analysis (0)] |
| 26. | Wilbanks A, Zondlo SC, Murphy K, Mak S, Soler D, Langdon P, Andrew DP, Wu L, Briskin M. Expression cloning of the STRL33/BONZO/TYMSTRligand reveals elements of CC, CXC, and CX3C chemokines. J Immunol. 2001;166:5145-5154. [RCA] [PubMed] [DOI] [Full Text] [Cited by in Crossref: 229] [Cited by in RCA: 242] [Article Influence: 10.1] [Reference Citation Analysis (0)] |
| 27. | Hofnagel O, Engel T, Severs NJ, Robenek H, Buers I. SR-PSOX at sites predisposed to atherosclerotic lesion formation mediates monocyte-endothelial cell adhesion. Atherosclerosis. 2011;217:371-378. [RCA] [PubMed] [DOI] [Full Text] [Cited by in Crossref: 28] [Cited by in RCA: 35] [Article Influence: 2.5] [Reference Citation Analysis (0)] |
| 28. | Shimaoka T, Nakayama T, Kume N, Takahashi S, Yamaguchi J, Minami M, Hayashida K, Kita T, Ohsumi J, Yoshie O, Yonehara S. Cutting edge: SR-PSOX/CXC chemokine ligand 16 mediates bacterial phagocytosis by APCs through its chemokine domain. J Immunol. 2003;171:1647-1651. [RCA] [PubMed] [DOI] [Full Text] [Cited by in Crossref: 118] [Cited by in RCA: 126] [Article Influence: 5.7] [Reference Citation Analysis (0)] |
| 29. | Xu H, Xu W, Chu Y, Gong Y, Jiang Z, Xiong S. Involvement of up-regulated CXC chemokine ligand 16/scavenger receptor that binds phosphatidylserine and oxidized lipoprotein in endotoxin-induced lethal liver injury via regulation of T-cell recruitment and adhesion. Infect Immun. 2005;73:4007-4016. [RCA] [PubMed] [DOI] [Full Text] [Cited by in Crossref: 14] [Cited by in RCA: 18] [Article Influence: 0.9] [Reference Citation Analysis (0)] |
| 30. | Sun J, Zhang H, Liu D, Cui L, Wang Q, Gan L, Wen D, Wang J, Du J, Huang H, Zhang A, Deng J, Jiang J, Zeng L. A Functional Variant of CXCL16 Is Associated With Predisposition to Sepsis and MODS in Trauma Patients: Genetic Association Studies. Front Genet. 2021;12:720313. [RCA] [PubMed] [DOI] [Full Text] [Full Text (PDF)] [Cited by in Crossref: 2] [Cited by in RCA: 1] [Article Influence: 0.3] [Reference Citation Analysis (0)] |
| 31. | Trivedi PJ, Bruns T, Ward S, Mai M, Schmidt C, Hirschfield GM, Weston CJ, Adams DH. Intestinal CCL25 expression is increased in colitis and correlates with inflammatory activity. J Autoimmun. 2016;68:98-104. [RCA] [PubMed] [DOI] [Full Text] [Full Text (PDF)] [Cited by in Crossref: 61] [Cited by in RCA: 72] [Article Influence: 8.0] [Reference Citation Analysis (0)] |
| 32. | Xia D, Wang S, Liu A, Li L, Zhou P, Xu S. CCL25 Inhibition Alleviates Sepsis-Induced Acute Lung Injury and Inflammation. Infect Drug Resist. 2022;15:3309-3321. [RCA] [PubMed] [DOI] [Full Text] [Full Text (PDF)] [Cited by in RCA: 10] [Reference Citation Analysis (0)] |
| 33. | Ginde AA, Blatchford PJ, Trzeciak S, Hollander JE, Birkhahn R, Otero R, Osborn TM, Moretti E, Nguyen HB, Gunnerson KJ, Milzman D, Gaieski DF, Goyal M, Cairns CB, Rivers EP, Shapiro NI. Age-related differences in biomarkers of acute inflammation during hospitalization for sepsis. Shock. 2014;42:99-107. [RCA] [PubMed] [DOI] [Full Text] [Cited by in Crossref: 15] [Cited by in RCA: 27] [Article Influence: 2.7] [Reference Citation Analysis (0)] |
| 34. | Van Nynatten LR, Slessarev M, Martin CM, Leligdowicz A, Miller MR, Patel MA, Daley M, Patterson EK, Cepinskas G, Fraser DD. Novel plasma protein biomarkers from critically ill sepsis patients. Clin Proteomics. 2022;19:50. [RCA] [PubMed] [DOI] [Full Text] [Full Text (PDF)] [Cited by in Crossref: 14] [Cited by in RCA: 14] [Article Influence: 4.7] [Reference Citation Analysis (0)] |
| 35. | Ricaño-Ponce I, Riza AL, de Nooijer AH, Pirvu A, Dorobantu S, Dragos A, Streata I, Roskanovic M, Grondman I, Dumitrescu F, Kumar V, Netea MG, Ioana M. Characterization of sepsis inflammatory endotypes using circulatory proteins in patients with severe infection: a prospective cohort study. BMC Infect Dis. 2022;22:778. [RCA] [PubMed] [DOI] [Full Text] [Full Text (PDF)] [Cited by in RCA: 13] [Reference Citation Analysis (0)] |


