Published online Oct 26, 2022. doi: 10.12998/wjcc.v10.i30.11066
Peer-review started: May 27, 2022
First decision: July 29, 2022
Revised: August 26, 2022
Accepted: September 14, 2022
Article in press: September 14, 2022
Published online: October 26, 2022
Processing time: 146 Days and 22.5 Hours
Hepatic steatosis is a common radiologic finding. Some imaging inklings are the absence of a mass effect, and there is currently no report of hepatic steatosis with mass effect.
A 23-year-old female was admitted due to a liver mass for half a month. No obvious abnormalities were found in physical and laboratory examinations. Ultrasound, computed tomography, and magnetic resonance imaging showed a huge mass between the liver and stomach with a significant mass effect, and the caudate lobe and left lobe of the liver were involved. The signal on T2- and T1- weighted fat-saturated images of the mass was significantly reduced, and the enhanced scan showed inhomogeneous enhancement. Surgical and pathological findings indicated the diagnosis of hepatic steatosis. The operation and re-review of the patient's images showed that the lesion was supplied by the branch of the hepatic artery. The signal on T1-weighted out-of-phase images of the lesion was lower than on in-phase images, and there was no black rim cancellation artifact around the hepatic steatosis area on T1-weighted out-of-phase images. The dynamic enhancement pattern of the lesion was similar to that of the adjacent normal liver parenchyma. The above characteristics suggested that the lesion was hepatic steatosis. However, in this case, the lesion showed exogenous growth and was mass-like, with an obvious mass effect, which has not been reported previously.
Hepatic steatosis could grow exogenously and has an obvious mass effect. It needs to be distinguished from fat-rich tumors. The T1-weighted in- and out-of-phase images and dynamic enhanced scanning are valuable for differential diagnosis of this lesion.
Core Tip: Hepatic steatosis is a common radiologic finding, which can be divided into diffuse, geographic, focal, multifocal, perivascular, and subcapsular patterns. Some imaging inklings are the absence of a mass effect. Here, we present a case of hepatic steatosis with obvious mass effect and exogenous growth. It needs to be distinguished from liver tumors and other abdominal tumors containing fat. The T1-weighted in- and out-of-phase images and dynamic enhanced scanning have great differential diagnostic values.
- Citation: Hu N, Su SJ, Li JY, Zhao H, Liu SF, Wang LS, Gong RZ, Li CT. Hepatic steatosis with mass effect: A case report. World J Clin Cases 2022; 10(30): 11066-11073
- URL: https://www.wjgnet.com/2307-8960/full/v10/i30/11066.htm
- DOI: https://dx.doi.org/10.12998/wjcc.v10.i30.11066
Hepatic steatosis is caused by the abnormal and excessive intracellular accumulation of fat (mainly triglycerides) in hepatocytes[1,2]. It is a common radiologic finding. There are six patterns of fat accumulation in the liver, including diffuse, geographic, focal, subcapsular, multifocal, and perivascular patterns[3-6]. Some imaging inklings are the absence of mass effect, stability in size over time, and enhancement similar to the hepatic parenchyma[7]. To the best of our knowledge, hepatic steatosis with mass effect has not been reported. It needs to be distinguished from liver tumors and other abdominal tumors containing fat. Here, we described a case of hepatic steatosis with exogenous growth and mass effect.
The patient was a 23-year-old female who was admitted due to a liver mass for more than half a month. The patient had no obvious symptoms.
The liver mass was found by computed tomography (CT) examination during routine physical examination in another hospital half a month ago.
She had chronic gastritis for more than 3 years and had taken medications (including omeprazole and hydrotalcite chewable tablets) intermittently.
The patient’s family history was unremarkable.
No obvious abnormality was found during physical examination.
The laboratory examination was unremarkable. Blood routine tests showed that red blood cell count was 4.40 × 10¹² /L; hemoglobin was 128 g/L; white blood cell count was 5.65 × 10⁹ /L; C-reactive protein level was 0.25 mg/L; D-dimer level was 0.57 μg/mL; and, low density lipoprotein level was 1.28 mmol/L, which were all within normal range. The results for viral hepatitis markers were negative. The carcinoembryonic antigen was 0.50 ng/mL; the alpha-fetoprotein was 2.17 ng/mL; and, the carbohydrate antigen 19-9 was 4.47 U/mL, which were all within normal range, indicating negative results for tumor markers.
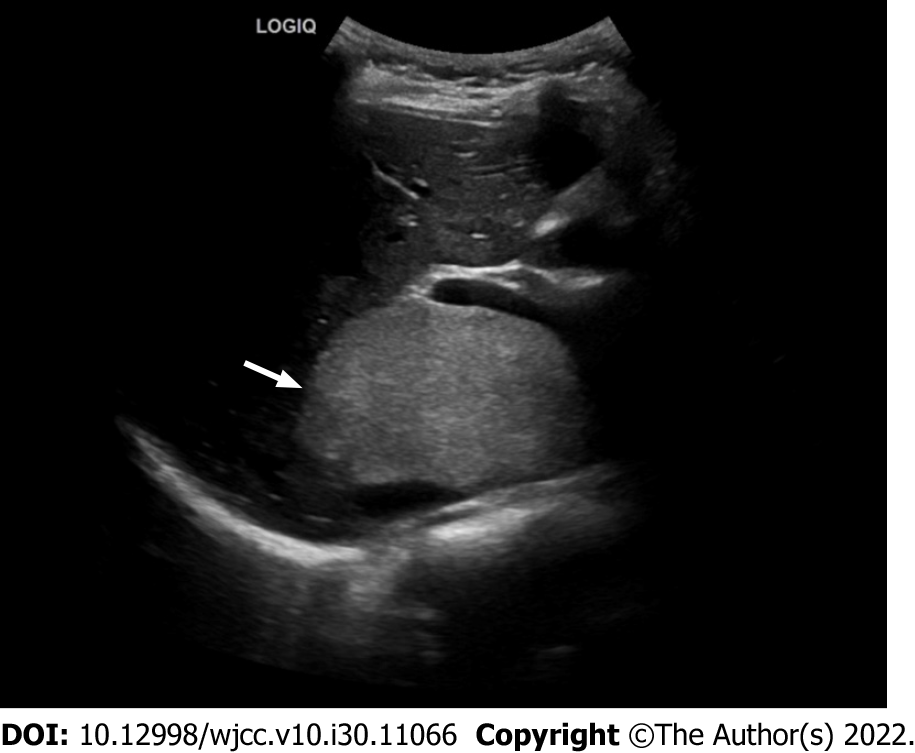
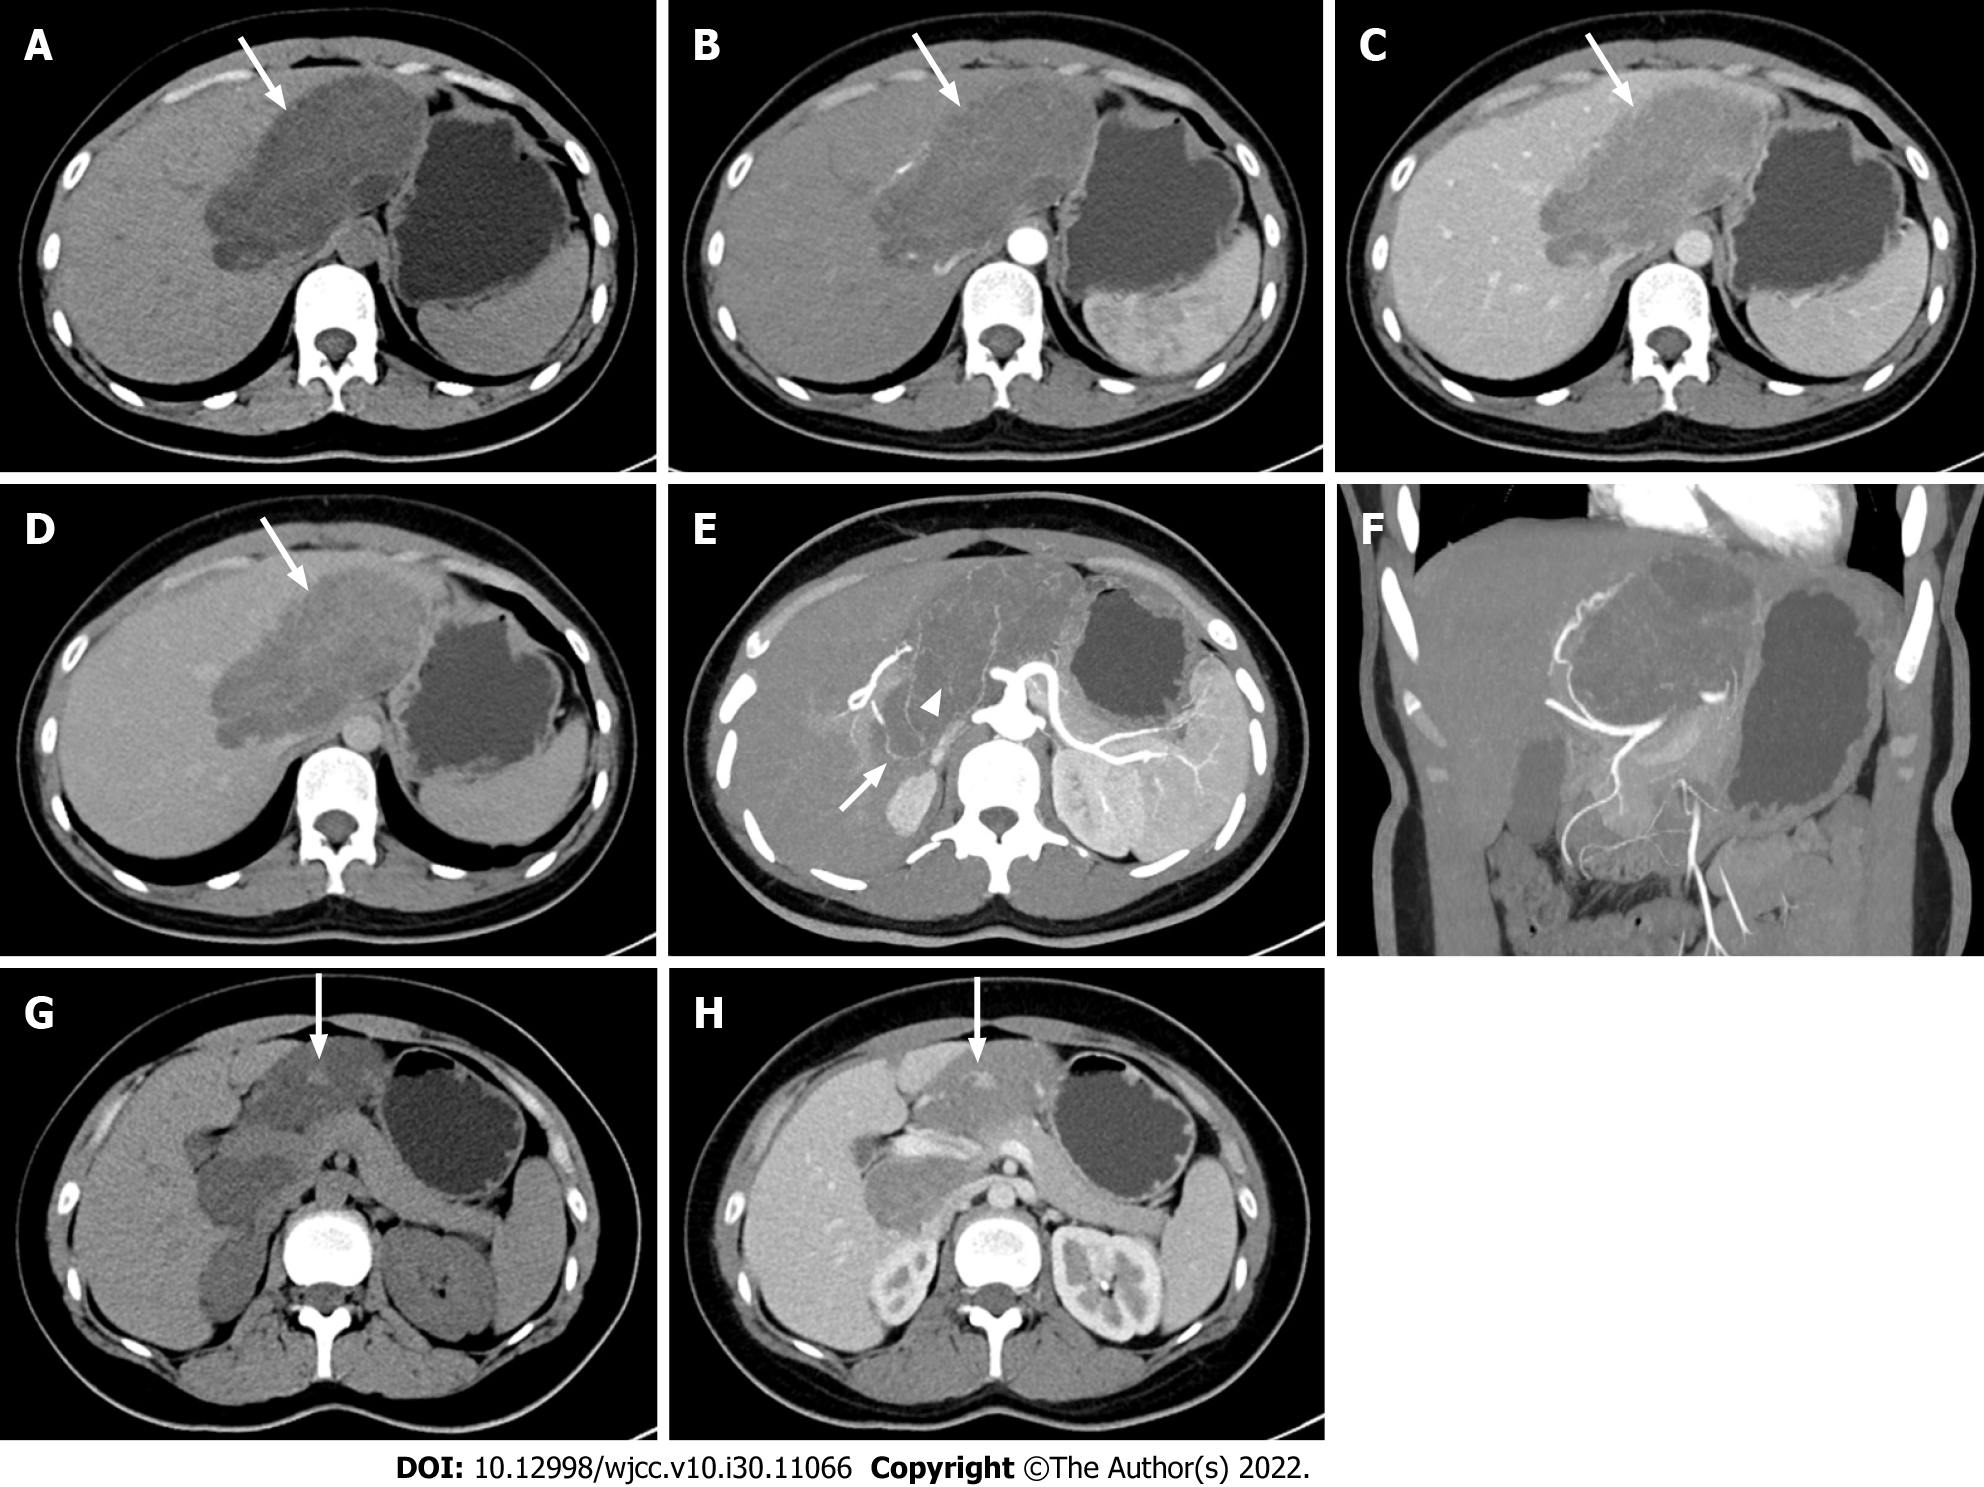
Ultrasound showed a large hyperechoic mass with a size of 13 cm × 10 cm × 7 cm in the parenchyma of the caudate lobe of the liver, with clear boundary, irregular shape and inhomogeneous internal echo (Figure 1). CT examination showed an irregular mass in the caudate lobe of the liver with a size of about 12 cm × 6 cm × 10 cm, locally protruding beyond the liver outline. It had a clear boundary and inhomogeneous density. The unenhanced CT attenuation value was 5 - 31 HU (Figure 2A). The contrast-enhanced CT attenuation value was 21 - 44 HU in the arterial phase (Figure 2B), 39 - 66 HU in the portal vein phase (Figure 2C), and 21 - 59 HU in the delayed phase (Figure 2D). The dynamic enhancement pattern of the lesion was similar to that of the adjacent normal liver parenchyma, and the lesion was hypovascular compared with the background liver in all three contrast-enhanced phases. There were branches of the hepatic artery inside the mass (Figure 2E). The intrahepatic and extrahepatic bile ducts, hepatic arteries, and the trunk and branches of the portal vein were compressed and displaced (Figure 2F). The stomach and the duodenum were slightly compressed. One nodule in the mass was observed on CT images. The attenuation of the nodule on the unenhanced scan was the same as that of normal liver parenchyma (Figure 2G), and the dynamic enhancement-mode of the nodule was synchronous with that of normal liver parenchyma (Figure 2H).
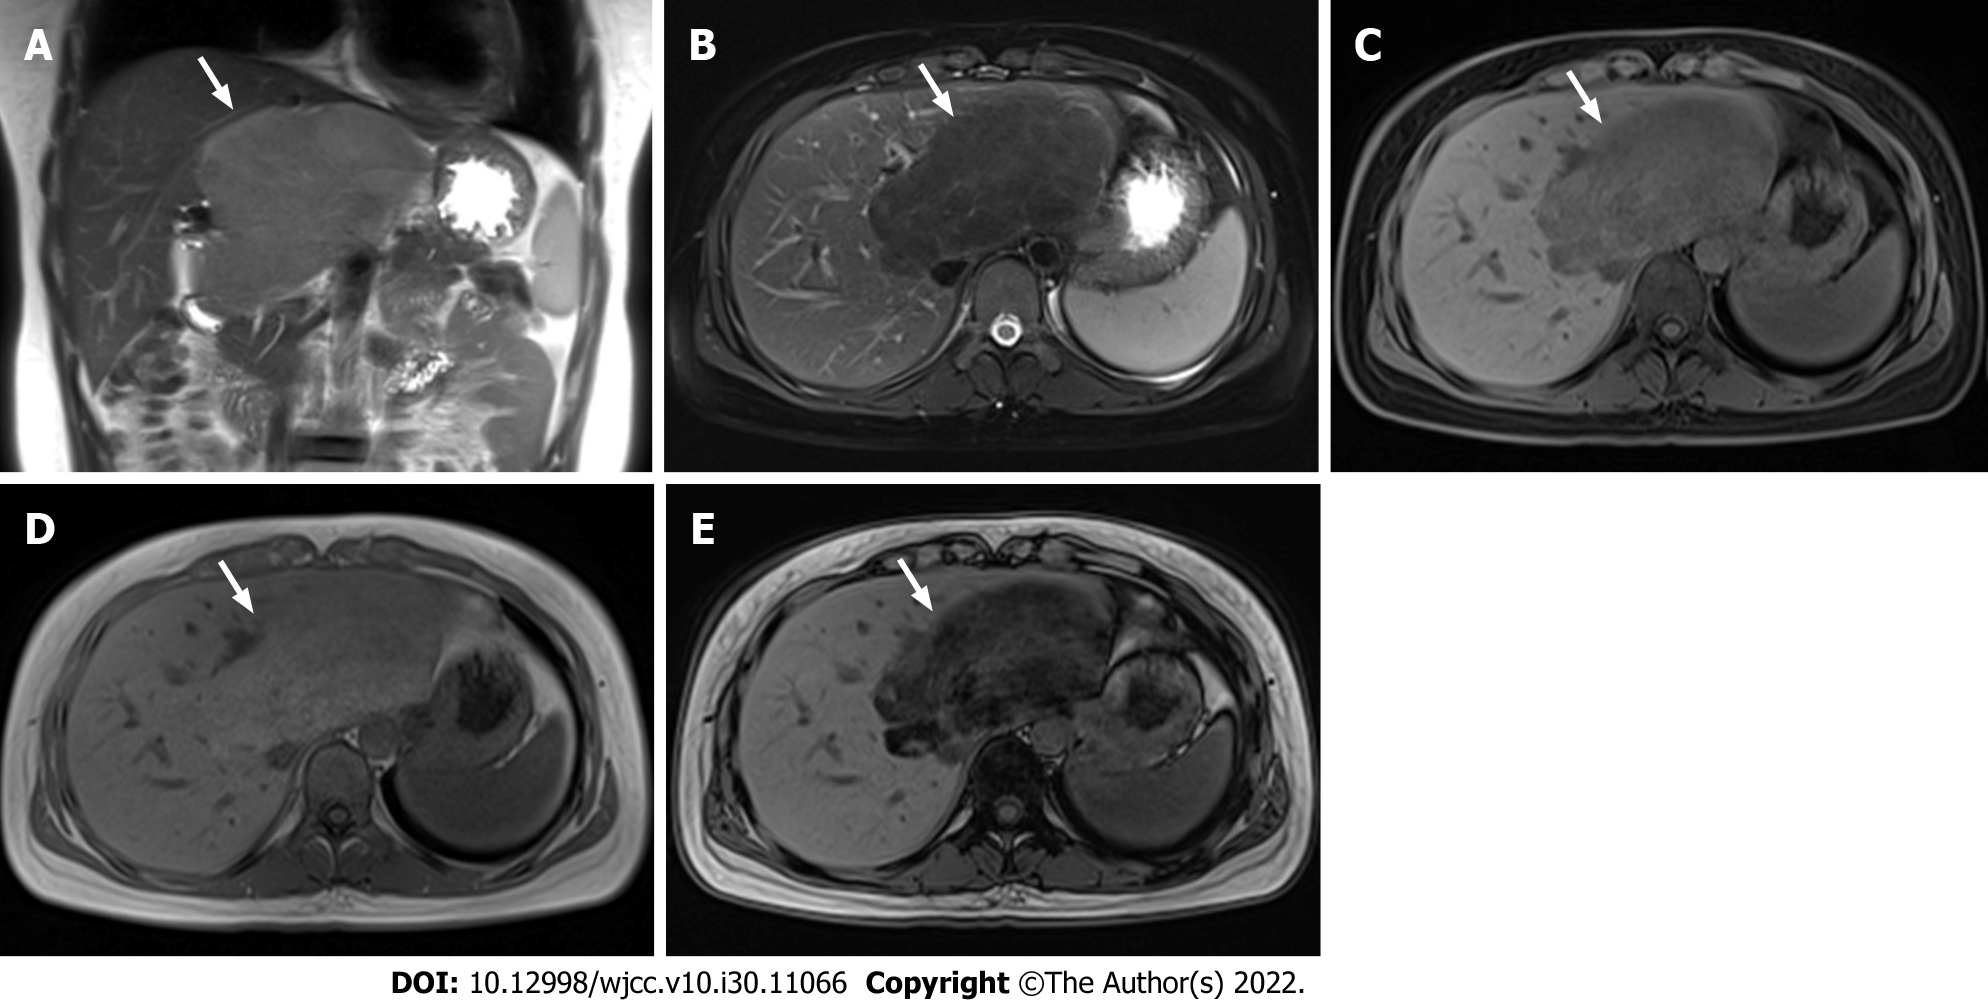
Magnetic resonance imaging (MRI) examination: T2-weighted non-fat-saturated image showed slight hyperintensity (Figure 3A). The signal intensity was reduced on T2- and T1- weighted fat-saturated images (Figure 3B and C). T1-weighted in-phase image showed slight hyperintensity (Figure 3D), and the signal intensity of the T1-weighted out-of-phase image decreased obviously (Figure 3E). The degree of reduction of the T1-weighted out-of-phase image was higher than that of T1- weighted fat-saturated image. Diffusion-Weighted Imaging (b value = 800) showed slight hypointensity. Apparent diffusion coefficient mapping showed hyperintensity and isointensity. The enhancement pattern of MRI was the same as that of CT. No abnormality was found in the remaining liver parenchyma.
The fatty mass originating from the caudate lobe of the liver was removed completely by the caudate lobectomy, with the patient under general anesthesia. Surgical findings: the lesion was an exogenous mass with root in the caudate lobe of the liver and with soft texture similar to the liver tissue. It adhered closely to the left liver surface, crossed the hepatoduodenal ligament forward, and protruded behind the left lobe of the liver, with a size of about 12 cm × 8 cm. There was a fibrous capsule on the surface of the mass. The blood supply of the mass was rich. The supplying artery was from the left hepatic artery, and the drainage vein was connected with the inferior vena cava and portal vein.
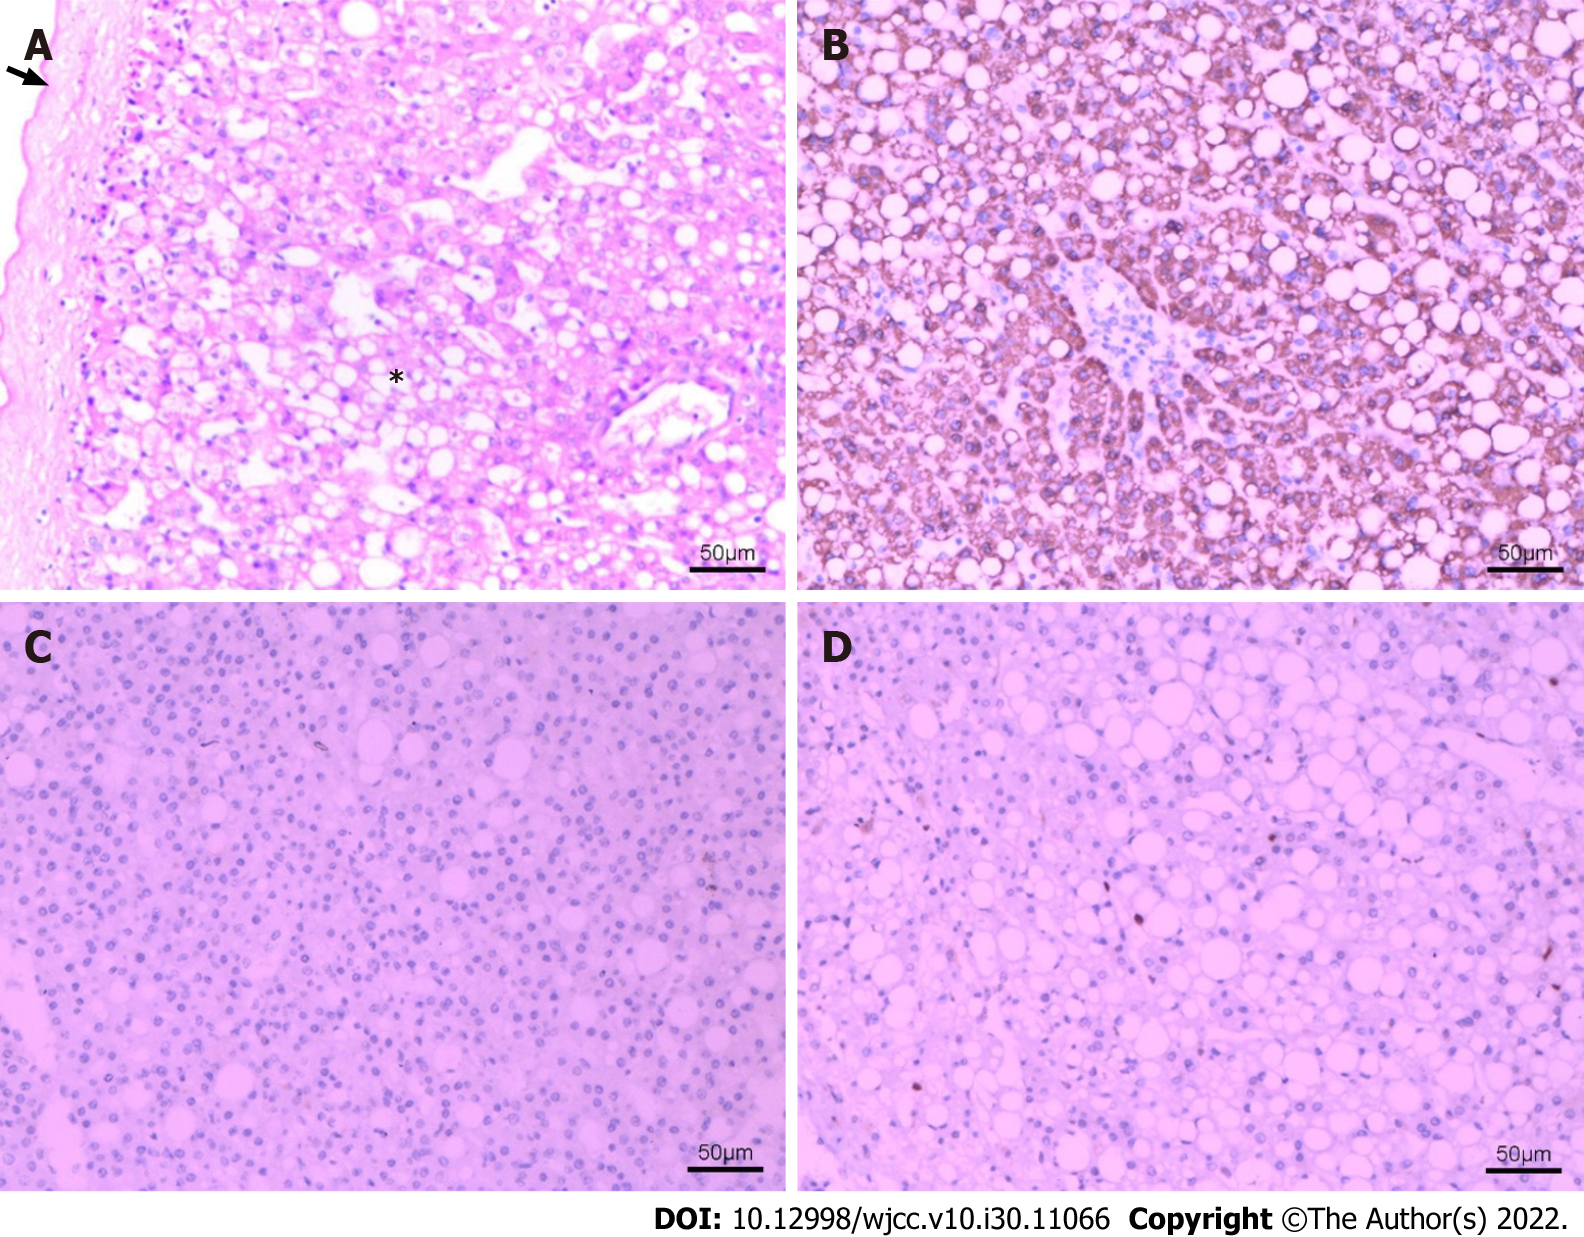
The pathological results of the resected mass were analyzed. Macroscopically, the resected mass was 13 cm × 10 cm × 4 cm in size, with smooth surface and grayish red color. Most of the fibrous capsule was complete. The section of the mass was grayish-yellow, grayish red, solid, soft, and nodular. Microscopically, some normal structures of liver tissue disappeared. No obvious hepatic lobular structure was found. There was extensive steatosis in hepatocytes, intrahepatic vascular proliferation, local vascular dilatation, and a fibrous cell layer around the lesion (Figure 4A). Immunohistochemical staining results were as follows: Hep Par 1 (hepatocyte paraffin 1) (+) (Figure 4B), GPC-3 (glypican-3) (-) (Figure 4C), CD34 vascular (+), Cytokeratin 19 (CK19) focus (+), S-100 (-), HMB-45 (human melanoma black-45) (-), Melan-A (melanocyte antigen) (-), MDM2 (murine double minute 2) (-), CDK4 (cyclin-dependent kinase 4) (-) and Ki-67 index (2%) (Figure 4D).
Surgical and pathological findings suggested the diagnosis of hepatic steatosis.
The patient received the caudate lobectomy to completely remove the mass.
After 10 mo of follow-up, the patient showed no signs of disease relapse.
Hepatic steatosis, also known as fatty liver, is a common radiologic finding. It is caused by the dysfunction of liver fat metabolism and the excessive accumulation of fat in hepatocytes[1,2,8]. Hepatic steatosis has no mass effect. Its size is stable over time, and its enhancement is similar to that of liver parenchyma[7]. Hepatic steatosis with mass effect has not been reported in the literature. In this report, the case had hepatic steatosis with exogenous growth and obvious mass effect. The signal intensity of hepatic steatosis in the T1-weighted out-of-phase images decreased significantly compared with in-phase images. The dynamic enhanced scanning mode is similar to the normal liver parenchyma. The T1-weighted in- and out-of-phase images and dynamic enhanced scanning have great value in differential diagnosis.
Fatty infiltration of the liver occurs in many forms, depending on the amount and distribution of liver parenchymal fat[9]. It can be divided into diffuse, geographic, focal, subcapsular, multifocal, and perivascular hepatic steatosis[3-6]. Clinically, diffuse hepatic steatosis is more common, which is characterized by a decreased diffusing density of the liver. Geographic hepatic steatosis is a frequently encountered variant. Different geographic hepatic steatosis can be attributed to specific causes. It may be secondary to an injury to the liver parenchyma[3]. The focal hepatic steatosis is characterized by the geographic location of the fat distribution such as adjacent to the falciform ligament or ligamentum venosum, in the porta hepatis, and the gallbladder fossa[5]. Subcapsular hepatic steatosis may present as small fat nodules or as a confluent peripheral region of fat confined to a subcapsular zone[4]. It is seen in patients with renal failure and insulin-dependent diabetes[6]. Multifocal hepatic steatosis involves multiple scattered foci of fat resembling true nodules. Perivascular hepatic steatosis is characterized by fat infiltration around the hepatic veins and portal veins. Focal and multifocal hepatic steatosis need to be differentiated from benign and malignant liver tumors. The absence of mass effect, stability in size over time, and enhancement similar to the hepatic parenchyma are the characteristics of hepatic steatosis[10]. The case in this report was hepatic steatosis in the caudate lobe, which was an exogenous mass with significant mass effect. The imaging findings of the case were different from those of the previous types.
The lesion of this case was located in the caudate lobe of the liver, obviously protruding beyond the outline of the liver. It was closely related to the left lobe of the liver, and compressed adjacent structures. The mass effect of the lesion was significant. The preoperative localization of the mass appeared to be in the hepatogastric space, and it involved the caudate lobe and left lobe of the liver. After operation and re-reviewing the images, it was found that the blood supply of the mass was from the branch of the hepatic artery. Ultrasound showed that the lesion was inhomogeneous hyperechoic. The characteristics of dynamic enhanced scanning of hepatic steatosis are similar to those of normal liver parenchyma[7]. The hepatic steatosis is hypovascular compared with the background liver[11]. The case reported in this study also has such characteristics. The nodule in the mass was observed on CT images. The attenuation of the unenhanced scan of the nodule was the same as that of normal liver parenchyma, and the dynamic enhancement-mode was synchronous with that of normal liver parenchyma. This sign is helpful for distinguishing hepatic steatosis from other lesions. The mass showed inhomogeneous low density, slight hyperintensity on T2-weighted non-fat-saturated image, and decreased signal intensity on T2- and T1-weighted fat-saturated images. These signs suggested that it contained fatty substances, which included adipose tissue and steatosis. The MRI findings of adipose tissue and steatosis are different. Adipose tissue shows hyperintensity on T1-weighted in-phase image, hyperintensity in the center of adipose tissue on T1-weighted out-of-phase image, with a black rim cancellation artifact. The signal on T2- and T1-weighted fat-saturated images of the mass is significantly reduced[12]. Steatosis shows isointensity or slight hyperintensity on T1-weighted in-phase image. The signal intensity of the T1-weighted out-of-phase image decreases significantly. The signal of fat-saturated images can be reduced, but the reduction range is often less than that of the T1-weighted out-of-phase image[8]. The MRI signal characteristics of this case were consistent with those of steatosis.
Pathological findings were most reliable in the diagnosis of this case. Immunohistochemistry was also helpful in making differential diagnosis. Although initially reversible, hepatic steatosis may progress into cirrhosis and hepatocellular carcinoma (HCC)[4]. Hep Par 1, GPC-3, and CD 34 are sensitive and specific markers for HCC[13,14]. Hep Par 1 is mainly strongly positive in HCC and can also be expressed in normal liver tissue. In a normal liver, immunohistochemistry for CD34 stains the endothelial cells of blood vessels in the portal tracts and the fibrous septa[15]. The case reported here was positive for Hep Par 1, negative for GPC-3 and positive for CD34 vascular, which ruled out the diagnosis of HCC. CK19 is a immunohistochemical marker of intrahepatic cholangiocarcinoma[15]. This case showed focal positivity, excluding the diagnosis of intrahepatic cholangiocarcinoma. MDM2 and CDK4 are immunohistochemical markers of liposarcoma, and they are positive in different degrees in liposarcoma[16]. This case was negative for MDM2 and CDK4, excluding liposarcoma. S-100 positive indicates the source of neural tissue, and this case was negative for S-100. HMB-45 and Melan-A are important immunohistochemical markers in the diagnosis of melanoma[17]. This case was negative for HMB-45 and Melan-A, excluding the diagnosis of melanoma. The Ki-67 index was 2%, indicating that the cell proliferation of the lesion was inactive.
Hepatic steatosis with mass effect needs to be distinguished from liver tumors and other abdominal tumors containing fat. The following points are of great value in the diagnosis of hepatic steatosis with mass effect: The blood supply of the hepatic artery, the signal of the T1-weighted out-of-phase image significantly lower than that of the T1-weighted in-phase image, no black rim cancellation artifact around hepatic steatosis area on T1-weighted out-of-phase images, and dynamic enhanced scanning mode similar to the normal liver parenchyma. Because there is a lack of previous understanding of the hepatic steatosis with mass effect, the diagnosis of liver tumor was highly suspected based on imaging findings, and thus surgical resection was performed in this case. The diagnosis of hepatic steatosis with mass effect was made post-operatively. However, surgical resection is not recommended as the first choice for treatment of hepatic steatosis with mass effect. If similar imaging characteristics to this case are present but the diagnosis is not clear, tissue biopsy and pathological examination should be performed to facilitate clear diagnosis.
In summary, hepatic steatosis in this case could grow exogenously and has an obvious mass effect. It needs to be distinguished from fat-rich tumors. The T1-weighted in- and out-of-phase images and dynamic enhanced scanning play an important role in differential diagnosis.
Provenance and peer review: Unsolicited article; Externally peer reviewed.
Peer-review model: Single blind
Specialty type: Gastroenterology and hepatology
Country/Territory of origin: China
Peer-review report’s scientific quality classification
Grade A (Excellent): 0
Grade B (Very good): B
Grade C (Good): C, C
Grade D (Fair): 0
Grade E (Poor): 0
P-Reviewer: Gallo P, Italy; Suda T, Japan S-Editor: Liu JH L-Editor: A P-Editor: Liu JH
| 1. | Younossi ZM, Koenig AB, Abdelatif D, Fazel Y, Henry L, Wymer M. Global epidemiology of nonalcoholic fatty liver disease-Meta-analytic assessment of prevalence, incidence, and outcomes. Hepatology. 2016;64:73-84. [RCA] [PubMed] [DOI] [Full Text] [Cited by in Crossref: 5322] [Cited by in RCA: 7544] [Article Influence: 838.2] [Reference Citation Analysis (0)] |
| 2. | Idilman IS, Aniktar H, Idilman R, Kabacam G, Savas B, Elhan A, Celik A, Bahar K, Karcaaltincaba M. Hepatic steatosis: quantification by proton density fat fraction with MR imaging vs liver biopsy. Radiology. 2013;267:767-775. [RCA] [PubMed] [DOI] [Full Text] [Cited by in Crossref: 242] [Cited by in RCA: 308] [Article Influence: 25.7] [Reference Citation Analysis (1)] |
| 3. | Decarie PO, Lepanto L, Billiard JS, Olivie D, Murphy-Lavallee J, Kauffmann C, Tang A. Fatty liver deposition and sparing: a pictorial review. Insights Imaging 2011;2:533-538. [RCA] [PubMed] [DOI] [Full Text] [Full Text (PDF)] [Cited by in Crossref: 51] [Cited by in RCA: 57] [Article Influence: 4.1] [Reference Citation Analysis (0)] |
| 4. | Hamer OW, Aguirre DA, Casola G, Lavine JE, Woenckhaus M, Sirlin CB. Fatty liver: imaging patterns and pitfalls. Radiographics. 2006;26:1637-1653. [RCA] [PubMed] [DOI] [Full Text] [Cited by in Crossref: 285] [Cited by in RCA: 272] [Article Influence: 14.3] [Reference Citation Analysis (2)] |
| 5. | Kani KK, Moshiri M, Cuevas C, Lee JH, Mitsumori LM, Kolokythas O. Imaging patterns of hepatic steatosis on multidetector CT: pearls and pitfalls. Clin Radiol. 2012;67:366-371. [RCA] [PubMed] [DOI] [Full Text] [Cited by in Crossref: 3] [Cited by in RCA: 4] [Article Influence: 0.3] [Reference Citation Analysis (0)] |
| 6. | Vilgrain V, Ronot M, Abdel-Rehim M, Zappa M, d'Assignies G, Bruno O, Vullierme MP. Hepatic steatosis: a major trap in liver imaging. Diagn Interv Imaging. 2013;94:713-727. [RCA] [PubMed] [DOI] [Full Text] [Cited by in Crossref: 34] [Cited by in RCA: 36] [Article Influence: 3.0] [Reference Citation Analysis (0)] |
| 7. | Virarkar M, Szklaruk J, Jensen CT, Taggart MW, Bhosale P. What's New in Hepatic Steatosis. Semin Ultrasound CT MR. 2021;42:405-415. [RCA] [PubMed] [DOI] [Full Text] [Cited by in Crossref: 2] [Cited by in RCA: 7] [Article Influence: 1.8] [Reference Citation Analysis (0)] |
| 8. | Idilman IS, Ozdeniz I, Karcaaltincaba M. Hepatic Steatosis: Etiology, Patterns, and Quantification. Semin Ultrasound CT MR. 2016;37:501-510. [RCA] [PubMed] [DOI] [Full Text] [Cited by in Crossref: 47] [Cited by in RCA: 86] [Article Influence: 9.6] [Reference Citation Analysis (0)] |
| 9. | Wu M, Sharma PG, Grajo JR. The Echogenic Liver: Steatosis and Beyond. Ultrasound Q. 2020;37:308-314. [RCA] [PubMed] [DOI] [Full Text] [Reference Citation Analysis (0)] |
| 10. | Halvorsen RA, Korobkin M, Ram PC, Thompson WM. CT appearance of focal fatty infiltration of the liver. AJR Am J Roentgenol. 1982;139:277-281. [RCA] [PubMed] [DOI] [Full Text] [Cited by in Crossref: 76] [Cited by in RCA: 76] [Article Influence: 1.8] [Reference Citation Analysis (0)] |
| 11. | Lamba R, Fananapazir G, Corwin MT, Khatri VP. Diagnostic imaging of hepatic lesions in adults. Surg Oncol Clin N Am. 2014;23:789-820. [RCA] [PubMed] [DOI] [Full Text] [Cited by in Crossref: 13] [Cited by in RCA: 16] [Article Influence: 1.5] [Reference Citation Analysis (0)] |
| 12. | Ji JS, Lu CY, Wang ZF, Xu M, Song JJ. Epithelioid angiomyolipoma of the liver: CT and MRI features. Abdom Imaging. 2013;38:309-314. [RCA] [PubMed] [DOI] [Full Text] [Full Text (PDF)] [Cited by in Crossref: 36] [Cited by in RCA: 45] [Article Influence: 3.8] [Reference Citation Analysis (0)] |
| 13. | Cui DJ, Wu Y, Wen DH. CD34, PCNA and CK19 expressions in AFP- hepatocellular carcinoma. Eur Rev Med Pharmacol Sci. 2018;22:5200-5205. [RCA] [PubMed] [DOI] [Full Text] [Cited by in RCA: 5] [Reference Citation Analysis (0)] |
| 14. | Bao S, Gu J, Gan K, Fang Y, Wang T, Lin J, Zeng Z, Huang H. Glypican-3 and hepatocyte paraffin-1 combined with alpha-fetoprotein as a novel risk scoring model for predicting early recurrence of hepatocellular carcinoma after curative resection. Eur J Gastroenterol Hepatol. 2021;33:e603-e609. [RCA] [PubMed] [DOI] [Full Text] [Cited by in Crossref: 4] [Cited by in RCA: 5] [Article Influence: 1.3] [Reference Citation Analysis (0)] |
| 15. | Takahashi Y, Dungubat E, Kusano H, Ganbat D, Tomita Y, Odgerel S, Fukusato T. Application of Immunohistochemistry in the Pathological Diagnosis of Liver Tumors. Int J Mol Sci. 2021;22. [RCA] [PubMed] [DOI] [Full Text] [Full Text (PDF)] [Cited by in Crossref: 6] [Cited by in RCA: 34] [Article Influence: 8.5] [Reference Citation Analysis (0)] |
| 16. | Machado I, Vargas AC, Maclean F, Llombart-Bosch A. Negative MDM2/CDK4 immunoreactivity does not fully exclude MDM2/CDK4 amplification in a subset of atypical lipomatous tumor/ well differentiated liposarcoma. Pathol Res Pract. 2022;232:153839. [RCA] [PubMed] [DOI] [Full Text] [Cited by in Crossref: 1] [Cited by in RCA: 2] [Article Influence: 0.7] [Reference Citation Analysis (1)] |
| 17. | Saleem A, Narala S, Raghavan SS. Immunohistochemistry in melanocytic lesions: Updates with a practical review for pathologists. Semin Diagn Pathol. 2022;39:239-247. [RCA] [PubMed] [DOI] [Full Text] [Cited by in RCA: 25] [Reference Citation Analysis (0)] |


